Galaxy evolution in groups.
USGC U268 and USGC U376 in the Leo cloud
Abstract
With the aim of investigating galaxy evolution in nearby galaxy groups, we analysed the spectral energy distribution of 24 galaxies, members of two groups in the Leo cloud, USGC U268 and USGC U376. We estimated the ages and stellar masses of the galaxies by fitting their total apparent magnitudes from far-ultraviolet to near-infrared with population synthesis models. The comparison of the results for a subsample of galaxies with smooth particle hydrodynamic (SPH) simulations with chemo-photometric implementation, shows that in most cases the estimated stellar masses obtained with the two different approaches are in good agreement. The kinematical and dynamical analysis indicates that USGC U268 is in a pre-virial collapse phase while USGC U376 is likely in a more evolved phase towards virialization.
keywords:
Ultraviolet: galaxies; Galaxies: evolution; Groups: individual: USGC U268, USGC U376; Galaxies: dynamics; Method: numerical1 Introduction
The physical processes marking galaxy evolution leave their imprinting on the spectral energy distribution (SED). SEDs are consequently widely used for deriving the basic properties of galaxies, e.g. the mass and the average age of the stellar component, assuming a star formation history (SFH) (e.g. Searle et al., 1973; Larson and Tinsley, 1978; Salim et al., 2007).
This powerful diagnostic, applied to samples of galaxies in clusters, groups, and in the general field, can reveal environmental effects on their properties. In this context, Marino et al. (2010) combined ultraviolet data from the Galaxy Evolution Explorer (GALEX, Morrissey et al., 2007) and optical data from the Sloan Digital Sky Survey (SDSS) to study the galaxies of the “Local Group analog” LGG 225 in the Leo II cloud. Fitting the observed SEDs from far-UV (FUV) to near-IR (NIR) with stellar population models, the total stellar mass of the group was estimated between 5 and 35 1010 M⊙ and the ages of the stellar populations from a few to 7 Gyr.
| Group | RA | Dec. | Morph. | E(B-V)b | Incl. | Mean Hel. | BT | |
| Galaxy | (J2000) | (J2000) | type | velocity | ||||
| (h:m:s) | (d:m:s) | [mag] | [deg] | [km/s] | (AB mag) | |||
| U268 | ||||||||
| MRK 0408 | 09 48 04.8 | +32 52 58 | S? | 0.017 | 40.5 | 147040c | 14.840.48 | |
| NGC 3003 | 09 48 35.7 | +33 25 17 | Sbc | 0.013 | 90.0 | 149836c | 12.090.10 | |
| NGC 3011 | 09 49 41.2 | +32 13 16 | S0 | 0.016 | 38.6 | 154836c | 14.380.44 | |
| UGC 05287 | 09 51 28.1 | +32 56 35 | Sc | 0.014 | 41.2 | 148242c | 14.680.42 | |
| UGC 05326 | 09 55 24.5 | +33 15 47 | IB | 0.016 | 16.9 | 141545c | 14.460.40 | |
| IC 2524 | 09 57 33.0 | +33 37 11 | S0-a | 0.013 | 63.1 | 148710c | 14.840.49 | |
| NGC 3067 | 09 58 21.3 | +32 22 11 | SABa | 0.015 | 81.8 | 149136c | 12.570.12 | |
| UGC 05393 | 10 01 42.1 | +33 08 12 | SBd | 0.013 | 68.8 | 144825c | 14.790.38 | |
| UGC 05446 | 10 06 30.9 | +32 56 49 | Sc | 0.014 | 80.5 | 138342c | 15.220.40 | |
| NGC 3118 | 10 07 11.6 | +33 01 40 | Sbc | 0.018 | 90.0 | 131537c | 14.180.35 | |
| PGC2016633 | 09 48 02.68 | +32 54 01.7 | ? | 0.016 | 53.1 | 155247 | 17.090.50 | |
| PGC2042146 | 09 49 03.1 | +33 59 28.95 | ? | 0.010 | 44.5 | 14942 | 17.690.50 | |
| SDSSJ094911.28+342634.2 | 09 49 11.28 | +34 26 34.2 | ? | 0.012 | 14892 | |||
| SDSSJ094935.09+342616.3 | 09 49 35.09 | +34 26 16.3 | ? | 0.010 | 14882 | |||
| PGC082546 | 09 50 20.9 | +33 35 02 | Sc | 0.015 | 46.3 | 158629 | 16.890.36 | |
| NGC3021 | 09 50 57.1 | +33 33 13 | Sbc | 0.014 | 55.7 | 15403 | 12.38 0.27 | |
| UGC05282 | 09 51 10.4 | +33 07 53 | Sm | 0.014 | 67.6 | 155710 | ||
| PGC2025214 | 09 53 45.2 | +33 09 52.0 | ? | 0.013 | 57.2 | 152035 | 17.92 0.50 | |
| SDSSJ095430.02+320342.0 | 09 54 30.02 | +32 03 42.0 | ? | 14212 | ||||
| SDSSJ100309.92+323622.5 | 10 03 09.92 | +32 36 22.5 | ? | 0.015 | 156296 | |||
| PGC029522 | 10 08 58.0 | +32 00 38 | Sc | 0.018 | 57.7 | 146834 | 16.75 0.44 | |
| U376 | ||||||||
| NGC 3592 | 11 14 27.5 | +17 15 34 | Sc | 0.015 | 79.4 | 129820c | 14.310.30 | |
| NGC 3599 | 11 15 27.0 | +18 06 37 | S0 | 0.021 | 28.3 | 81231c | 12.720.08 | |
| NGC 3605 | 11 16 46.6 | +18 01 01 | E | 0.021 | 90.0 | 69539c | 13.000.28 | |
| UGC 06296 | 11 16 51.0 | +17 47 55b | I | 0.019 | 90.0 | 90926c | 14.020.41 | |
| NGC 3607 | 11 16 54.7 | +18 03 06 | E-SO | 0.021 | 34.9 | 95541c | 10.770.17 | |
| NGC 3608 | 11 16 59.0 | +18 08 55 | E | 0.021 | 47.0 | 119942c | 11.410.26 | |
| CGCG 096-024 | 11 17 58.0 | +17 26 29 | ? | 0.020 | 28.9 | 80766c | 14.940.29 | |
| UGC 06320 | 11 18 17.5 | +18 50 48 | ? | 0.023 | 20.3 | 11255c | 13.670.41 | |
| UGC 06324 | 11 18 22.1 | +18 44 18 | S0 | 0.022 | 90.0 | 106838c | 14.610.32 | |
| NGC 3626 | 11 20 03.9 | +18 21 24 | S0-a | 0.020 | 56.1 | 157037c | 11.640.23 | |
| NGC 3655 | 11 22 54.7 | +16 35 24 | Sc | 0.025 | 47.1 | 149039c | 12.160.07 | |
| NGC 3659 | 11 23 45.3 | +17 49 05 | SBd | 0.019 | 68.8 | 128239c | 12.760.48 | |
| NGC 3681 | 11 26 29.8 | +16 51 48 | Sbc | 0.026 | 15.2 | 123653c | 12.260.16 | |
| NGC 3684 | 11 27 11.2 | +17 01 48 | Sbc | 0.026 | 50.8 | 113139c | 12.150.11 | |
| NGC 3686 | 11 27 44.1 | +17 13 26 | SBbc | 0.024 | 42.0 | 109636c | 11.840.07 | |
| NGC 3691 | 11 28 09.4 | +16 55 14 | SBb | 0.026 | 47.4 | 108139c | 12.480.17 | |
| PGC 034537 | 11 18 06.0 | +18 47 53 | Sc | 0.023 | 23.3 | 11407 | 16.190.38 | |
| PGC 086629 | 11 18 21.4 | +17 41 51 | I | 0.021 | 0.0 | 10555 | ||
| UGC 06341 | 11 20 00.7 | +18 15 38 | Sd | 0.019 | 90.0 | 161142 | 15.960.39 | |
| PGC1534499 | 11 21 25.41 | +17 30 35.16 | Sm | 0.024 | 65.5 | 97957 | 16.300.50 | |
| PGC 086673 | 11 22 59.3 | +17 28 27 | I | 0.021 | 0.0 | 13834 | ||
| PGC 035087 | 11 25 01.8 | +17 05 09 | Sm | 0.025 | 12085 | |||
| PGC035096 | 11 25 10.8 | +16 53 04 | I | 0.026 | 51.0 | 10213 | 15.961.17 | |
| PGC 035426 | 11 29 54.4 | +16 25 46 | Imb | 0.027 | 10675 |
We are extending this analysis by studying groups characterized by different galaxy populations in the same Leo cloud. Marino et al. (2013) revisited the group membership and investigated the substructures of two groups, USGC U268 and USGC U376 (U268 and U376 hereafter).
In this work we derive the age of the stellar population (for an assumed SFH), the stellar mass, and the additional foreground extinction of galaxies in these two groups by fitting their SED with a grid of models computed with GRASIL code (Silva et al., 1998), adopting SFH for elliptical, spiral and irregular galaxies as defined in Marino et al. (2010, their Table 5). Together with the characterization of the galaxy and group properties, the objective of the present study is to compare results from the analysis with GRASIL models with those obtained from SPH simulations with chemo-photometric implementation, matching not only the integrated-SED but also the galaxy’s kinematical and morphological structure. This comparison validates the integrated-SED analysis approach, which can be applied to larger samples.
The paper is organized as follows. In Section 2 we present the observed SEDs of Ellipticals, Spirals and Irregulars of U268 and U376. In Section 3 we use synthetic galaxy populations models to interpret the SEDs, estimate ages and masses and compare SED-fitting results with SPH simulations. Kinematical and dynamical analysis of the groups is presented in section 4. Summary and conclusions are given in Section 5.


2 UV-optical photometry of galaxies in U268 and U376
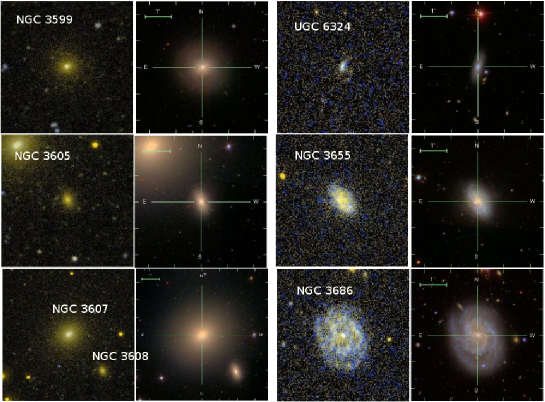
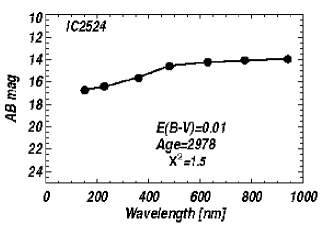
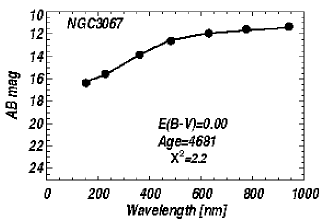
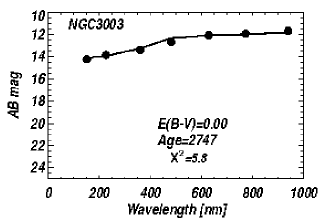
The member galaxies of U268 and U376 and their main characteristics are listed in Table 1. Figure 1 displays color composite UV and optical images of 6 members of U376 for which we compare results from SED-fitting and from SPH simulations with chemo-photometric implementation. We obtained broad band integrated magnitudes (AB system) in FUV (1344 -1786 Å) and near-UV (NUV, 1771 - 2831 Å) from GALEX and in u, g, r, i, and z from Sloan Digital Sky Survey (SDSS) data as described in Marino et al. (2013). Figures 2 and 3 show the SEDs of the sample galaxies, arranged by morphological type. Top panels show the Spirals with inclination smaller and larger than 60∘ respectively, and bottom panels Irregulars and Ellipticals/S0s. The SEDs of the spiral galaxies are all qualitatively similar at optical wavelengths, but show a range of slopes at FUV and NUV wavelengths, indicative of a varying relative contribution of the younger populations. Most of the Irregulars also show similar SEDs in optical bands but different slopes in UV bands. In addition to the recent star formation, a major factor affecting the UV fluxes is the extinction by interstellar dust. As expected, the SED of the Spirals seen edge-on (Figures 2 and 3, top right panels) appears in general ‘redder’ than that of Spirals with low (60∘) inclination (Figures 2 and 3, top left panels). Including only galaxies with photometric errors 0.3 mag in all bands (FUV, NUV, u, g, r, i, our sample includes 11 and 13 galaxies in U268 and U376, respectively.
3 Stellar mass and age of the sample galaxies
3.1 Model grids
In order to derive the age and mass of each galaxy we computed grids of models using the GRASIL code (Silva et al., 1998), for a large range of ages and three different SFHs. Extinction must be accounted for, in order to derive correct galaxy parameters. Internal extinction is included in the GRASIL models; in the SED-fitting process, we also solved for the amount of possible foreground extinction. We computed broad-band model magnitudes in the GALEX and SDSS bands, after progressively reddening the models by increasing amounts of dust. We adopted a Salpeter IMF and the typical parameters regulating the star-formation rate for spiral, irregular and elliptical types respectively, as given by Silva et al. (1998)111available at http://adlibitum.oat.ts.astro.it/silva/grasil/modlib/modlib.html., and Marino et al. (2010, their Table 5). An important feature of GRASIL is that the code includes the effect of age-dependent extinction with young stars being more affected by dust. In particular, it takes into account several environments with different dust properties and distributions, such as the AGB envelopes, the diffuse interstellar medium and the molecular clouds (MCs). The geometry of the spiral galaxies in GRASIL is described as a superposition of an exponential disc and a bulge component with a King profile for Spirals. For Ellipticals and Irregulars a spherically symmetric distribution for both stars and gas/dust with a King profile is adopted.
3.2 Analysis of the observed SEDs with model magnitudes
From the model spectra we computed synthetic broad-band magnitudes in the GALEX FUV, NUV and SDSS u, g, r, i, z filters. The resulting SEDs at some representative ages have been shown in Marino et al. (2010); their Figure 10 illustrates the effects of evolution (left panels) and extinction (right panels).
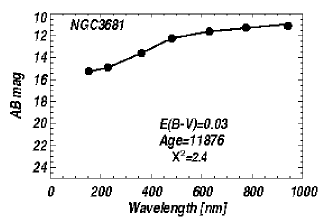
We used the model-magnitude grid from a few Myr to 13 Gyr to estimate, by SED fitting ( minimization), the best-fit age of the composite population for each galaxy. The best-fit model scaled to the observed fluxes provides an estimate of the current stellar mass, assuming the distances given in Marino et al. (2013), and accounting for extinction.
We performed SED fitting in two ways: first, assuming foreground extinction as given in Table 1, which is minimal, in addition to the internal extinction estimated by GRASIL and, second, by treating both the age of the population and an additional extinction component as free parameters. We compared the two results, and chose the one with the minimum . For all 11 galaxies in U268 and for all but 3 galaxies in U376, the best-fit solution confirms the low foreground extinction values ( 0.02 mag) found in previous compilations (Table 1). For most Ellipticals/S0s and Spirals the models with the SFH assumed for their respective type (see Table 5 in Marino et al., 2010) give good fits. The SEDs of three Spirals in U376 (NGC 3681, NGC 3684, and NGC 3686) and two in U268 (UGC 5393, NGC 3021), are also well fitted with the SFH assumed in our grid for Irregulars. We note that the 3 Spirals in U376 are located outside of the virial radius of the group (see Figure 6, left panels) and belong to a substructure (Marino et al., 2013, their Fig. 1). U268 does not contain Ellipticals, and the observed SEDs of S0s in this group are all well reproduced adopting a SFH for Spirals. Figures 4 and 5 show SED-fitting results for some galaxies with different morphological type belonging to U268 and U376. The age and stellar mass distributions of 11 and 13 galaxies in U268 and U376 respectively, for which good SED best-fits has been obtained, are shown in Figure 6 (right panels).
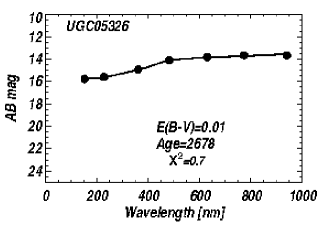
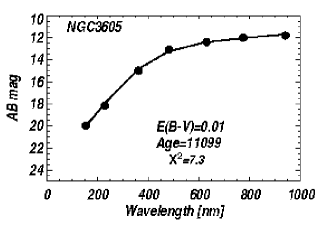
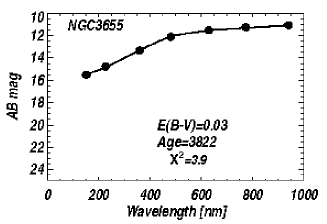
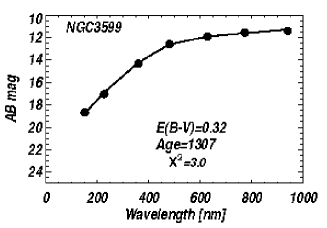
We have compared the results obtained with integrated stellar-population models, with those derived by Mazzei et al. (2013, this book, and in preparation) using SPH simulations with chemo-photometric implementation. Table 2 gives ages, stellar masses and E(B-V) of a subsample of galaxies in U376 derived with the two methods. Stellar masses agree within a factor of 2 in all but 1 case. The ages show large discrepancies for 2 galaxies, with SPH results giving systematically older ages, when discrepant, and consequently larger masses. The SFHs derived from the SPH analysis are in agreement with the SFHs from SED fitting, except for a few cases, and these explain some discrepant results in age and mass.
| Name | Morph. | Massa | Mass | Agea | Age | E(B-V) | E(B-V)SPH |
|---|---|---|---|---|---|---|---|
| Type | |||||||
| [10] | 10] | Gyr | Gyr | [mag] | [mag] | ||
| NGC 3599 | S0 | 1.1(0.6-2.0) | 1.4 - 2.0 | 13.00.5 | 12.3 | 0.01 | 0 |
| NGC 3605 | E | 0.6(0.4-1.6) | 1.1 - 1.6 | 11.10.5 | 12.6 | 0.01 | 0.01 |
| NGC 3607 | S0 | 6.0(3.3-6.8) | 9.1 -13.0 | 13.00.5 | 14 | 0.02 | 0.04 |
| NGC 3608 | E | 3.0(1.5-6.8) | 9.8 - 14.0 | 13.00.5 | 13.4 | 0.03 | 0.01 |
| UCG 06324 | S0 | 0.2(0.02-0.2) | 0.2 - 0.3 | 3.41.1 | 11 | 0.02 | 0 |
| NGC 3655 | Sp | 2.1(0.2-2.2) | 3.5 - 5.0 | 3.81.3 | 11.6 | 0.03 | 0.24 |
| NGC 3686 | Sp | 1.2(1.1-2.8) | 1.8 - 2.6 | 7.51.5 | 11.6 | 0.01 | 0.10 |
a Values from SED-fitting. The errors on the ages and masses include not only the uncertainties from contours, but the entire range of ages found when different SFHs (for Sp and Irr) are used.
b Range of mass: within the effective radius and total, from Mazzei et al (2013, in preparation).
c Uncertainties are 0.02 Gyrs.
4 Kinematic and dynamical properties of U268 and U376.
The virial theorem provides the standard method to estimate the mass of a self-gravitating system from dynamical parameters, i.e. positions and velocities of the group members. It is applicable if the system analyzed is in dynamical equilibrium and galaxies trace the mass of the system.
We derived the kinematic and dynamical properties of the two groups, following the approach described in Firth et al. (2006) and already used in Marino et al. (2010) for LGG 225. This approach allows us to obtain in an homogeneous way the properties of the two groups and to compare them with those of nearby groups.
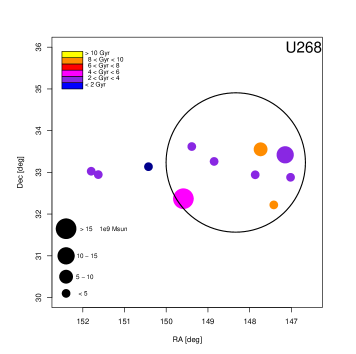
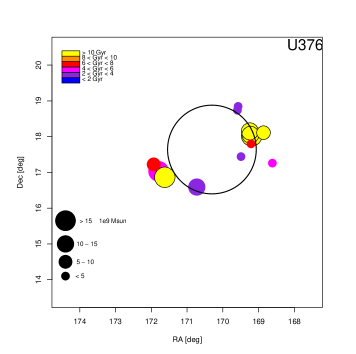
According to Firth et al. (2006), unaccounted dwarf galaxies do not significantly alter the group velocity dispersions, virial mass estimates or crossing times. The dynamical calculations are based on the formulae given in Firth et al. (2006, their Table 6). The results are summarized in Table 3. Errors in Table 3 have been computed via jackknife simulations (e.g. Efron, 1982). The mean velocity of the two groups differs slightly while the velocity dispersion of U376 is more than three times higher than that of U268. In order to obtain a measure of the compactness of the three groups, we have computed the harmonic mean radius using the projected separations rij between the i-th and j-th group member. Figure 6 shows the relative positions of the groups members, with each group scaled to a common distance. Each square in Figure 6 is approximately 2 2 Mpc2. The virial radius of U268 (circle in Figure 6) is significantly larger than that of U376, reflecting the more sparse projected spatial distribution of its members.
| Group | Center | Vgroup | Velocity | Dist. | Harmonic | Virial | Projected | Crossing |
|---|---|---|---|---|---|---|---|---|
| name | of mass | dispersion | radius | mass | mass | timeH0 | ||
| RA Dec | ||||||||
| [deg] [deg] | [km/s] | [km/s] | [Mpc] | [Mpc] | [1013 M⊙] | 1013 M⊙] | ||
| U268 | 148.7295 33.1294 | 1486 | 63 | 19.8 | 0.31 | 0.14 | 0.59 | 0.77 |
| U376 | 170.3058 17.6398 | 1134 | 225 | 15.1 | 0.21 | 1.19 | 2.98 | 0.13 |
The differences between the virial and projected mass for both groups are quite high (a factor between 3 and 4), with the projected masses higher than the virial masses. This difference is expected in systems where individual galaxies are close in projection. Using N-body simulations, Perea et al. (1990) showed that the virial mass estimate is better than the projected mass estimate since it is less sensitive to anisotropies or subclustering. However, it may be affected by the presence of interlopers, i.e. unbound galaxies, and by a mass spectrum. Both factors would cause an overestimation of the group mass, therefore the estimated masses are upper limits.
Another caveat concerning the virial mass is that the groups may not be virialized (e.g. Ferguson and Sandage, 1990). The crossing time is usually compared to the Hubble time to determine whether the groups are gravitationally bound systems. The derived crossing time of U268 suggests that it could be unvirialized, while U376 could be dynamically relaxed. The very small velocity dispersion of U268 still suggests that it could be in a pre-virialized phase.


5 Summary and conclusions
We have analyzed the integrated photometry of galaxies in U268 and U376 in the Leo cloud with a grid of stellar population synthesis models.
The overall results allow us to characterize the galaxy populations of the two groups: the composite populations of Spirals have evolutionary times between 1 and 9 Gyrs for U268 and from 2 to 6 Gyrs for U376, similar to those obtained for LGG 225 by Marino et al. (2010). The total stellar mass of the group (sum of the stellar mass estimated for each galaxy) is 6 M⊙ for U268 and 2 M⊙ for U376. The narrower age range of the Spirals in U376 may be connected to their position in the group, mostly outside the virial radius. The larger virial radius of U268 includes most of its Spirals and S0s. The best SED-fits of these galaxies have been obtained using SFH typical of Spirals. The higher stellar mass and the smaller virial radius of U376 suggest that it is more evolved than U268, with LGG 225 in between, as also suggested by their Color Magnitude Diagrams (see Marino et al., 2013, their figure 8).
The stellar masses derived with our SED model-fitting are consistent within a factor of two with results from SPH simulations with chemo-photometric implementation (available for 7 galaxies). Ages derived with the two approaches are consistent for 4 galaxies and discrepant for 3, the SPH analysis giving older ages for these. In some cases, more than one SED-fitting solution exist (several minima), that will be discussed in more detail elsewhere. At face value, differences in the discrepant cases suggest that the SFH of galaxies corresponds to a morphological type later than that adopted in our model grids. This is not surprising for galaxies located in the group environment in which several studies indicate that the galaxy life is quite eventful (e.g. Annibali et al., 2007; Marino et al., 2011c, b, a; Rampazzo et al., 2011).
Acknowledgments
RR, and AM acknowledge partial financial support by contract ASI-INAF I/009/10/0.
References
- Annibali et al. (2007) Annibali, F., Bressan, A., Rampazzo, R., Zeilinger, W.W., Danese, L., 2007. Nearby early-type galaxies with ionized gas. III. Analysis of line-strength indices with new stellar population models. A&A 463, 455–479. doi:10.1051/0004-6361:20054726, arXiv:arXiv:astro-ph/0609175.
- Efron (1982) Efron, B., 1982. The Jackknife, the Bootstrap and other resampling plans.
- Ferguson and Sandage (1990) Ferguson, H.C., Sandage, A., 1990. Population studies in groups and clusters of galaxies. III - A catalog of galaxies in five nearby groups. AJ 100, 1–31. doi:10.1086/115486.
- Firth et al. (2006) Firth, P., Evstigneeva, E.A., Jones, J.B., Drinkwater, M.J., Phillipps, S., Gregg, M.D., 2006. Kinematics, substructure and luminosity-weighted dynamics of six nearby galaxy groups. MNRAS 372, 1856–1868. doi:10.1111/j.1365-2966.2006.10993.x, arXiv:arXiv:astro-ph/0608584.
- Larson and Tinsley (1978) Larson, R.B., Tinsley, B.M., 1978. Star formation rates in normal and peculiar galaxies. ApJ 219, 46–59. doi:10.1086/155753.
- Marino et al. (2010) Marino, A., Bianchi, L., Rampazzo, R., Buson, L.M., Bettoni, D., 2010. Galaxy evolution in Local Group analogs. I. A GALEX study of nearby groups dominated by late-type galaxies. A&A 511, A29. doi:10.1051/0004-6361/200913216.
- Marino et al. (2011a) Marino, A., Bianchi, L., Rampazzo, R., Thilker, D., Annibali, F., Bressan, A., Buson, L.M., 2011a. Signatures of recent star formation in ring S0 galaxies. Ap&SS 335, 243–248. doi:10.1007/s10509-010-0588-3, arXiv:1101.0903.
- Marino et al. (2011b) Marino, A., Bianchi, L., Rampazzo, R., Thilker, D.A., Annibali, F., Bressan, A., Buson, L.M., 2011b. Tracing Rejuvenation Events in Nearby S0 Galaxies. ApJ 736, 154. doi:10.1088/0004-637X/736/2/154, arXiv:1105.3812.
- Marino et al. (2013) Marino, A., Plana, H., Rampazzo, R., Bianchi, L., Rosado, M., Bettoni, D., Galletta, G., Mazzei, P., Buson, L., Ambrocio-Cruz, P., Gabbasov, R.F., 2013. Galaxy evolution in nearby loose groups - II. Photometric and kinematic characterization of USGC U268 and USGC U376 group members in the Leo cloud. MNRAS 428, 476–501. doi:10.1093/mnras/sts039, arXiv:1209.4278.
- Marino et al. (2011c) Marino, A., Rampazzo, R., Bianchi, L., Annibali, F., Bressan, A., Buson, L.M., Clemens, M.S., Panuzzo, P., Zeilinger, W.W., 2011c. Nearby early-type galaxies with ionized gas: the UV emission from GALEX observations. MNRAS 411, 311–331. doi:10.1111/j.1365-2966.2010.17684.x, arXiv:1009.1931.
- Morrissey et al. (2007) Morrissey, P., Conrow, T., Barlow, T.A., Small, T., Seibert, M., Wyder, T.K., Budavári, 2007. The Calibration and Data Products of GALEX. ApJS 173, 682–697. doi:10.1086/520512.
- Paturel et al. (2003) Paturel, G., Petit, C., Prugniel, P., Theureau, G., Rousseau, J., Brouty, M., Dubois, P., Cambrésy, L., 2003. HYPERLEDA. I. Identification and designation of galaxies. A&A 412, 45–55. doi:10.1051/0004-6361:20031411.
- Perea et al. (1990) Perea, J., del Olmo, A., Moles, M., 1990. The effect of interlopers on the mass estimation in systems of galaxies. Ap&SS 170, 347–351. doi:10.1007/BF00652691.
- Ramella et al. (2002) Ramella, M., Geller, M.J., Pisani, A., da Costa, L.N., 2002. The UZC-SSRS2 Group Catalog. AJ 123, 2976–2984. doi:10.1086/340357, arXiv:arXiv:astro-ph/0202326.
- Rampazzo et al. (2011) Rampazzo, R., Annibali, F., Marino, A., Bianchi, L., Bressan, A., Buson, L.M., Clemens, M., Panuzzo, P., Zeilinger, W.W., 2011. Tracing the evolution of nearby early-type galaxies in low density environments. The ultraviolet view from GALEX. Ap&SS 335, 201–206. doi:10.1007/s10509-010-0586-5, arXiv:1101.0898.
- Salim et al. (2007) Salim, S., Rich, R.M., Charlot, S., Brinchmann, J., Johnson, B.D., Schiminovich, D., Seibert, M., Mallery, R., Heckman, T.M., Forster, K., Friedman, P.G., Martin, D.C., Morrissey, P., Neff, S.G., Small, T., Wyder, T.K., Bianchi, L., Donas, J., Lee, Y.W., Madore, B.F., Milliard, B., Szalay, A.S., Welsh, B.Y., Yi, S.K., 2007. UV Star Formation Rates in the Local Universe. ApJS 173, 267–292. doi:10.1086/519218, arXiv:0704.3611.
- Searle et al. (1973) Searle, L., Sargent, W.L.W., Bagnuolo, W.G., 1973. The History of Star Formation and the Colors of Late-Type Galaxies. ApJ 179, 427–438. doi:10.1086/151882.
- Silva et al. (1998) Silva, L., Granato, G.L., Bressan, A., Danese, L., 1998. Modeling the Effects of Dust on Galactic Spectral Energy Distributions from the Ultraviolet to the Millimeter Band. ApJ 509, 103–117. doi:10.1086/306476.