Screening and Collective Modes in Disordered Graphene Antidot Lattices
Abstract
The excitation spectrum and the collective modes of graphene antidot lattices (GALs) are studied in the context of a -band tight-binding model. The dynamical polarizability and dielectric function are calculated within the random phase approximation. The effect of different kinds of disorder, such as geometric and chemical disorder, are included in our calculations. We highlight the main differences of GALs with respect to single-layer graphene (SLG). Our results show that, in addition to the well-understood bulk plasmon in doped samples, inter-band plasmons appear in GALs. We further show that the static screening properties of undoped and doped GALs are quantitatively different from SLG.
pacs:
73.21.La,72.80.Vp,73.22.PrI Introduction
Graphene antidot lattices (GAL) – regular nanoscale perforations of the pristine graphene sheet – offer a way of creating a band gap in graphene. Earliest investigations Shima and Aoki (1993) of these structures date in fact back to the dark ages before the graphene era,Novoselov et al. (2004) but new momentum was gained when Petersen et al.Pedersen et al. (2008) speculated in 2008 that these structures may have many interesting applications, even as a platform for spin-based quantum computation. Subsequently, scores of theoretical papers have addressed various properties of GALs using a variety of theoretical tools (e.g., Dirac cone approximation for the underlying graphene spectrum,Pedersen et al. (2008) density functional theory,Furst et al. (2009) or within the tight-binding modelYuan et al. (2013)). Rather than attempting to review this vast literature, we merely state that in our opinion the electronic structure and its dependence on the underlying lattice symmetry and shape of the antidots,Petersen et al. (2011); Liu et al. (2013) as well as transport and optical properties of perfect GALs, are fairly well understood, Furst et al. (2009) and what remains to be investigated concerns the role of interactions, disorder, and extension of the present theoretical methods to systems with large unit cells, such as the ones encountered in the laboratory. What really has made GALs interesting is the rapid development in fabrication techniques, and today several methods exist to create (reasonably) regular structures with periods in low tens of nanometers - a length scale at which the created gaps are predicted to be in hundreds of millivolts, i.e., approaching the technologically relevant numbers. A short and incomplete catalogue of fabrication methods includes block-copolymer masks,Kim et al. (2010); Bai et al. (2010); Kim et al. (2012) nanoimprint lithography,Liang et al. (2010) e-beam lithography (either using conventional masksShen et al. (2008); Begliarbekov et al. (2011); Giesbers et al. (2012); Zhang et al. (2013) or focused e-beam direct writing of holesRodriguez-Manzo and Banhart (2009)), ion beam etching,Eroms and Weiss (2009) nanosphere masks,Sinitskii and Tour (2010); Wang et al. (2013) or nanoporous alumina membranes as etch masks.Tada et al. (2011); Shimizu et al. (2012); Zeng et al. (2012)
The extraordinary electronic and optical properties of graphene have recently brought a lot of attention to this material as an ideal candidate for plasmonics applications.Grigorenko et al. (2012) Plasmons, which are collective density oscillations of an electron liquid,Ando et al. (1982); Giuliani and Vignale (2005) have been extensively studied in pristine graphene within the random phase approximation (RPA), see, e.g. Refs. Shung, 1986; Wunsch et al., 2006; Hwang and Sarma, 2007; Roldán et al., 2010. In fact, understanding the screening properties of this material is essential in order to exploit its unique properties for plasmonic devices.Grigorenko et al. (2012) However, we are aware of only one paper (of which one of us is a co-author of) of screening in GALs;Schultz et al. (2011) in that paper the polarization function and plasmons of perfect GALs were studied in the limit ( is the wave-vector and is the graphene lattice constant). In the present paper we present extensive, and complementary, results for the finite case: using a numerical method we study the screening properties of disordered GALs. The density of states (DOS) is obtained from a numerical solution of the time-dependent Schrödinger equation,Yuan et al. (2010) and the polarization function is calculated from the Kubo formula.Yuan et al. (2010, 2011a) The dielectric function is obtained within the RPA, using the numerically computed polarization functions. The presence of disorder is unavoidable in experimental realizations of GALs. Here, we consider the generic kinds of disorder found in these systems, such as a random deviation of the periodicity and fluctuations of the radii of the nanoholes from the perfect array, as well as the effect of resonant scatterers in the sample (such as vacancies, adatoms, etc.). We find that gapped and almost dispersionless plasmons may exist in GALs, due to inter-band transitions between the narrow bands characteristic of the GAL spectrum. However, these modes are expected to be highly damped. For doped samples, the classical plasmon mode with a dispersion relation proportional to is also present. However, we find that the dispersion of this mode differs substantially from the corresponding dispersion of the plasmon mode in SLG. Finally, we study the main characteristics of the static screening in GALs, paying special attention to their differences with respect to SLG.
II Model and method
We model a disordered GAL by the real space tight-binding HamiltonianYuan et al. (2013)
| (1) |
where () creates (annihilates) an electron on site of the honeycomb lattice of graphene, is the nearest neighbor hopping integral and is the on-site potential. The effect of isolated vacancies can be modeled by setting the hopping amplitudes to other sites to zero or, alternatively, with an on-site energy . Further, additional resonant impurities, such as hydrogen adatoms, can be accounted by the term in Eq. (1):
| (2) |
where is the on-site potential on the “hydrogen” impurity and is the hopping amplitude between carbon and hydrogen atoms.Robinson et al. (2008); Wehling et al. (2010); Yuan et al. (2010) In our calculations, we fix the temperature to K and use periodic boundary conditions for both the polarization function and the density of states. The size of the system used in our simulations is atoms. Throughout this paper we ignore the effects due to spin (in our previous work Yuan et al. (2013) we give a short discussion of this point), and thus the spin degree of freedom merely contributes a degeneracy factor 2 and is omitted for simplicity in Eq. (1).
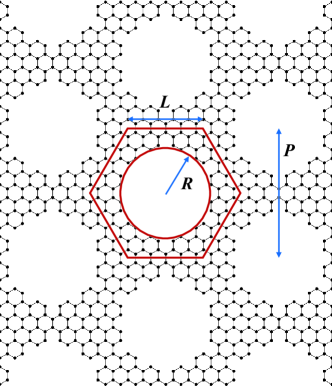
Following Refs. Pedersen et al., 2008; Yuan et al., 2013, we model a GAL by creating a hexagonal lattice of (approximately) circular holes of a given radius , and a separation between the centers of two consecutive holes, where is the side length of the hexagonal unit cell (see Fig.1). GALs in this symmetry class can be labeled by the parameters , in units of the graphene lattice constant Å, where Å is the interatomic separation. It should be noted that there are many other possible realizations of a GAL: both the antidot shape and its edge structure, as well as the underlying lattice symmetry can be varied in a number of ways. The present model is chosen for several reasons: it is a generic model used in many previous studies, and it displays a gapped band structure,Petersen et al. (2011); Liu et al. (2013); Foo (a) which is of special interest for the present study (see Fig. 2). Further, to the best of our knowledge, no experiments on plasmons in GALs have yet been reported, and in a proof-of-principle study (such as the present one) a thorough exploration of the vast parameter space does not seem warranted. On the other hand, when experiments emerge we can easily extend our calculations to any particular geometry. We consider two kinds of geometric disorder in our systems, which lead to deviations of the GALs from perfect periodicity. First, we allow the center of the holes to float with respect to their position in the perfect periodic lattice around . Second, we allow the radius of the holes to randomly shrink or expand within the range . All along this paper, we express and in units of .


The algorithm used in our numerical calculations is based on an efficient evaluation of the time-evolution operator (we use units such that ) and Fermi-Dirac distribution operator ( where is the temperature and is the Boltzmann constant, and is the chemical potential) in terms of the Chebyshev polynomial representation.Roche and Mayou (1997); Yuan et al. (2010) The initial state is a random superposition of all the basis states in the real space, i.e.,Hams and De Raedt (2000); Yuan et al. (2010)
| (3) |
where is the electron vacuum state and are random complex numbers normalized as . Since one initial state in our calculation contains all the eigenstates of the whole spectrum, averaging over different initial states is not required in our numerical computations.Hams and De Raedt (2000); Yuan et al. (2010) Moreover, since the system used contains millions of carbon atoms, and one specific disorder configuration contains a large number of different local configurations, there is no need to average over different realizations of the disorder.Yuan et al. (2010) As shown in Refs. Hams and De Raedt, 2000; Yuan et al., 2010, the density of states (DOS) of the system can be calculated from the Fourier transform of the overlap between the time-evolved state and the initial state :
| (4) |
Furthermore, the dynamical polarization can be obtained from the Kubo formula Kubo (1957) as
| (5) |
where denotes the area of the unit cell, is the density operator, and the average is taken over the canonical ensemble. For the case of the single-particle Hamiltonian, the polarization function (5) can be written asYuan et al. (2010)
By introducing the time evolution of two wave functions
| (7) | |||||
| (8) |
we obtain the real and imaginary part of the dynamical polarization asYuan et al. (2011b)
In the numerical calculation, the integral of Eq. (5) and (II) is replaced by the sum of integrated function at finite time steps. The value of the time step is set to be which is small enough as to cover the whole spectrum. Here is the maximum absolute value of the energy eigenvalues, and for pristine graphene and GALs it is . The number of time steps determines the energy resolution and typically we use 1024 time steps. We also use a Gaussian window to alleviate the effect of the finite time used in the numerical integration in Eq. (5) and (II).
We notice here that the presence of the antidot array breaks the translational invariance of the graphene layer. Hence, in the most general case, the polarization function should be a matrix in the , space, where and are reciprocal lattice vectors associated to the new periodicity imposed in the system by the GAL.Schultz et al. (2011) Therefore, in writing the polarization function in the form of Eq. (5), we are neglecting local field effects, which is equivalent to assuming that the relevant wave-vectors are small compared to the reciprocal lattice vectors . This approximation is justified for the small value of considered here, , although local field effects should be taken into account for large values of . This effect is beyond the scope of this paper, and it will be discussed in a future work.111S. Yuan et al., in preparation. Furthermore, the dynamical polarization function is anisotropic and depends on the direction of in the Brilloiun zone. In this paper, for simplicity, we fix the wave-vector along K- direction.
The screening properties of the GAL are determined by the dielectric function , which we consider here within the RPA:
| (10) |
where
| (11) |
is the 2D Fourier transformation of the Coulomb interaction, and is the dielectric constant of the embedding medium (we take in all our plots ). Although self-energy and vertex corrections are not included within the RPA, this approximation is sufficient to capture the main features of the plasmon modes, which is the main focus of this work. From the dielectric function, we can study the collective excitations of the system. The dispersion relation for the collective modes is obtained from the solution of
| (12) |
where is the energy of the collective (plasmon) mode. The condition for those modes to be long-lived is that , such that the plasmon cannot decay into electron-hole pairs. Otherwise, there will be a finite damping of the mode .
III Dielectric function and collective modes
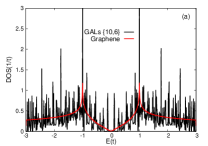
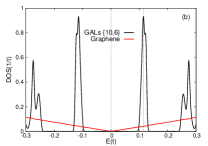
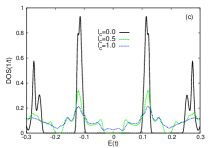
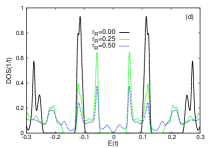
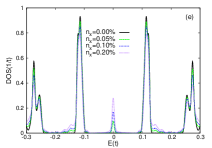
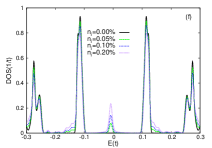
In this section we present the results for the polarization and dielectric function of GALs, analyzing their main differences with respect to SLG. For completeness, we summarize the salient results for the effect of the antidot lattice on the DOS (both pristine and disordered systems), as discussed in our earlier papers.Pedersen et al. (2008); Yuan et al. (2013) The DOS of a GAL follows from Eq. (4), and the results are shown in Fig. 3. The lattice of antidots splits the broad and bands of SLG into a number of gapped, narrow and flat bands, modifying the DOS of SLG [given by the red line in Fig. 3(a)-(b)] into a set of peaks associated to the Van Hove singularities of the subbands of the antidot lattice [black lines in Fig. 3 (a)-(b)]. Figs. 3(c)-(d) show the modification in the DOS of GALs due to geometrical disorder, associated to irregularities in the antidot lattice, such as changes in the center-to-center distance of the etched holes, or to variations in the size of the holes. In general, the gaps are rather robust against geometrical disorder, and only after a large deviation of the GAL array from the perfect periodicity, the gaps close. We further show the effects of resonant impurities, such as vacancies or adatoms, in the DOS of GALs [Fig. 3(e)-(f)]. This kind of defects leave the structure of the DOS practically unchanged, apart from the creation of a midgap band associated to localized states around the impurities, which leads to the peak at in the DOS.
III.1 Electron-hole continuum and collective modes
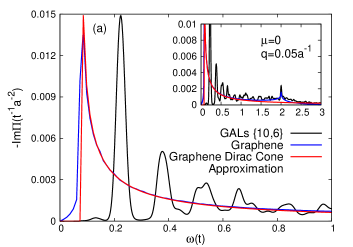
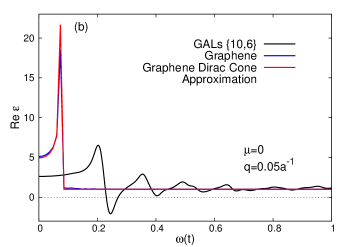
The structure of the DOS discussed above will be useful to understand the polarization and dielectric functions of GAL. We first consider the case of a clean GAL. Our results for and as a function of frequency , are shown in Fig. 4. In the undoped regime [Figs. 4(a)-(b)] we obtain an which consists of a series of peaks (the black line in Fig. 4(a)), which indicate the electron-hole continuum in GALs, defined as the region of the energy/momentum plane where particle-hole excitations are possible. For comparison, we also show the polarization function for undoped SLG from a -band tight-binding modelYuan et al. (2011b) (blue line) and within the Dirac cone approximation (red line). In both cases, undoped graphene and undoped GAL, only inter-band transitions are possible. However, there are strong differences in the two spectra. On the one hand, the inter-band electron-hole excitation spectrum in SLG is a continuum which (near the Dirac point) corresponds to the region in the plane in which , where is the Fermi velocity of graphene near the Dirac point. In fact, is a monotonic function for a broad range of energies, Fig. 4(a). At high energies, of the order of eV, the spectral function shows a peak which is associated to inter-band transitions between states of the Van Hove singularities of the valence and of the conduction bands [see inset of Fig. 4(a)]. Notice that this effect is not captured by the Dirac cone approximation (red line), which is valid only for transitions in the vicinity of the Dirac point. The electron-hole excitation spectrum is qualitatively different for GALs, the black line of Fig. 4(a). Most saliently, there are regions of zero spectral weight in , which are associated to the inter-band gaps opened in the GAL band structure, as compared to the continuum spectrum associated to the broad and bands in graphene [see e. g. Figs. 3(a) and (b) for the corresponding DOS].
Also the dielectric function of undoped GALs and SLG are qualitatively different, as shown in Fig. 4(b). The oscillatory DOS of the GAL leads to a dielectric function with an oscillatory behavior, too. Second, focusing on collective excitations, which are obtained from Eq. (12), we observe that vanishes for undoped GALs at least once, whereas there is no solution of Eq. (12) for undoped graphene (the blue and red lines in Fig. 4(b)). This is the well-known result about the absence of plasmons in undoped SLG within the RPA.Shung (1986); Wunsch et al. (2006); Hwang and Sarma (2007); Roldán et al. (2010) The situation is rather different for GALs, whose peculiar band structure and DOS lead to a collective mode which is associated to inter-band electron-hole transitions between the valence and conduction bands, with energies (for the structure) , as it is shown in Fig. 3(b). However, this mode cannot be considered as a fully coherent plasmon since its dispersion lies in a region of the spectrum where . Therefore, such a mode will be damped, decaying into electron-hole pairs. It is interesting to notice that this mode has a similar origin as the so-called -plasmon mode in graphene,Yuan et al. (2011b) which is a damped mode in single-layer and multi-layer graphene originated from particle-hole transitions between the Van Hove singularity of the valence band at eV and the Van Hove singularity of the conduction band at eV, and which has been observed by EELS experiments.Eberlein et al. (2008)


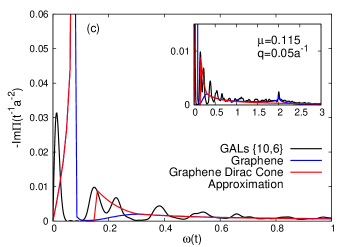
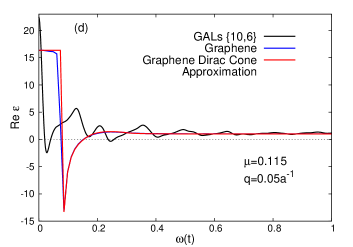
The results for doped GALs are shown by the black lines in Fig. 4(c)-(d), which are compared to the results of SLG from a -band tight-binding model (blue lines) and from the Dirac cone approximation (red lines). The chemical potential is such that the Fermi energy lies within the first peak in the DOS, as shown by the corresponding dotted black line of Fig. 3(b). Here we define the chemical potential as measured from the Dirac point energy in graphene. In GAL, since it is a semiconductor, it is useful to define , where is the gap energy and is the Fermi energy measured, as usual, from the bottom of the conduction band. One first notices that has two different contributions: one at low energies, which is due to intra-band excitations, and which is very narrow due to the small bandwidth of the doped band in GAL. This bandwidth imposes a limit for the energy of intra-band transitions. The second contribution emerges (for ) at , and is due to inter-band excitations across the band gap. This is the counterpart of the inter-band electron-hole continuum in SLG, and it is the only contribution in the case, as discussed above. Interestingly, doping leads to a new plasmon mode in the spectrum, as seen by the zeros of in Fig. 4(d). This solution of Eq. (12) corresponds to the usual plasmon mode which, in this case, is long-lived due to the fact that it disperses (for a certain range of energies) in the region of the space where . In fact, such a mode is present also in SLG, as seen by the zero-energy cut of the blue line in Fig. 4(d). However, for a given wave-vector, the energy at which is different for GAL and for SLG, and hence the dispersion of the plasmon is very different in the two cases. In particular, from our results one can expect that the velocity of the mode (given by the slope of the band dispersion) will be lower in GAL than in SLG. Considering that in 2D the dispersion relation of the plasmons at low energies can be approximated byGiuliani and Vignale (2005)
| (13) |
where is the carrier density and is the effective mass of the band, our numerical result for the existence of slow plasmons in GALs is expected due to the flatness of their bands [see Fig. 2(b)], which typically implies large effective masses. Furthermore, we notice that the theoretical studies for the band structure of GALs show that they have a direct gap, located in the point of the Brillouin zone.Pedersen et al. (2008) The minimum of the conduction band and the maximum of the valence band can be well approximated, in leading order, by a parabolic band dispersion, whose effective mass is simply related to the DOS, , by the usual relation , where is the spin degeneracy. Therefore, taking into account that the nano-perforation of the graphene lattice allows to manipulate the DOS of the system, the corresponding dispersion relation of the plasmon mode will be specific and different for each pair that characterizes a given GAL.
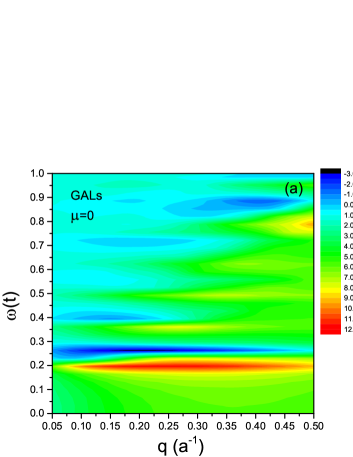
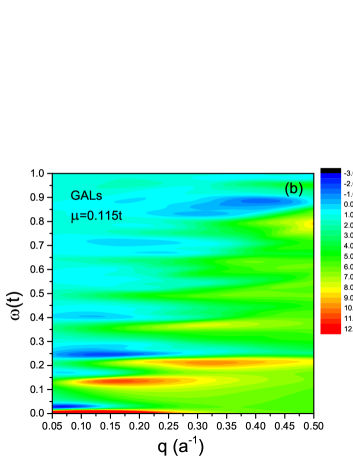
These features are more clearly seen in Fig. 5, where we show a density plot of in the plane. Consider first the undoped case, Fig. 5(a). In the absence of charge carriers, the GAL does not exhibit any low energy plasmon mode, and the first line of zeros of the dielectric function corresponds to the gapped plasmon which is associated, as discussed above, to inter-band transitions between states of the bands adjacent to the Fermi level . The energy of the mode at coincides with the gap opened in the band structure, for the present case, and it is almost dispersionless.Foo (b) The reason for this weak dispersion of the gapped mode is the narrowness and flatness of the bands involved in the inter-band transitions. Apart from this well defined mode with a gap , Fig. 5(a) also shows several resonances at higher energies. They are signatures of electron-hole transitions of higher energies, associated to the bands which lead to the different peaks in the DOS of Fig. 3. Similarly as in SLG,Eberlein et al. (2008) this structure should be accessible by means of EELS experiments, which could be useful to determine the main gap, as well as the characteristic energies of the other flat bands, which would lead to further resonances in the EELS spectrum.
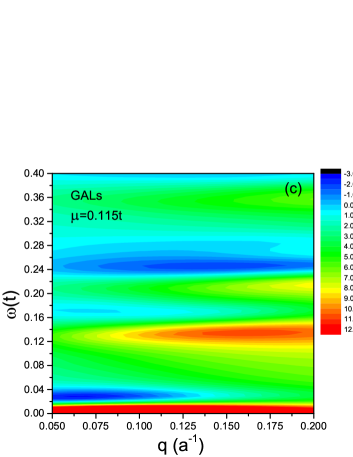
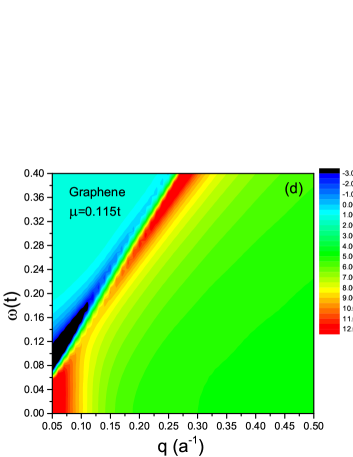
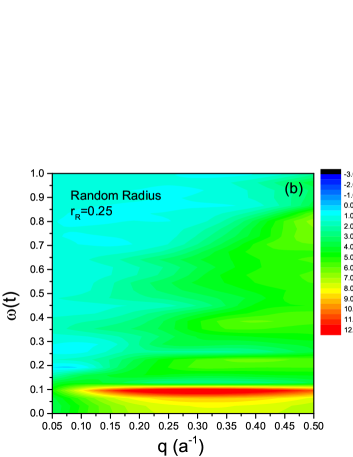
The situation is different for doped GALs, Fig. 5(b). Apart from the gapped mode (with ) discussed above, we observe a strong feature at low energies which corresponds to the gapless classical plasmon, with dispersion relation given by Eq. (13). The low energy and small- region of the spectrum of doped GAL is shown for clarity in Fig. 5(c), where we observe the existence of a collective mode in a region of the spectrum which, for the corresponding undoped case of Fig. 5(a), is entirely featureless. This collective mode is the counterpart of the well known plasmon mode characteristic of a 2DEGStern (1967); Ando et al. (1982) or doped SLG.Shung (1986); Wunsch et al. (2006); Hwang and Sarma (2007); Roldán et al. (2010) For comparison, we show a density plot of for doped SLG in Fig. 5(d), where one can clearly observe the classical plasmon mode with .Foo (b) By comparing Fig. 5(d) to Fig. 5(c), we observe that the slope of the plasmon mode in SLG is much higher than the corresponding slope of the low energy plasmon in doped GAL. The qualitatively different band structures of SLG and GAL explain the different behaviors of the plasmon mode in the two systems. Furthermore, notice that the plasmon is the only active mode in doped SLG [Fig. 5(d)], which does not present additional optical resonances at higher energies, as the ones present in the spectrum of GALs [Fig. 5(b)].
III.2 Effect of disorder
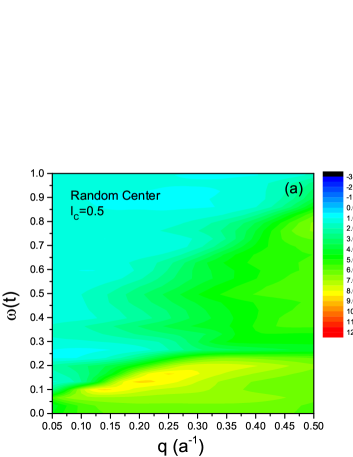
We next address the effects due to disorder. We have considered two main sources of disorder: geometrical disorder, which accounts for deviations of the GAL from the perfect periodicity, and resonant impurities, which can be associated to vacancies in the graphene lattice, or to adatoms which can be adsorbed by the surface. The results are shown in Fig. 6. The modification of the band structure and DOS due to geometrical disorder, as shown by Fig. 3(c)-(d), leads to a dramatic effect on the structure of the spectrum, as can be seen by comparing Figs. 6(a)-(b) to Fig. 5(a). Changes in the center-to-center separation of the antidots leads to a blurring of the resonance peaks in the spectrum, as it is seen in Fig. 6(a), where the feature associated to the gapped plasmon with energy has practically disappeared. In fact, no zeroes are present in the dielectric function after this kind of disorder is considered, what means that the plasmon mode has disappeared.
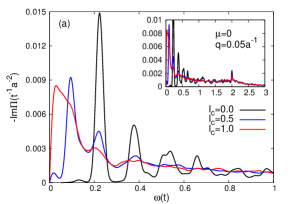
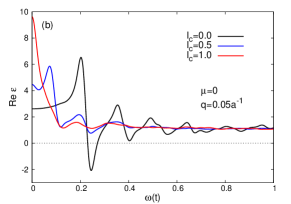
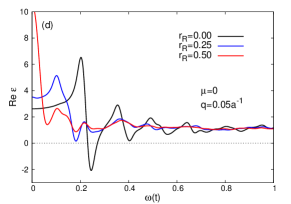
In Fig. 7 we show results for the polarization and dielectric function of GAL, obtained from Eqs. (5) and (10), in the presence of geometrical disorder for the wave-vector . The presence of geometrical disorder can lead to the disappearance of the plasmon mode. This can be seen in Fig. 7(b) and (d), where there is an absence of zeros for the dielectric function of disordered GALs (blue and red lines), whereas for clean GAL clearly shows a solution for the plasmon equation (12). Furthermore, the well separated bands of clean GAL leads to a discretization of the electron-hole continuum at low energies. This can be seen by looking at the black line in Fig. 7(a) and (b), which shows an absence of spectral weight between the well defined peaks of at low energies. However, the presence of geometrical disorder strongly modifies the band structure, and as a consequence, there is a transfer of spectral weight to the gapped regions of the spectrum.


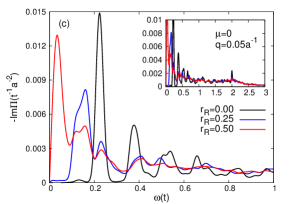
Therefore, the impurity bands which emerge in the spectrum due to the presence of geometrical disorder, leads to a significant modification of the electron-hole continuum as well as the dielectric function, and the results for GAL with this kind of disorder does not show any signature of plasmons. Nevertheless, notice that a resonance is still visible in the spectrum of a GAL in which the size of the holes vary within some range, at an energy which is smaller than the energy of the plasmon mode in the clean GAL sample. This is shown in Fig. 6(b), where still a pronounced resonance is observed at an energy . The reason for low energy feature is clearly understood by looking at the green dashed line of Fig. 3(d), which corresponds to the DOS of a GAL sample with this kind of geometrical disorder, and where we see that two new peaks have emerged in the DOS at energies . Therefore, the resonance in Fig. 6(b) at has its origin in electron-hole transitions between those bands created in the spectrum by the effect of random radius geometrical disorder. We emphasize that this is not a plasmon, since it does not correspond to a zero of the dielectric function.
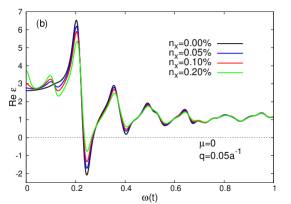
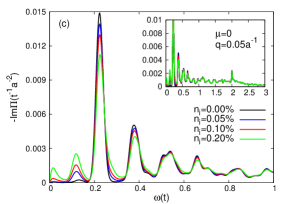
We have also considered the effect of resonant impurities in the spectrum. This kind of disorder has a less dramatic effect on the excitation spectrum of the system, as it is shown in Fig. 6. Both, random distribution of vacancies and random distribution of hydrogen impurities in the sample, have a similar effect on the dielectric function of GAL, leading to a broadening of the plasmon modes, which are more efficiently damped due to the presence of this kind of impurities. However, these features still correspond to a plasmon mode: this is proved by looking at the plots of Fig. 8 (b) and (d), which present well defined zeros for both, clean and disordered samples. Furthermore, the energies of the gapped modes remain almost unchanged as compared to the spectrum of a perfect and clean GAL [Fig. 5(a)]. However, there is an additional transfer of spectral weight to the low energy region of the spectrum, associated to the impurity bands which have been created and which account for localized states around the impurities.Yuan et al. (2013) This feature in the spectrum is especially visible in Fig. 8(a) and (c), where we observe a contribution to the polarization function in the low energy region of the spectrum which increases with the concentration of impurities in the sample.
IV Static screening


In this section we focus on the static dielectric screening of a GAL: we calculate the polarization and dielectric function in the limit, using the Kubo formula Eq. (5). The results for clean and disordered GALs, as compared to the corresponding polarization and dielectric function for SLG, are shown in Fig. 9. We start by reviewing the main characteristics of the static screening in SLG. As is well known,Shung (1986); González et al. (1994); Wunsch et al. (2006); Hwang and Sarma (2007); Roldán and Brey (2013) undoped SLG shows a linear increase of the static polarization function with , , associated to inter-band transitions. Such contribution is shown by the solid black line in Fig. 9(a). For doped SLG, there is an extra contribution due to intra-band excitations, which can be written as
| (14) |
where is the DOS at the Fermi level. Both contributions lead to a constant static polarization function at small wave-vectors, as it is shown in Fig. 9(c), typical of metallic screening,Giuliani and Vignale (2005) whereas the inter-band linear term leads to an insulating like screening. The above polarization function leads to a static dielectric function for SLG as shown by the solid black lines of Fig. 9(b), (d). Undoped SLG has a constant dielectric function, for the parameters used in this work, and it corresponds to the black horizontal line of Fig. 9(b). Doping a SLG leads, as we have mentioned above, to a metallic like screening with the corresponding divergence as , as it is shown by the continuous black line in Fig. 9(d).
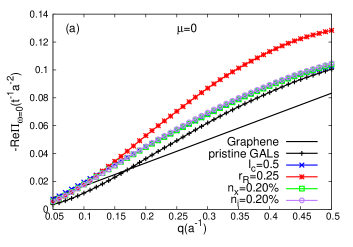
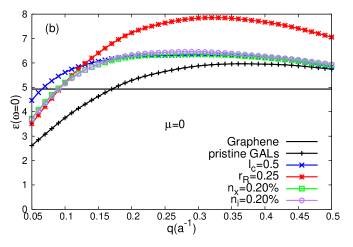
The situation is different in GALs. First, Fig. 9(a) shows a static polarization function that grows with , as in undoped SLG, signaling a semiconducting type of screening. However, by comparing the results of undoped GAL of Fig. 9(a)-(b) to the corresponding results of undoped SLG, we observe a transition from a region where , at long wavelengths, to a region where at shorter wavelengths. Therefore, we can expect a poorer screening at long wavelengths in undoped GALs, as compared to undoped SLG, whereas this tendency is inverted for shorter wavelengths, for which our results suggest a more efficient screening in GALs than in SLG. The effect of different kinds of disorder in the GAL tends to reinforce this tendency, as we can see by corresponding curves for disordered GAL in Fig. 9(a)-(b), although the qualitative behavior of the polarization and dielectric function is not modified by disorder.
The differences in the static screening between GAL and SLG are even stronger in the doped regime. As we can see in Fig. 9(c)-(d), for a GAL first grows linearly with , until it reaches a maximum for a characteristic wave-vector. This is clearly different to the polarization function of doped SLG, which is constant with a magnitude given by the DOS at the Fermi level. At large values of , is again linear with a slope similar to that of SLG, indicating a semiconductor-like screening at large values of . This difference is seen also in the dielectric function of doped GALs, Fig. 9(d), which does not show the divergence at , representative of metallic screening, but instead it presents a maximum at a given wavelength, and then it decreases for smaller wave-vectors. Notice that no disorder is considered in this calculation for doped GAL. We point out here that this behavior of clean doped GAL is similar to the polarization and dielectric functions obtained for disordered undoped SLG in the presence of resonant scatterers.Yuan et al. (2012) In Ref. Yuan et al., 2012 this bad metal behavior in SLG below a characteristic length scale was identified with Anderson localization. It is important to notice that, whereas the localized states in SLG with resonant impurities are concentrated around the impurities, in clean GAL the corresponding states are localized at the edges of the antidots.Gunst et al. (2011); Yuan et al. (2013) A more rigorous study should be made in order to confirm if the reason for the dielectric properties observed here for GALs might have the same origin as in chemically functionalized graphene studied in Ref. Yuan et al., 2012.
V Conclusions
In summary, we have performed a systematic study of the dielectric properties of GALs. For this aim, we have used a tight-binding model in a perforated honeycomb lattice of carbon atoms. The DOS, which has been calculated from a numerical solution of the time-dependent Schrödinger equation, shows a dramatic modification of the and bands of SLG into a set of narrow and flat bands. We have further considered the most generic sources of disorder in these kind of samples: geometrical disorder such as random deviation of the periodicity and of the radii of the nanoholes from the perfect array, as well as the effect of resonant scatterers in the sample (e.g., vacancies, adatoms, etc.). The polarization function has been obtained by using the Kubo formula for non-interacting electrons, and electron-electron interactions have been considered within the RPA. We have analyzed the main differences between the electron-hole continuum, which limits the phase space available for particle-hole excitations, of a GAL as compared to SLG. The conditions for the existence of plasmon modes have been identified, and we find that damped and gapped plasmons may exist in undoped GALs, associated to inter-band transitions between the flat bands with a large DOS due the antidot array. Those modes have a similar origin as the so-called -plasmons in SLG, which are due to inter-band transitions between states of the Van Hove singularities of and bands in SLG.Eberlein et al. (2008); Yuan et al. (2011b) Furthermore, the inter-subband plasmons in GALs are found to be almost dispersionless and, in principle, they should be accessible by means of EELS experiments,Eberlein et al. (2008) which could give information about the size of the gap opened in the sample. For a doped GAL, when the chemical potential crosses one of the subbands in the spectrum, we find that a classical plasmon with a dispersion is present. However, in a GAL the dispersion is much weaker than for a SLG (in agreement with Ref. Schultz et al., 2011).
Finally, we studied the static screening in a GAL, by calculating the limit of the polarization and dielectric function. Undoped GAL shows a mostly semiconductor-like screening, but with a much rich structure as an undoped SLG. In the case of doped GAL, we find only up to a characteristic wave-vector, for which the dielectric function has a maximum after which it decays, showing a bad metal behavior. The qualitative behavior found here for doped and clean GAL is similar to that for an undoped disordered SLG in the presence of resonant impurities.Yuan et al. (2012) In both cases, there is a characteristic length scale which separates two different regimes in terms of screening. However, whereas in the SLG systems studied in Ref. Yuan et al., 2012 the localized states are due to the presence of resonant scatterers, in the present case are rather associated to localization at the edges of the antidots.
VI Acknowledgments
The authors thank Jesper G. Pedersen for providing the band structure of GALs and Kristian S. Thygesen for useful remarks on the manuscript. The support by the Netherlands National Computing Facilities foundation (NCF) and by the EC under the Graphene Flagship (Contract No. CNECT-ICT-604391) is acknowledged. RR acknowledges financial support from the Juan de la Cierva Program and from grant FIS2011- 23713 (MINECO, Spain). The Center for Nanostructured Graphene (CNG) is sponsored by the Danish National Research Foundation, Project DNRF58.
References
- Shima and Aoki (1993) N. Shima and H. Aoki, Phys. Rev. Lett. 71, 4389 (1993).
- Novoselov et al. (2004) K. S. Novoselov, A. K. Geim, S. V. Morozov, D. Jiang, Y. Zhang, S. V. Dubonos, I. V. Grigorieva, and A. A. Firsov, Science 306, 666 (2004).
- Pedersen et al. (2008) T. G. Pedersen, C. Flindt, J. Pedersen, N. A. Mortensen, A.-P. Jauho, and K. Pedersen, Phys. Rev. Lett. 100, 136804 (2008).
- Furst et al. (2009) J. A. Furst, J. G. Pedersen, C. Flindt, N. A. Mortensen, M. Brandbyge, T. G. Pedersen, and A. P. Jauho, New Journal of Physics 11, 095025 (2009).
- Yuan et al. (2013) S. Yuan, R. Roldán, A.-P. Jauho, and M. Katsnelson, Phys. Rev. B 87, 085430 (2013).
- Petersen et al. (2011) R. Petersen, T. G. Pedersen, and A.-P. Jauho, Acs Nano 5, 523 (2011).
- Liu et al. (2013) X. Liu, Z. Zhang, and W. Guo, Small (2013).
- Kim et al. (2010) M. Kim, N. S. Safron, E. Han, M. S. Arnold, and P. Gopalan, Nano Letters 10, 1125 (2010).
- Bai et al. (2010) J. W. Bai, X. Zhong, S. Jiang, Y. Huang, and X. F. Duan, Nature Nanotechnology 5, 190 (2010).
- Kim et al. (2012) M. Kim, N. S. Safron, E. Han, M. S. Arnold, and P. Gopalan, Acs Nano 6, 9846 (2012).
- Liang et al. (2010) X. G. Liang, Y. S. Jung, S. W. Wu, A. Ismach, D. L. Olynick, S. Cabrini, and J. Bokor, Nano Letters 10, 2454 (2010).
- Shen et al. (2008) T. Shen, Y. Q. Wu, M. A. Capano, L. P. Rokhinson, L. W. Engel, and P. D. Ye, Appl. Phys. Lett. 93, 122102 (2008).
- Begliarbekov et al. (2011) M. Begliarbekov, O. Sul, J. Santanello, N. Ai, X. Zhang, E. H. Yang, and S. Strauf, Nano Letters 11, 1254 (2011).
- Giesbers et al. (2012) A. J. M. Giesbers, A. E. Peters, M. Burghard, and K. Kern, Phys. Rev. B 86, 045445 (2012).
- Zhang et al. (2013) H. Zhang, J. Lu, W. Shi, Z. Wang, T. Zhang, M. Sun, Y. Zheng, Q. Chen, N. Wang, J.-J. Lin, et al., Phys. Rev. Lett. 110, 066805 (2013).
- Rodriguez-Manzo and Banhart (2009) J. A. Rodriguez-Manzo and F. Banhart, Nano Letters 9, 2285 (2009).
- Eroms and Weiss (2009) J. Eroms and D. Weiss, New Journal of Physics 11, 095021 (2009).
- Sinitskii and Tour (2010) A. Sinitskii and J. M. Tour, J. Am. Chem. Soc. 132, 14730 (2010).
- Wang et al. (2013) M. Wang, L. Fu, L. Gan, C. Zhang, M. Ruemmeli, A. Bachmatiuk, K. Huang, Y. Fang, and Z. Liu, Scientific Reports 3, 1238 (2013).
- Tada et al. (2011) K. Tada, J. Haruyama, H. X. Yang, M. Chshiev, T. Matsui, and H. Fukuyama, Phys. Rev. Lett. 107, 217203 (2011).
- Shimizu et al. (2012) T. Shimizu, J. Nakamura, K. Tada, Y. Yagi, and J. Haruyama, Appl. Phys. Lett. 100, 023104 (2012).
- Zeng et al. (2012) Z. Zeng, X. Huang, Z. Yin, H. Li, Y. Chen, H. Li, Q. Zhang, J. Ma, F. Boey, and H. Zhang, Advanced Materials 24, 4138 (2012).
- Grigorenko et al. (2012) A. N. Grigorenko, M. Polini, and K. S. Novoselov, Nature Photonics 6, 749 (2012).
- Ando et al. (1982) T. Ando, A. B. Fowler, and F. Stern, Rev. Mod. Phys. 54, 437 (1982).
- Giuliani and Vignale (2005) G. F. Giuliani and G. Vignale, Quatum Theory of the Electron Liquid (CUP, Cambridge, 2005).
- Shung (1986) K. W. K. Shung, Phys. Rev. B 34, 979 (1986).
- Wunsch et al. (2006) B. Wunsch, T. Stauber, F. Sols, and F. Guinea, New Journal of Physics 8, 318 (2006).
- Hwang and Sarma (2007) E. H. Hwang and S. D. Sarma, Phys. Rev. B 75, 205418 (2007).
- Roldán et al. (2010) R. Roldán, M. O. Goerbig, and J.-N. Fuchs, Semicond. Sci. Technol. 25, 034005 (2010).
- Schultz et al. (2011) M. H. Schultz, A. P. Jauho, and T. G. Pedersen, Phys. Rev. B 84, 045428 (2011).
- Yuan et al. (2010) S. Yuan, H. De Raedt, and M. I. Katsnelson, Phys. Rev. B 82, 115448 (2010).
- Yuan et al. (2011a) S. Yuan, R. Roldán, H. De Raedt, and M. I. Katsnelson, Phys. Rev. B 84, 195418 (2011a).
- Robinson et al. (2008) J. P. Robinson, H. Schomerus, L. Oroszlány, and V. I. Fal’ko, Phys. Rev. Lett. 101, 196803 (2008).
- Wehling et al. (2010) T. O. Wehling, S. Yuan, A. I. Lichtenstein, A. K. Geim, and M. I. Katsnelson, Phys. Rev. Lett. 105, 056802 (2010).
- Foo (a) In principle, one should consider geometrical relaxation of the antidots, which may be significant for small structures with free dangling bonds (See, e.g. Ref. Şahin and Ciraci, 2011). The present model approximates a hydrogen-passivated antidot relaxed within DFT, see Fig. 1 in Ref. Furst et al., 2009.
- Roche and Mayou (1997) S. Roche and D. Mayou, Phys. Rev. Lett. 79, 2518 (1997).
- Hams and De Raedt (2000) A. Hams and H. De Raedt, Phys. Rev. E 62, 4365 (2000).
- Kubo (1957) R. Kubo, J. Phys. Soc. Jpn. 12, 570 (1957).
- Yuan et al. (2011b) S. Yuan, R. Roldán, and M. I. Katsnelson, Phys. Rev. B 84, 035439 (2011b).
- Eberlein et al. (2008) T. Eberlein, U. Bangert, R. R. Nair, R. Jones, M. Gass, A. L. Bleloch, K. S. Novoselov, A. Geim, and P. R. Briddon, Phys. Rev. B 77, 233406 (2008).
- Foo (b) Notice that all our plots start at a finite wave-vector . This is due to the fact that we perform a tight-binding calculation in real space. As a consequence, the long wavelength limit can be reached only for an infinite lattice.
- Stern (1967) F. Stern, Phys. Rev. Lett. 18, 546 (1967).
- González et al. (1994) J. González, F. Guinea, and M. A. H. Vozmediano, Nucl. Phys. B 424, 595 (1994).
- Roldán and Brey (2013) R. Roldán and L. Brey, Phys. Rev. B 88, 115420 (2013).
- Yuan et al. (2012) S. Yuan, T. O. Wehling, A. I. Lichtenstein, and M. I. Katsnelson, Phys. Rev. Lett. 109, 156601 (2012).
- Gunst et al. (2011) T. Gunst, T. Markussen, M. Brandbyge, and A. P. Jauho, Phys. Rev. B 84, 155449 (2011).
- Şahin and Ciraci (2011) H. Şahin and S. Ciraci, Phys. Rev. B 84, 035452 (2011).