The Mid-Infrared Light Curve of Nearby Core-Collapse Supernova SN 2011dh (PTF 11eon)
Abstract
We present Spitzer observations at 3.6 and 4.5m of the supernova SN 2011dh (PTF 11eon) in M51 from 18 days to 625 days after explosion. The mid-infrared emission peaks at 24 days after explosion at a few 107 L⊙, and decays more slowly than the visible-light bolometric luminosity. The infrared color temperature cools for the first 90 days and then is constant. Simple numerical models of a thermal echo can qualitatively reproduce the early behavior. At late times, the mid-IR light curve cannot be explained by a simple thermal echo model, suggesting additional dust heating or line emission mechanisms. We also propose that thermal echoes can serve as effective probes to uncover supernovae in heavily obscured environments, and speculate that under the right conditions, integrating the early epoch of the mid-infrared light curve may constrain the total energy in the shock breakout flash.
1 Introduction
Thermal echoes from supernovae (SN), emanating from preexisting dust responding to heating by the shock breakout flash (SBF) of the SN and later by the fireball, are powerful tools to study the dust distribution around the SN, and sometimes the heating sources themselves (Wright, 1980; Dwek et al., 2010). Light echoes at 100 days would illuminate material from stellar outflows thus constraining progenitor properties. This is particularly valuable for SN types such as IIb whose origins are still under debate. Few cases of mid-infrared (mid-IR) emission from core-collapse SNe have been studied with well-sampled light-curves and IR spectra, and interpretation has not been straightforward.
Gall et al. (2011) discuss implications of IR echoes for dust production in SNe. Krause et al. (2005) study a spatially resolved IR echo associated with late flares in the central object of the SN IIb remnant Cas A. SN1993J (IIb) showed an increasing mid-IR excess beyond 100 days after explosion (Matthews et al., 2002), whereas SN1987A (II-pec) took a longer time to develop that excess (Meikle et al., 1989, 1993). Both SNe exhibited increasing dust luminosity with time, an indication of the heating reaching more dust mass at later times. In the case of SN1987A, the visible light echo supports this interpretation (Dwek et al., 2010). Most recently, Fox et al. (2013) presented mid-IR observations of a sample of SN IIn with nearly constant IR excess up to several years post-explosion.
SN 2011dh, a Type IIb SN in M51, offered a unique opportunity to study its IR properties given the relative proximity of M51 at 8 Mpc, and the location of the SN in the less crowded part of the disk about 6 kpc from the nucleus (§2). We started monitoring SN 2011dh with Spitzer shortly after explosion, and we report here on data from almost two years post explosion (§3). We describe the spectral energy distribution (§4), discuss a physical scenario for the emission (§5), analyze the data in the framework of that scenario and present a simple illustrative model (§6). Finally, we discuss the implications for the SBF and the utility as a probe to discover SNe (§7).
2 Discovery and Progenitor constraints
On May 31.9 2011 UT, the supernova SN 2011dh (PTF 11eon) in M51 was discovered (A. Riou) and spectroscopically classified as a Type IIb (Arcavi et al., 2011). Identification of a progenitor star in pre-explosion imaging by the Hubble Space Telescope suggested a yellow supergiant (YSG) progenitor (Maund et al., 2011), although a binary system including a Wolf-Rayet star could not be ruled out (Van Dyk et al., 2011). Relatively low temperatures in the earliest spectra, suggestive of rapid shock breakout cooling, pointed to a progenitor radius more compact than a supergiant (Arcavi et al. 2011 but see Bersten et al. 2012). Radio and X-ray observations also suggested a compact progenitor (Soderberg et al., 2012). Later work, taking into account the assumptions in microphysics, demonstrated that the progenitor radius is not well constrained and might be in between the canonical compact and extended classes (Horesh et al., 2012). Most recently, Van Dyk et al. (2013) reported the YSG to be missing in deep HST images at 600 days, strongly supporting its identification as the progenitor, which we adopt in this paper. Sahu et al. (2013) argue this is consistent with a binary model.
3 Spitzer Observations
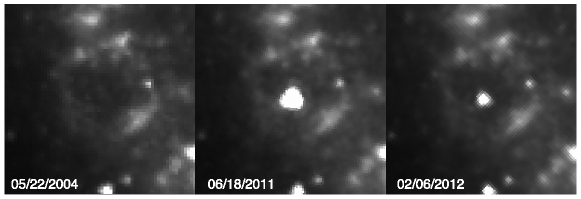
We observed SN 2011dh 17 times111not counting one observation which was ruined by radiation hits with Spitzer/IRAC (Fazio et al., 2004), starting 18 days after explosion and extending to 625 days after explosion. Figure 1 shows three Spitzer images of the supernova: pre-explosion, early epoch and late epoch post-explosion.
Data were processed using the standard IRAC pipeline222IRAC Instrument and Instrument Support Teams, IRAC Instrument Handbook version 2.0.3 February 2013. Calibration and aperture corrections were as per the zero points listed in the Spitzer/IRAC handbook. To remove underlying host galaxy light, image subtraction was performed using HOTPANTS333http://www.astro.washington.edu/users/becker/hotpants.html (A. Becker). Aperture photometry was then performed using a radius of 4 pixels for the supernova and an annulus of 8 to 16 pixel radii for the background.
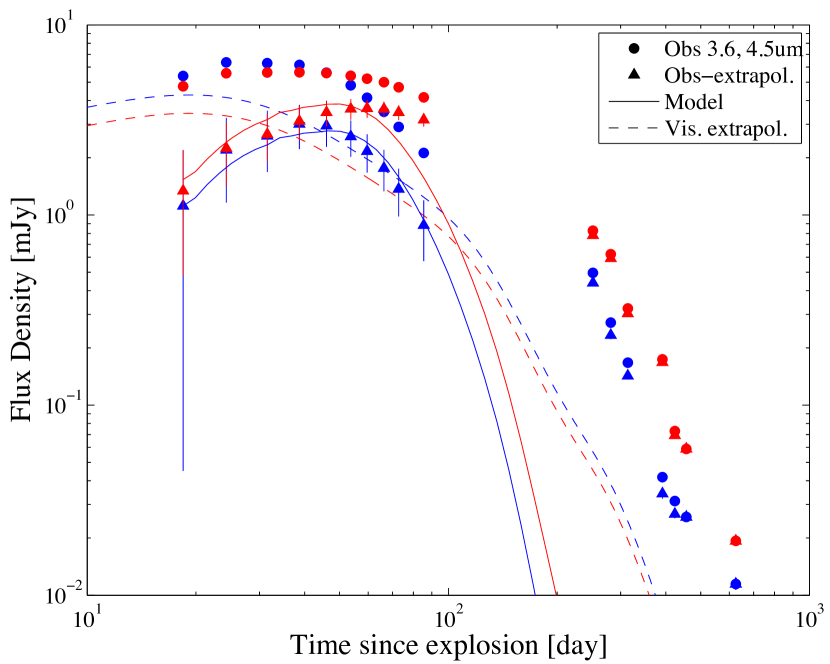
The Spitzer photometry is presented in Figure 2 and compared to the -band light curve from the Palomar Transient Factory (Arcavi et al. in prep). The light curve peaked 24 to 30 days after explosion at 3.6m, and at 38 days at 4.5m, and declined faster at 3.6m than at 4.5m. The data gap between 90 and 250 days is due to visibility gaps. The light curve drops much faster after the gap at all wavelengths, with a possible slow-down beyond 400 days. Data interpolation into the gap for 4.5m points to transition from plateau to decay at days.
4 Spectral Energy Distribution
In Figure 3, we show the spectral energy distribution (SED) of SN 2011dh ranging from the UV using Swift satellite data to the IR using Spitzer data. The SED is shown at six epochs between 18 days and 391 days after explosion.
SN 2011dh exhibits substantial IR emission whose importance increases with time. The [R-4.5m] color grows from mag to mag between 18 and 391 days. Visible and UV luminosities, and thus bolometric luminosity, decay with a 15-day half-life (Arcavi et al., 2011), whereas the infrared decays more slowly up to 50 days after explosion. The NIR data (Ergon et al., 2013) prove critical to deciphering the SED. They show a hot component peaking around m, with the 4.5m emission emerging as a separate component after two months. At 66 days, a simple extrapolation of H and K data on Figure 3 accounts for most of the 3.6m flux, but for only half of the 4.5m flux. This is consistent with Ergon et al. (2013) accounting for the NIR as part of a fit to visible data at 5000-7000 K, and associating the 4.5m with an additional 400 K component. The lack of NIR data complicates the decomposition after 100 days, but it remains safe to treat at least 4.5m as a separate component associated with the IR echo.
Between 50 and 100 days, the mid-IR flux densities decay with a power-law dependence on time with an index of for 4.5m and a faster for 3.6m, so that the mid-IR emission grows redder (Figure 2). Beyond 250 days, the light curves decay essentially in parallel with a steeper index of . Nowhere does the -band decay slope agree exactly with the mid-IR slopes, though all curves transition from slow to fast decay. The mid-IR color temperature, estimated form a blackbody curve that reproduces the ratio, starts out above 1600 K then cools slowly, reaching 600 K about 85 days after explosion. Beyond 200 days, it ranges between 500 and 700 K, but it is unclear how much the hot component still contributes at 3.6m, leaving room for a cooler IR echo. We adopt conservatively 500 K as the dust temperature at times days.
5 Analysis
We adopt the physical picture (Wright, 1980; Dwek, 1983; Graham & Meikle, 1986; Fox et al., 2010) where the IR emission is due to dust heated first by the SN SBF (a brief, high intensity UV flash) and subsequently by the fireball. We assume the dust is spherically symmetric about the SN. The dust contributing to the instantaneous IR light observed at Earth is distributed along the surface of equal time of light travel from SN to dust to observer, outside a dust sublimation radius . The longer-duration fireball of shocked gas will heat the dust left or reformed behind the SBF, as well as new dust formed in the ejecta. A blackbody approximation is quite unlikely to be appropriate for the observed emission, as the equal light travel time surface spans a range of distances from the SN. For example, (Fox et al., 2010) discuss at least two components in SN2005ip, at about 470 and 900K. While the cooler component is consistent with 4.5m data in SN2011dh, our NIR component is at T2000 K range, unlikely to be due to dust emission.
The MIR transition to late epochs seems complicated. At 4.5m extrapolating early and late photometry into the data gap suggests a light curve turning over about 150 days after explosion. At 3.6m extrapolations into the data gap from early and late data do not intersect, implying that the decay must have slowed down for some time before the steeper decline. This may be due to the hot NIR component.
Dwek (1983) associates the IR echo plateau duration with the inner radius of the dust cloud at , suggesting a value of 150 days or 0.1 pc for SN 2011dh. While the association is not a precise relation in more realistic models, it remains a valid indicative relation. Reading off Figure 8 of Fox et al. (2010), 0.1 pc requires an uncomfortably high peak luminosity of . Alternatively, the inner radius may be set by a sharp decline of mass outflow about 150 days before explosion. Similarly, the Dwek (1983) model requires a very extended dust envelope to generate the late epoch emission. The latest detections in our data at days probe dust at distances up to 0.26 pc behind the SN, and twice as far in the lateral directions. Dust condensing in a mass outflow from a YSG would be the first to echo the SBF in IR. For outflow velocities of 100 , the stellar material would have required years to reach 0.26 pc, consistent with typical estimates of outflow durations.
5.1 Energy and Mass Estimates
Assuming dust in thermal equilibrium and ignoring the temperature spread, the ratio yields a temperature. Combined with the observed luminosity at 4.5m, the latter leads to a total luminosity , essentially an extrapolation of the two mid-IR bands to the full blackbody curve (Figure 4). Because 3.6m carries additional contributions, underestimates the luminosity of a blackbody dominating at 4.5m.
In the case of stochastic heating, very small grains absorb single photons, radiate briefly at very high apparent temperatures and cool off rapidly (Draine & Li, 2001). Since the IR color cannot be associated with a temperature, and the spectrum is insufficiently constrained, we use as a lower limit to , even though 3.6m is contaminated by the hot component at early times.
Both and are within a factor of 2 of being constant for the first 100 days, and differ by a factor ranging from 2 to 4 (Figure 4). They set a plausible range for the true . In the first 60 days, is a third of which sums over the UV-to-Vis part of the spectrum. increases substantially with time, so that even approaches unity after 250 days. is in the range of a few in the first month, and remains above for 100 days. At peak, IR emission associated with the SN accounts for 2% and 3% of the M51 luminosity at 3.6 and 4.5m respectively (Dale et al., 2005).
The IR emission integrated up to 90 days comes to ergs for and to ergs for . The ratio of to summed over all epochs is , which translates to a total optical depth in the dust shell, . For this value of and the sizes derived above for inner and outer radii, total mass estimates for the shell, using either Fox et al. (2010) or Dwek (1983), would run well over 100 M⊙, unrealistic for a circumstellar shell. For the same , cloud size would have to be an order of magnitude smaller to make the mass estimates consistent with stellar outflows, but the size would then clash with the timing arguments above. This points strongly to an interstellar cloud adding to the IR echo.
Under certain conditions, it may be possible for heating by the SBF to dominate the early IR echo, namely until its IR emission surface has cleared and the main light curve has risen significantly, a total of . If such conditions were to obtain, summing over the early IR echo would yield an approximate lower limit to SBF UV-Vis energy, with the amount of underestimation depending on the SBF spectrum, and associated losses to dust destruction, gas ionization, escape or other loss mechanisms. The examination of this possibility is deferred to a later paper, as it requires detailed modeling and analysis.
5.2 Thermal Echo Modeling
The simple scaling arguments advanced above for IR echoes cannot account for all observables simultaneously. We therefore attempted to reproduce the Spitzer observations using simple IR echo models, with the following assumptions: the heating is done by a SBF followed by the observed UV-Vis light curve; dust sublimates at 2000 K; the relative dust emissivity is ; L(peak) = erg/s, comparable to the expected values in a Red Super Giant explosion (Nakar & Sari 2010). We extrapolated the visible spectrum to the IR assuming a Rayleigh-Jeans tail, and subtracted the extrapolation from the IR data (Figure 5). This highly uncertain extrapolation and the lack of coverage at m affect all analysis of the data, including this modeling approach. Figure 5 shows the output of one model variant as an illustration rather than a preferred fit to the data. In this variant, the dust has a flat radial profile around the SN, though the choice of radial gradient does not affect critically the predicted IR output. The echo time dependence is most sensitive to , which in turn depends on L(peak).
Such simple models are able to reproduce qualitatively the shape of the IR light curves in the first 100 days, though not the IR color evolution. The models turn over however before the observed plateau duration, and fall short of reproducing the late epoch data by more than an order of magnitude. This difficulty suggests additional emission components at later epochs besides the thermal echo. One possibility for an added component is emission from dust heated by direct contact with the shock wave which would still be propagating through the circumstellar envelope. The well-studied case of this phenomenon in SN 1987A (Dwek et al., 2010) however shows increasing intensity between 6000 and 8000 days after explosion as opposed to the steep decline we observe here, possibly because of a different dust distribution. Another possibility is CO fundamental band emission, invoked by Ergon et al. (2013) as the explanation for 4.5m excess even in the first 100 days.
Could this additional component simply arise in the pre-existing circumstellar dust heated by the shocked gas fireball? The observed ratio of at late epochs would require an optical depth , and more importantly the observed T500 K and would require the dust to be no further than 0.03 pc from the heating source, smaller than pc. This possibility is viable only in case of dust reforming after sublimation by SBF in the circumstellar material, which may take place on the time scale of hundreds of days (Gall et al., 2011), and would explain the increased optical depth after 200 days.
Newly formed dust in the ejecta is another possibility that is widely discussed in the literature. In a scenario such as depicted in Figure 9 of Fox et al. (2010), new dust forming in the inner ejecta would be warmed by the shocked gas and obscure the rear half of that gas. For SN2011dh, the shock speed of km s-1 entails a shocked gas radius of 0.02 pc, implying higher temperatures of interior dust than allowed by observations. For SN II, the review by Kosaza et al (2009) models dust formation and IR emission increase over hundreds of years in core collapse SNe. Best known cases of ejecta-derived dust seem to occur in type IIn SN, and the dust temperatures run substantially higher there than in SN2011dh. Mauerhan & Smith (2012) report on dust forming over a decade in SN 1998S (IIn) whereas Smith et al. (2012) present evidence for dust forming over a three-month period in SN 2010jl (IIn). For illustration, the red continuum attributed to newly formed hot dust in SN 2006jc (Ibn) reaches well below 1m within tens of days, and is accompanied with differential extinction of He II lines (Smith et al., 2008). The recent work by Fox et al. (2013) presents remarkable results for a sample of IIn SNe, but their much higher and nearly constant luminosities over several years make them unlikely analogs for SN2011dh. Ejecta-derived dust thus seems an unlikely candidate for late excess emission in SN2011dh. We plan to undertake detailed modeling in a later paper.
6 Summary and Discussion
The IR emission from SN 2011dh evolves to lower color temperatures over the first three months after explosion, but also increases in importance compared to the visible light luminosity. It remains well above during that period, and sums up to , possibly an indication of the order of magnitude for the total UV–Vis energy in the shock breakout flash. Higher cadence surveys should be sensitive to this bright flash (e.g. Zwicky Transient Facility, Kulkarni 2012).
Simple numerical models for the IR echo can reproduce qualitatively early mid-IR behavior, but then miss the 250–600 day behavior, suggesting dust formation, additional dust heating mechanisms, a nearby dense interstellar cloud, or significant line or band emission.
Thermal echoes could be effective at revealing SNe in highly obscured starbursts, where the reported rate of detection in the IR has been surprisingly low (Cresci et al., 2007). Rather than search for the fast rise of extincted emission from young SNe, one should look for thermal echoes which will be less extincted because of their spatial extent, and because part of the emitting surface will approach the outer envelope of the starburst. Scaling from SN 2011dh at 8 Mpc, which remained brighter than 2 mJy at 3.6 and 4.5m for 100 days, all SNe out to 20 Mpc will have thermal echoes easily detectable with Spitzer even if they are 15 times less luminous. Most SN searches in starbursts were not looking for such slow profiles, and might have dismissed these light curves as dusty variable stars. Measuring SN light echoes would constrain dust distribution models inside starbursts, and complement the picture we get from other tracers such as detailed infrared spectroscopy or radio molecular lines (Brandl et al., 2006; Roussel et al., 2007; Wilson et al., 2008).
Acknowledgments: We acknowledge the anonymous referee for helpful comments. This work was supported and based in part on observations made with the Spitzer Space Telescope, which is operated by the Jet Propulsion Laboratory, California Institute of Technology under a contract with NASA. M.M.K. acknowledges generous support from the Hubble Fellowship and Carnegie-Princeton Fellowship. E.O.O. is incumbent of the Arye Dissentshik career development chair and is grateful to support by a grants from the Israeli Ministry of Science and the I-CORE Program. Work by A.G.-Y. and his group is supported by grants from the BSF, ISF, GIF and Minerva, the EU/FP7 via an ERC grant, and the Kimmel award for innovative investigation.
References
- Arcavi et al. (2011) Arcavi, I., et al. 2011, ApJ, 742, L18
- Bersten et al. (2012) Bersten, M. C., et al. 2012, ApJ, 757, 31
- Brandl et al. (2006) Brandl, B. R., et al. 2006, ApJ, 653, 1129
- Cresci et al. (2007) Cresci, G., Mannucci, F., Della Valle, M., & Maiolino, R. 2007, A&A, 462, 927
- Dale et al. (2005) Dale, D. A., et al. 2005, ApJ, 633, 857
- Draine & Li (2001) Draine, B. T., & Li, A. 2001, ApJ, 551, 807
- Dwek (1983) Dwek, E. 1983, ApJ, 274, 175
- Dwek et al. (2010) Dwek, E., et al. 2010, ApJ, 722, 425
- Ergon et al. (2013) Ergon, M., Sollerman, J., Fraser, M., et al. 2013, arXiv:1305.1851v1
- Fazio et al. (2004) Fazio, G. G., Hora, J. L., Allen, L. E., et al. 2004, ApJS, 154, 10
- Fox et al. (2010) Fox, O. D., Chevalier, R. A., Dwek, E., Skrutskie, M. F., et al. 2010, ApJ, 725, 1768
- Fox et al. (2013) Fox, O. D., Filippenko, A. V., Skrutskie, M. F., et al. 2013, arXiv:1304.0248
- Gall et al. (2011) Gall, C., Hjorth, J., & Andersen, A. C. 2011, A&ARv, 19, 43
- Graham & Meikle (1986) Graham, J. R., & Meikle, W. P. S. 1986, MNRAS
- Horesh et al. (2012) Horesh, A., et al. 2012, ArXiv e-prints
- Kozasa et al. (2009) Kozasa, T., Nozawa, T., Tominaga, N., et al. 2009, Cosmic Dust - Near and Far, 414, 43
- Krause et al. (2005) Krause, O., et al. 2005, Science, 308, 1604
- Kulkarni (2012) Kulkarni, S. R. 2012, arXiv:1202.2381
- Matthews et al. (2002) Matthews, K., Neugebauer, G., Armus, L., & Soifer, B. T. 2002, AJ, 123, 753
- Mauerhan & Smith (2012) Mauerhan, J., & Smith, N. 2012, MNRAS, 424, 2659
- Maund et al. (2011) Maund, J. R., et al. 2011, ApJ, 739, L37
- Meikle et al. (1993) Meikle, W. P. S., Spyromilio, J., Allen, D. A., Varani, G.-F., & Cumming, R. J. 1993, MNRAS, 261, 535
- Meikle et al. (1989) Meikle, W. P. S., Spyromilio, J., Varani, G.-F., & Allen, D. A. 1989, MNRAS, 238, 193
- Roussel et al. (2007) Roussel, H., et al. 2007, ApJ, 669, 959
- Sahu et al. (2013) Sahu, D. K., Anapuma, G. C., Chakradhari, N. K. 2012, MNRAS, 433, 2
- Smith et al. (2013) Smith, N., Mauerhan, J. C., Kasliwal, M. M., & Burgasser, A. J. 2013, arXiv:1303.0304
- Smith et al. (2012) Smith, N., Silverman, J. M., Filippenko, A. V., et al. 2012, AJ, 143, 17
- Smith et al. (2008) Smith, N., Foley, R. J., & Filippenko, A. V. 2008, ApJ, 680, 568
- Soderberg et al. (2012) Soderberg, A. M., et al. 2012, ApJ, 752, 78
- Van Dyk et al. (2013) Van Dyk, S. D., Zheng, W., Clubb, K. I., Filippenko, A. V., Cenko, S. B., Smith, N., Fox, O., Kelly, P., Shivvers, I. & Ganeshalingam, M. 2013, arXiv:1305.3436v1
- Van Dyk et al. (2011) Van Dyk, S. D., et al. 2011, ApJ, 741, L28
- Wilson et al. (2008) Wilson, C. D., et al. 2008, ApJS, 178, 189
- Wright (1980) Wright, E. L. 1980, ApJ, 242, L23