Accuracy of generalized gradient approximation functionals for density functional perturbation theory calculations
Abstract
We assess the validity of various exchange-correlation functionals for computing the structural, vibrational, dielectric, and thermodynamical properties of materials in the framework of density-functional perturbation theory (DFPT). We consider five generalized-gradient approximation (GGA) functionals (PBE, PBEsol, WC, AM05, and HTBS) as well as the local density approximation (LDA) functional. We investigate a wide variety of materials including a semiconductor (silicon), a metal (copper), and various insulators (SiO2 -quartz and stishovite, ZrSiO4 zircon, and MgO periclase). For the structural properties, we find that PBEsol and WC are the closest to the experiments and AM05 performs only slightly worse. All three functionals actually improve over LDA and PBE in contrast with HTBS, which is shown to fail dramatically for -quartz. For the vibrational and thermodynamical properties, LDA performs surprisingly very good. In the majority of the test cases, it outperforms PBE significantly and also the WC, PBEsol and AM05 functionals though by a smaller margin (and to the detriment of structural parameters). On the other hand, HTBS performs also poorly for vibrational quantities. For the dielectric properties, none of the functionals can be put forward. They all (i) fail to reproduce the electronic dielectric constant due to the well-known band gap problem and (ii) tend to overestimate the oscillator strengths (and hence the static dielectric constant).
Introduction
The lattice-dynamical behavior (“the jiggling and wiggling of atoms”, as Feynman poetically said Feynman1991 ) determines many of the physical properties of solids: infrared, Raman, and neutron-diffraction spectra; specific heats, thermal expansion, and heat conduction; phenomena related to the electron-phonon interaction such as the resistivity of metals, superconductivity, and the temperature dependence of optical spectra… It is thus essential to be able to model accurately the lattice dynamics of materials to understand and predict many of their properties.
In the last three decades, theoretical condensed-matter physics and computational materials science have made considerable progress. Nowadays, many materials properties can be computed using ab initio quantum-mechanical techniques. Their only input information is the chemical composition and crystal structure of the material. The predictive power of ab initio computations has even started to be used to make materials design and predictions. Hautier2012 In the specific case of lattice-dynamical properties, a large number of ab initio calculations based on the linear-response theory of lattice vibrations have been made possible over the past twenty years by the achievements of density-functional theory Kohn1965 (DFT) and by the development of density-functional perturbation theory Baroni2001 (DFPT). Thanks to these theoretical and algorithmic advances, it is nowadays possible to obtain phonon dispersions on a fine grid of wave vectors covering the entire Brillouin zone, which can directly be compared with neutron-diffraction data. From the phonon frequencies, many of the above physical properties can be computed.
Within the framework of DFT, the many-body problem of interacting electrons in a static external potential is cast into a tractable problem of non-interacting electrons moving in an effective potential. The latter includes the external potential and the effects of the Coulomb interactions between the electrons, i.e. the so-called Hartree term, describing the electron-electron repulsion, and the exchange and correlation (XC) interactions, which includes all the many-body interactions. Modeling the XC interactions is the main difficulty of DFT. The simplest approximation is the local-density approximation Kohn1965 ; LDA (LDA), which is based upon exact exchange energy for a uniform electron gas and only requires the density at each point in space. A slightly more elaborate approach consists in using both the density and its gradient at each point in space in the so-called generalized gradient approximation (GGA).
The most commonly used GGA functional is the one proposed by Perdew, Burke, and Ernzherhof (PBE). PBE It almost always overestimates the lattice constants of solids, while LDA consistently underestimates the volume. In both cases, the typical errors amount to 1-2% of the lattice parameters. A series of alternative GGA functionals have recently been proposed to overcome this problem, as well as to obtain accurate surface energies for solids. One such functional is the AM05 functional, AM05 which combines the LDA functional for bulk-like regions with a local Airy approximation Kohn1998 for surface-like regions. In contrast, the PBEsol PBEsol and Wu and Cohen (WC) WC functionals can be seen as revised versions of PBE specifically adapted for solids. These three functional (AM05, PBEsol, and WC) yield indeed lattice constants that are in excellent agreement with experiments. Haas2009 More recently, the HTBS functional HTBS has been proposed as an efficient compromise leading to good results on challenging problems requiring accuracy for both solids and molecules (e.g., the CO adsorption on noble metals surfaces). It is obtained by mixing two functionals: one performing well for atomization energies of molecules (the RPBE Hammer1999 functional) and one achieving very good accuracy for lattice constants in solids (WC).
These alternative functionals, which mainly focus on improving the modeling of the lattice constants, bond lengths and surface energies of solids, often compromise the accuracy for bulk total energies. It is therefore of interest to study how they perform when it comes to predicting properties governed by lattice dynamics (such as phonon frequencies, dielectric constants, and thermal properties) and that should be affected by both the accuracy in structural parameters and energy. It should be mentioned that the performance of PBE has already been tested for the phonon frequencies of a few selected solids. Favot1999 ; DalCorso2000 A comparison of LDA, PBE, and an ad-hoc functional (mixing 50% of the previous ones) has been proposed for copper focusing on the theoretical Debye-Waller factors. Vila2007 More recently, the phonon dispersions of face-centered cubic metals (Cu, Ag, Au, Ni, Pd, Pt, Rh, and Ir) have also been investigated using the WC and PBEsol functionals. DalCorso2013
In this paper, we consider five GGA functionals (PBE, PBEsol, WC, AM05, and HTBS) as well as the LDA to compute such properties using DFPT. We investigate a wide variety of materials including a semiconductor (silicon), a metal (copper), and various insulators (SiO2 -quartz and stishovite, ZrSiO4 zircon, and MgO periclase). This allows us to assess the validity of the different XC functionals not only for structural properties (as commonly reported in the literature) but also for vibrational, thermodynamical, and dielectric properties.
This paper is organized as follows. Section I is devoted to the technical details of our calculations. Our main results are then presented in Sec. II: we present successively (II.1) the structural properties, (II.2) the phonon frequencies at , (II.3) the phonon dispersion curves, (II.4) the volume dependence of the phonon frequencies, (II.5) the thermodynamical properties, and (II.6) the dielectric properties. Based on these results, a few general statements and considerations are given in Sec. III. Finally, our most important findings are summarized in Sec. IV.
I Technical details
The ab initio calculations were performed using the abinit package abinit combined with the libxc library. libxc Total energies were computed using DFT, and phonon frequencies using DFPT. The interaction between the ions and valence electrons was described using the Troullier-Martins norm-conserving pseudopotentials generated by the Atomic Pseudopotentials Engine. ape The reference configurations and core radii of our pseudopotentials are reported in Table 1. The exchange-correlation energy is evaluated within LDA using Perdew-Wang’s parametrization LDA and GGA using the parameterization of PBE, PBE PBEsol, PBEsol AM05, AM05 WC, WC and HTBS. HTBS The planewave kinetic energy cutoff was set to 10 Ha for silicon, 30 Ha for zircon, -quartz, and stishovite, 40 Ha for copper, 33 Ha for periclase. The Brillouin Zone (BZ) integrations were performed within Monkhorst-Pack (MP) scheme using grids for silicon, zircon, -quartz, stishovite, periclase and using grids for copper. In order to deal with the possible convergence problems for copper, Gaussian smearing technique was employed with the smearing parameter set equal to 0.01 Hartree.
| Atom | configuration | local | |||
|---|---|---|---|---|---|
| O | 1.50 | 1.50 | — | ||
| Mg | 2.10 | 2.50 | 2.50 | ||
| Si | 1.73 | 1.90 | 2.03 | ||
| Zr | 1.95 | 1.75 | 1.90 | ||
| Cu | 2.08 | 2.08 | 2.08 |
For a statistical analysis of the results obtained with the different XC functionals, we use the mean relative error (MRE, in %) and the mean absolute relative error (MARE, in %).
II Results and analysis
II.1 Structural properties
We have studied in Table 2 the structural parameters (lattice constants but also bond lengths and angles) for the different compounds and functionals.
| LDA | PBE | PBEsol | AM05 | WC | HTBS | Expt. | LDA | PBE | PBEsol | AM05 | WC | HTBS | Expt. | ||
| silicon | |||||||||||||||
| 5.382 | 5.467 | 5.422 | 5.431 | 5.420 | 5.446 | 5.431 | (Si-Si) | 2.331 | 2.367 | 2.348 | 2.352 | 2.347 | 2.358 | 2.352 | |
| -quartz | |||||||||||||||
| 4.866 | 5.039 | 4.959 | 5.029 | 4.975 | 5.108 | 4.916 | (Si-O) | 1.600 | 1.624 | 1.614 | 1.614 | 1.613 | 1.620 | 1.605 | |
| 5.361 | 5.524 | 5.443 | 5.510 | 5.458 | 5.579 | 5.406 | 1.605 | 1.627 | 1.618 | 1.617 | 1.616 | 1.620 | 1.614 | ||
| 0.4666 | 0.4790 | 0.4725 | 0.4818 | 0.4748 | 0.5000 | 0.4697 | (Si-O-Si) | 142.2 | 148.1 | 144.9 | 149.6 | 146.1 | 154.3 | 143.8 | |
| 0.4128 | 0.4155 | 0.4140 | 0.4166 | 0.4149 | 0.4186 | 0.4135 | (O-Si-O) | 108.5 | 109.4 | 109.0 | 109.5 | 109.1 | 110.0 | 108.8 | |
| 0.2726 | 0.2511 | 0.2628 | 0.2458 | 0.2587 | 0.2093 | 0.2669 | 109.3 | 108.2 | 108.6 | 108.3 | 108.6 | 108.2 | 109.0 | ||
| 0.1153 | 0.1320 | 0.1225 | 0.1366 | 0.1259 | 0.1667 | 0.1191 | 109.4 | 108.9 | 109.2 | 108.9 | 109.2 | 108.2 | 109.2 | ||
| 110.6 | 110.5 | 110.5 | 110.4 | 110.4 | 110.3 | 110.5 | |||||||||
| stishovite | |||||||||||||||
| 4.155 | 4.246 | 4.199 | 4.206 | 4.198 | 4.217 | 4.180 | (Si-O) | 1.753 | 1.777 | 1.765 | 1.765 | 1.765 | 1.771 | 1.758 | |
| 2.654 | 2.694 | 2.676 | 2.675 | 2.676 | 2.685 | 2.667 | 1.792 | 1.844 | 1.818 | 1.822 | 1.818 | 1.827 | 1.810 | ||
| 0.3057 | 0.3070 | 0.3062 | 0.3064 | 0.3062 | 0.3060 | 0.3062 | (Si-O-Si) | 98.4 | 98.6 | 98.6 | 98.5 | 98.6 | 98.6 | 98.7 | |
| 130.8 | 130.7 | 130.7 | 130.7 | 130.7 | 130.7 | 130.7 | |||||||||
| zircon | |||||||||||||||
| 6.575 | 6.697 | 6.631 | 6.642 | 6.629 | 6.661 | 6.610 | (Zr-O) | 2.120 | 2.162 | 2.138 | 2.143 | 2.138 | 2.148 | 2.124 | |
| 5.900 | 6.007 | 5.949 | 5.956 | 5.949 | 5.972 | 6.001 | 2.252 | 2.288 | 2.268 | 2.267 | 2.270 | 2.272 | 2.287 | ||
| 0.0661 | 0.0666 | 0.0662 | 0.0664 | 0.0662 | 0.0663 | 0.0646 | (Si-O) | 1.612 | 1.639 | 1.627 | 1.628 | 1.626 | 1.633 | 1.627 | |
| 0.1953 | 0.1951 | 0.1949 | 0.1947 | 0.1951 | 0.1945 | 0.1967 | (Zr-O-Si) | 98.9 | 99.0 | 99.0 | 98.9 | 99.0 | 98.9 | 98.7 | |
| 150.0 | 149.8 | 149.8 | 149.7 | 149.9 | 149.7 | 150.6 | |||||||||
| (Zr-O-Zr) | 111.1 | 111.2 | 111.2 | 111.3 | 111.2 | 111.4 | 110.7 | ||||||||
| (O-Si-O) | 97.2 | 97.1 | 97.1 | 97.0 | 97.1 | 97.0 | 97.8 | ||||||||
| 115.9 | 116.0 | 116.0 | 116.0 | 116.0 | 116.0 | 115.6 | |||||||||
| periclase | |||||||||||||||
| 4.130 | 4.231 | 4.194 | 4.194 | 4.192 | 4.238 | 4.212 | (Mg-O) | 2.065 | 2.115 | 2.097 | 2.097 | 2.096 | 2.119 | 2.106 | |
| copper | |||||||||||||||
| 3.522 | 3.661 | 3.596 | 3.595 | 3.599 | 3.599 | 3.615 | (Cu-Cu) | 2.512 | 2.589 | 2.543 | 2.542 | 2.545 | 2.545 | 2.556 | |
| mre (%) | -0.79 | 1.31 | 0.27 | 0.99 | 0.43 | 2.31 | |||||||||
| mare (%) | 1.35 | 2.15 | 0.82 | 2.32 | 1.17 | 5.28 | |||||||||
The space group of silicon is . The Si atoms are located at and occupied the Wyckoff sites. Wyckoff1974 In Table 2, the optimal lattice constant of silicon calculated using different XC functionals are summarized and compared to the experimental value Å. Madelung2002
The unit cell of -quartz is trigonal (space group ). It contains nine atoms: the Si atoms are located at on the Wyckoff sites, while the O atoms are located at on the Wyckoff sites. Hence, four internal coordinates , , , are required, besides the two lattice constants and , in order to completely determine the structure. The theoretical value calculated here using the different XC functionals are reported in Table 2. A comparison with the experimental values of Ref. Levien1980, is also provided.
Stishovite has the rutile structure which is tetragonal (space group ). The positions of the Si atoms are imposed by symmetry: they occupy the Wyckoff sites located at and . The O atoms are located at , and on the Wyckoff sites. The structure of stishovite is thus completely defined by the lattice constants and and a single internal coordinate . In Table 2, our calculated results are compared with experimental values. Hill1983
Zircon has a conventional unit cell which is body-centered tetragonal (space group ). The positions of Zr and Si atoms are imposed by symmetry: they are located at and on the and Wyckoff sites, respectively. The O atoms occupy the Wyckoff sites , where and are internal parameters. Hence, the structure of zircon is completely determined by the two lattice constants and and the two internal coordinates and . Table 2 summarizes our theoretical results for zircon together with the measurements of Ref. Mursic1992, .
The space group of periclase is . The O atom occupies the Wyckoff site and the Mg atom is located at occupying the Wyckoff sites. In Table 2, the optimal lattice constant of periclase calculated using different XC functionals are summarized and compared to the experimental value Å. Li2006
The space group of copper is . The Cu atom is located at occupied the Wyckoff sites. The equilibrium lattice constants for copper are summarized in Table 2.
In Table 2, we observe the well known general tendency of LDA and PBE to respectively underestimate and overestimate lattice constants. PBEsol and WC are the closest to the experimental lattice parameters. AM05 performs only slightly worse than these functionals because of its larger errors for the -quartz lattice parameter. These results are in agreement with a larger data set showing that WC, PBEsol and AM05 perform similarly and better than LDA and PBE for lattice constants. Haas2009 On the other hand, the HTBS functional is not performing better than LDA and PBE, and definitely does not reach the accuracy of the WC functional. The most dramatic failure of HTBS happens with -quartz which cannot be stabilized and relaxes to -quartz (or high-quartz).
The latter is the stable polymorph of silica at higher temperature: at normal pressures, silica undergoes a structural transition from - to -quartz above 500∘C. In fact, these two forms of quartz are very similar, the relative positions of the atoms being only slightly shifted. The Si (resp. O) atoms move from the 3a (resp. 6c) and Wyckoff sites located at [resp. ] in the phase to the 3c (resp. 6i) Wyckoff sites located at [resp. ] in the phase. The number of internal coordinates is thus reduced from four (, , , ) to one (). The - to -quartz transition is displacive: the nearest neighbors of each atom remain the same, without breaking any of the chemical bonds. The relative positions of the atoms within the SiO4 tetrahedra remain almost identical and the tetrahedra are not distorted very much. Instead, the SiO4 tetrahedra get slightly twisted in a way that causes the unit cell which is trigonal (space group ) in -quartz to become hexagonal (space group ) in -quartz.
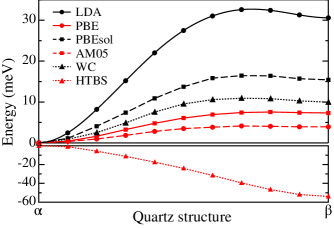
In Fig. 1, we report the energy for various quartz structures (obtained by a linear interpolation of the internal coordinates and the lattice constants) along the path from - to -quartz for the different XC functionals. The -quartz is found to be the stable phase with all functionals but HTBS, while -quartz is a local minimum. With the HTBS functional, it is the -quartz phase which is stable while the -quartz phase is unstable.
We would like to point out that most of the studies evaluating the new GGA functionals Haas2009 were carried out on highly-symmetric solids with few structural degrees of freedom (often only one lattice constant). The failure of HTBS for -quartz shows that more complex structures (with internal parameters) should also be used to assess the performance of XC functionals in modeling structural parameters.
II.2 Phonon frequencies at the point
We first compute the phonon frequencies at the point of the Brillouin zone for the different materials using the different XC functionals. The calculations are performed using the corresponding theoretical equilibrium geometry (lattice parameters and internal coordinates) rather than the experimental one. As Baroni et al., Baroni2001 we think that this is the most consistent choice when comparing with experimental data at low temperature. Furthermore, our aim is to evaluate the performance of the different XC functionals for predicting properties governed by lattice dynamics and it is more sensible to do so assuming that the experimental geometry is unknown. Indeed, when this is the case, it is mandatory to choose the theoretical equilibrium geometry for further calculations. Note that, due to the weak volume dependence of the Grüneisen parameter, it is straightforward to relate results at the equilibrium geometry with those e.g., at the experimental geometry. This will be discussed in more detail in Sec. II.4 below.
In -quartz, stishovite, zircon, and periclase, the nonvanishing components of the Born effective charge tensors note:zeff make it necessary to properly include the dipole-dipole interaction in the calculation of the interatomic force constants. In particular, the dipole-dipole contribution is found to be responsible for the splitting between the longitudinal and transverse optic (LO and TO, respectively) modes Eu (perpendicular to ) and Au or A2u (parallel to ).
For silicon, the following irreducible representations of optical and acoustical zone-center modes can be obtained from group theory:
Our results for silicon are reported in Table 3 and compared with experimental data. Dolling1963
| Mode | LDA | PBE | PBEsol | AM05 | WC | HTBS | Expt. |
|---|---|---|---|---|---|---|---|
| T1u | 514 | 502 | 509 | 508 | 509 | 506 | 506 |
| mre (%) | 1.53 | -0.80 | 0.54 | 0.58 | 0.37 | 0.05 |
They are in line with the conclusions of Ref. Favot1999, regarding the evolution of the phonon frequencies with the lattice constant. LDA (resp. PBE) underestimates (overestimates) the lattice constants and overestimates (resp. underestimates) the phonon frequency. The other XC functionals produce lattice constants and phonon frequencies in excellent agreement with experiment. In fact, the results are very good (absolute relative error smaller than 2%) for all the XC functionals including LDA and PBE. Thus, this system is not really meaningful on its own to discriminate among them.
For -quartz, the theoretical group analysis predicts the following irreducible representations of optical and acoustical zone-center modes:
Table 4 summarizes our results for -quartz, and compares with experimental results at K. Gervais1975 ; Zakharova1974 Note that the results for the HTBS functional refer to the -quartz.
| Mode | LDA | PBE | PBEsol | AM05 | WC | HTBS | Expt. |
|---|---|---|---|---|---|---|---|
| Raman | |||||||
| A1(1) | 215 | 146 | 182 | 129 | 170 | 29 | 219 |
| A1(2) | 344 | 343 | 341 | 346 | 344 | 352 | 358 |
| A1(3) | 454 | 429 | 438 | 429 | 437 | 423 | 469 |
| A1(4) | 1069 | 1043 | 1055 | 1062 | 1058 | 1063 | 1082 |
| Infrared | |||||||
| A2(TO1) | 351 | 358 | 350 | 366 | 355 | 396 | 361 |
| A2(LO1) | 374 | 377 | 372 | 383 | 376 | 396 | 385 |
| A2(TO2) | 486 | 451 | 467 | 447 | 464 | 410 | 499 |
| A2(LO2) | 540 | 514 | 523 | 513 | 523 | 496 | 553 |
| A2(TO3) | 764 | 742 | 752 | 752 | 753 | 751 | 778 |
| A2(LO3) | 781 | 748 | 762 | 756 | 761 | 751 | 791 |
| A2(TO4) | 1063 | 1029 | 1044 | 1049 | 1047 | 1047 | 1072 |
| A2(LO4) | 1226 | 1196 | 1207 | 1215 | 1211 | 1215 | 1230 |
| Eu(TO1) | 129 | 113 | 119 | 110 | 117 | 105 | 133 |
| Eu(LO1) | 129 | 113 | 119 | 110 | 117 | 105 | 133 |
| Eu(TO2) | 258 | 247 | 250 | 245 | 249 | 243 | 269 |
| Eu(LO2) | 259 | 247 | 251 | 246 | 250 | 243 | 269 |
| Eu(TO3) | 381 | 377 | 376 | 379 | 378 | 384 | 394 |
| Eu(LO3) | 391 | 383 | 384 | 385 | 386 | 384 | 402 |
| Eu(TO4) | 441 | 416 | 425 | 415 | 425 | 401 | 453 |
| Eu(LO4) | 498 | 477 | 483 | 478 | 484 | 470 | 512 |
| Eu(TO5) | 685 | 654 | 667 | 660 | 666 | 652 | 698 |
| Eu(LO5) | 688 | 655 | 669 | 661 | 668 | 652 | 701 |
| Eu(TO6) | 786 | 751 | 767 | 759 | 766 | 750 | 799 |
| Eu(LO6) | 799 | 763 | 779 | 771 | 778 | 762 | 812 |
| Eu(TO7) | 1054 | 1025 | 1038 | 1044 | 1041 | 1044 | 1066 |
| Eu(LO7) | 1217 | 1188 | 1200 | 1207 | 1204 | 1209 | 1227 |
| Eu(TO8) | 1140 | 1126 | 1130 | 1144 | 1136 | 1152 | 1158 |
| Eu(LO8) | 1137 | 1125 | 1128 | 1143 | 1134 | 1152 | 1155 |
| mre (%) | -2.22 | -6.92 | -5.10 | -6.61 | -5.23 | -8.79 | |
| mare (%) | 2.22 | 6.92 | 5.10 | 6.71 | 5.23 | 9.68 |
In contrast with silicon, it is not obvious to correlate the performance for phonon frequencies with the structural properties. However, the relative errors vary much more significantly for the different XC functionals. LDA shows the smallest relative errors, which are actually two to three times smaller than for the other XC functionals. LDA, PBE, PBEsol, and WC are found to systematically underestimate the phonon frequencies. It is almost systematically the case for AM05. HTBS leads to the worst results since they refer to the -quartz.
For stishovite, the following irreducible representations of optical and acoustical zone-center modes can be obtained from group theory:
In Table 5, we show the calculated and experimental values Vigasina1989 ; Hofmeister1990 for the frequency of each mode at the point of stishovite.
| Mode | LDA | PBE | PBEsol | AM05 | WC | HTBS | Expt. |
|---|---|---|---|---|---|---|---|
| Raman | |||||||
| A1g | 748 | 715 | 734 | 732 | 732 | 727 | 751 |
| B1g | 220 | 222 | 218 | 220 | 218 | 219 | 234 |
| B2g | 945 | 902 | 923 | 920 | 924 | 916 | 964 |
| Eg | 578 | 552 | 565 | 564 | 564 | 560 | 586 |
| Infrared | |||||||
| A2u(TO) | 643 | 619 | 632 | 633 | 630 | 629 | 650 |
| A2u(LO) | 1047 | 1013 | 1028 | 1028 | 1028 | 1023 | 950 |
| Eu(TO1) | 465 | 422 | 445 | 444 | 446 | 441 | 470 |
| Eu(LO1) | 563 | 527 | 545 | 543 | 546 | 539 | 565 |
| Eu(TO2) | 577 | 529 | 555 | 550 | 555 | 548 | 580 |
| Eu(LO2) | 701 | 672 | 684 | 684 | 686 | 680 | 700 |
| Eu(TO3) | 819 | 791 | 804 | 805 | 803 | 800 | 820 |
| Eu(LO3) | 1032 | 989 | 1011 | 1009 | 1011 | 1004 | 1020 |
| Silent | |||||||
| B1u(1) | 383 | 367 | 374 | 374 | 374 | 372 | — |
| B1u(2) | 749 | 718 | 734 | 732 | 734 | 728 | — |
| A2g | 600 | 573 | 581 | 582 | 584 | 577 | — |
| mre (%) | -0.11 | -4.72 | -2.48 | -2.59 | -2.49 | -3.14 | |
| mare (%) | 2.03 | 5.82 | 3.85 | 3.95 | 3.86 | 4.42 |
While PBEsol and WC provide the best structural properties, it is again LDA which leads to the smallest relative error on the phonon frequencies. It is worth mentioning that all the alternative GGA functionals (PBEsol, AM05, WC, and HTBS) improve compared to PBE, PBEsol and WC providing the best results (though worse than LDA). None of the functionals present a systematic trend (under- or overestimation) in the errors.
For zircon, the theoretical group analysis provides the following irreducible representations of optical and acoustical zone-center modes:
Table 6 summarizes our results for zircon and compares with experimental results. Dawson1971 The dipole-dipole contribution is found to be responsible for the splitting between the longitudinal optical (LO) and transverse optic (TO) modes and at the point.
| Mode | LDA | PBE | PBEsol | AM05 | WC | HTBS | Expt. |
|---|---|---|---|---|---|---|---|
| Raman | |||||||
| A1g(1) | 437 | 415 | 425 | 423 | 426 | 422 | 439 |
| A1g(2) | 960 | 920 | 940 | 936 | 941 | 933 | 974 |
| B1g(1) | 222 | 201 | 212 | 210 | 213 | 209 | 214 |
| B1g(2) | 388 | 368 | 378 | 375 | 379 | 375 | 393 |
| B1g(3) | 626 | 603 | 612 | 610 | 614 | 607 | — |
| B1g(4) | 1002 | 956 | 981 | 977 | 981 | 975 | 1008 |
| B2g | 256 | 256 | 253 | 256 | 254 | 254 | 266 |
| Eg(1) | 193 | 191 | 190 | 192 | 191 | 191 | 201 |
| Eg(2) | 224 | 213 | 218 | 218 | 218 | 217 | 225 |
| Eg(3) | 362 | 322 | 343 | 334 | 345 | 333 | 357 |
| Eg(4) | 535 | 521 | 525 | 527 | 526 | 524 | 547 |
| Eg(5) | 910 | 867 | 889 | 886 | 890 | 884 | — |
| Infrared | |||||||
| A2u(TO1) | 345 | 315 | 330 | 327 | 331 | 327 | 338 |
| A2u(LO1) | 471 | 449 | 460 | 459 | 460 | 457 | 480 |
| A2u(TO2) | 596 | 572 | 582 | 580 | 584 | 577 | 608 |
| A2u(LO2) | 640 | 611 | 624 | 621 | 626 | 618 | 647 |
| A2u(TO3) | 967 | 921 | 946 | 942 | 946 | 940 | 989 |
| A2u(LO3) | 1084 | 1039 | 1061 | 1059 | 1063 | 1055 | 1108 |
| Eu(TO1) | 279 | 252 | 267 | 263 | 268 | 262 | 287 |
| Eu(LO1) | 338 | 331 | 333 | 334 | 334 | 332 | 352 |
| Eu(TO2) | 376 | 355 | 365 | 362 | 366 | 361 | 389 |
| Eu(LO2) | 416 | 391 | 404 | 400 | 405 | 398 | 419 |
| Eu(TO3) | 422 | 413 | 414 | 415 | 416 | 413 | 430 |
| Eu(LO3) | 463 | 444 | 452 | 452 | 452 | 449 | 471 |
| Eu(TO4) | 856 | 813 | 836 | 832 | 836 | 830 | 885 |
| Eu(LO4) | 1017 | 972 | 994 | 990 | 996 | 987 | 1035 |
| Silent | |||||||
| B1u | 124 | 135 | 127 | 132 | 128 | 134 | — |
| A2g | 243 | 242 | 240 | 242 | 241 | 241 | — |
| A1u | 391 | 388 | 387 | 389 | 388 | 389 | — |
| B2u(1) | 562 | 541 | 551 | 550 | 551 | 547 | — |
| B2u(2) | 933 | 892 | 913 | 908 | 914 | 905 | — |
| mre (%) | -1.49 | -6.36 | -4.08 | -4.45 | -3.84 | -4.82 | |
| mare (%) | 2.09 | 6.36 | 4.08 | 4.45 | 3.84 | 4.82 |
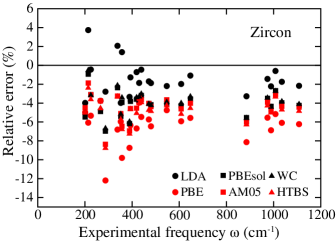
As for stishovite, there is no clear correlation between the performance with respect to the prediction of the structural properties and the quality of the phonon frequencies. In the case of zircon, all the GGA functionals tend to underestimate the phonon frequencies, whereas there is no systematic trend for LDA. Once again, PBE is performing the worst, while PBEsol and WC are the best GGAs. These conclusions are clearly seen in Fig. 2, which shows the relative errors for each phonon mode as a function of the experimental frequency. A similar graph (not shown here for sake of brevity) is obtained for both SiO2 phases (-quartz and stishovite). It is also interesting to note that all functionals tend to underestimate the experimental data at high frequency.
For periclase, the following irreducible representations of optical and acoustical zone-center modes can be obtained from group theory:
Table 7 shows our results for periclase and experimental values. Sangster1970
| Mode | LDA | PBE | PBEsol | AM05 | WC | HTBS | Expt. |
|---|---|---|---|---|---|---|---|
| Infrared | |||||||
| T1u(TO1) | 420 | 373 | 391 | 390 | 391 | 370 | 396 |
| T1u(LO1) | 727 | 686 | 698 | 699 | 700 | 684 | 710 |
| mre (%) | 4.23 | -4.59 | -1.48 | -1.53 | -1.34 | -5.11 | |
| mare (%) | 4.23 | 4.59 | 1.48 | 1.53 | 1.34 | 5.11 |
In periclase, the worst results are obtained with HTBS. LDA and PBE perform slightly better (with a similar accuracy), the best performances being obtained with PBEsol, WC, and AM05 in contrast with the observations for the other oxides (quartz, stishovite, and zircon). Note that the LDA systematically overestimates while all the GGAs underestimate the phonon frequencies.
For copper, all the phonon frequencies at the point are zero. There are only three acoustic since there is one atom per unit cell. An analysis of the fundamental frequencies at other selected points of the Brillouin zone will be given in Sec. II.3.
Globally, LDA is the functional that performs the best among all, while PBEsol and WC are the best among the GGAs. The worst result is obtained with HTBS for the A1(1) mode of quartz (29 cm-1 instead of 219 cm-1). This tremendous error comes from the wrong prediction of the stable structure with this functional (- instead of -quartz). Even after the exclusion of the quartz data, the HTBS functional still performs significantly worse than LDA, WC, PBEsol and AM05. Note also that there is no systematic trend (under- or overestimation) in the relative errors obtained with the different functionals.
II.3 Phonon-dispersion relations
We also compute the phonon bandstructure and density of states (DOS) of the different materials using the different XC functionals. Our results are presented in Figs. 3-8. Available experimental data are also reported for comparison. The agreement is qualitatively very good though some significant discrepancies are present (especially at higher frequencies) independently of the XC functional. Given the variations existing in the experimental data and the typical error bars, it did not seem meaningful to us to define a quantitative measure of the agreement between theory and experiment in order to discriminate between the different XC functionals.
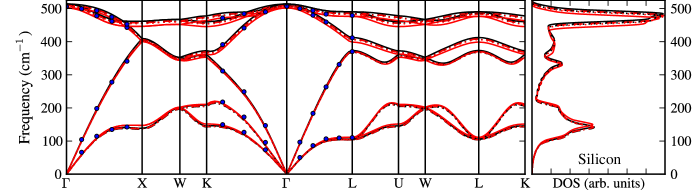
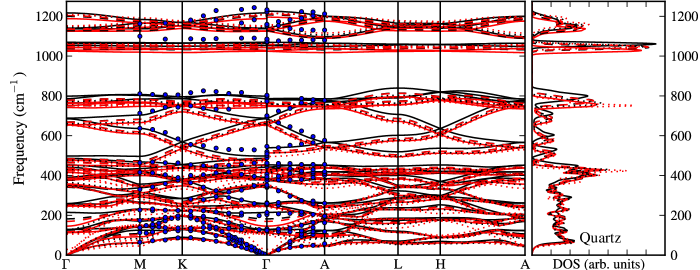
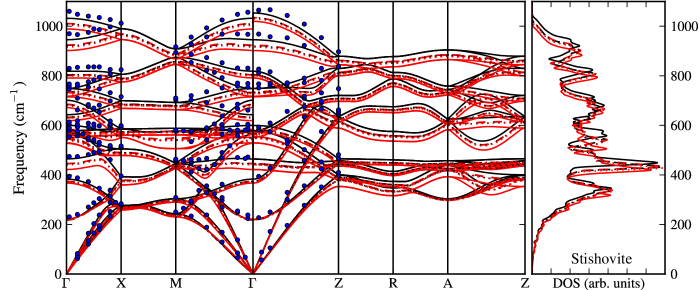
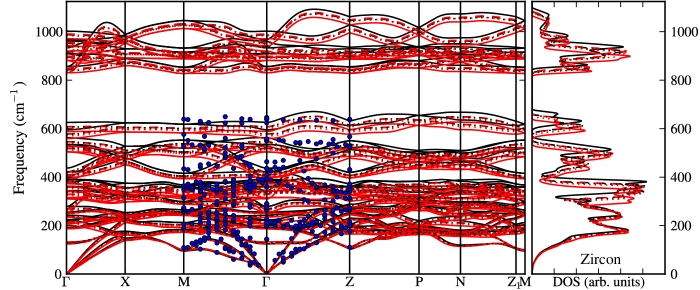
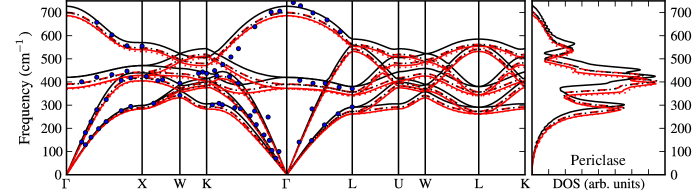
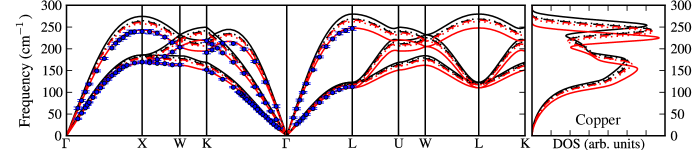
For the oxides (-quartz, stishovite, zircon, and periclase), it is reasonable to say that the LDA seems to perform slightly better than all the GGA functionals. In contrast, for copper, LDA shows the largest discrepancies while PBE seems to perform the best. This can also be seen in Table 8 where the fundamental frequencies at selected points of the Brillouin zone have been reported.
We would like to point out that our results for copper are shifted up by 5-7% compared to those of Ref. DalCorso2013, in which the WC and PBEsol frequencies match the experimental data better than LDA or PBE. There are several differences between the two calculations which may explain this discrepancy. In Ref. DalCorso2013, , the phonon frequencies are computed at the equilibrium lattice constant at =296 K, while we use the one at =0. This probably accounts for 1-2% difference, as observed experimentally Nicklow1967 and as discussed below. Furthermore, the calculations of Ref. DalCorso2013, are based on the projector augmented wave (PAW) method, while ours rely on the use of norm-conserving pseudopotentials. It is interesting to point out that despite the equilibrium lattice constants at =0 K are in excellent agreement (at most 0.5% discrepancy), the phonon frequencies may show important differences. This emphasizes the importance of assessing the accuracy of pseudopotentials by comparing with all-electron results not only for structural but also for dynamical properties.
| Mode | LDA | PBE | PBEsol | AM05 | WC | HTBS | Expt. |
|---|---|---|---|---|---|---|---|
| XT | 186 | 168 | 180 | 183 | 178 | 176 | 169 |
| XL | 275 | 243 | 263 | 265 | 261 | 257 | 240 |
| WΛ | 184 | 162 | 177 | 179 | 175 | 173 | 163 |
| WΠ | 232 | 205 | 223 | 225 | 220 | 218 | 203 |
| LT | 123 | 110 | 119 | 121 | 117 | 117 | 112 |
| LL | 280 | 248 | 268 | 269 | 266 | 262 | 247 |
| mre (%) | 12.50 | -0.06 | 8.21 | 9.38 | 6.99 | 5.88 | |
| mare (%) | 12.50 | 0.94 | 8.21 | 9.38 | 6.99 | 5.88 |
When looking at the phonon DOS in Figs. 3-8, it looks as if it were simply shifted when changing the XC functional (with LDA and PBE at the upper and lower ends and all the other functionals falling in the middle almost on top of one another). This is confirmed by computing the different moments of the phonon DOS: the average frequency (1st moment) is much more dependent on the XC functional than all higher moments. In Table 9, we show the average frequency and the standard deviation (2nd moment) extracted from the phonon DOS computed at the theoretical lattice constant of the different materials using the different XC functionals. Higher moments (not reported for sake of brevity) do not vary much with the XC functional.
| LDA | PBE | PBEsol | AM05 | WC | HTBS | ||||
|---|---|---|---|---|---|---|---|---|---|
| silicon | 330 | 324 | 327 | 327 | 326 | 325 | |||
| 146 | 139 | 145 | 145 | 144 | 144 | ||||
| -quartz | 557 | 539 | 545 | 546 | 544 | 541 | |||
| 359 | 352 | 356 | 357 | 360 | 361 | ||||
| stishovite | 580 | 552 | 566 | 566 | 564 | 562 | |||
| 207 | 201 | 204 | 204 | 204 | 203 | ||||
| zircon | 480 | 458 | 468 | 470 | 467 | 465 | |||
| 294 | 281 | 288 | 288 | 287 | 286 | ||||
| periclase | 413 | 383 | 392 | 393 | 392 | 379 | |||
| 118 | 113 | 114 | 114 | 114 | 112 | ||||
| copper | 183 | 163 | 176 | 175 | 178 | 173 | |||
| 55 | 49 | 53 | 52 | 53 | 52 |
II.4 Volume dependence of the phonon frequencies
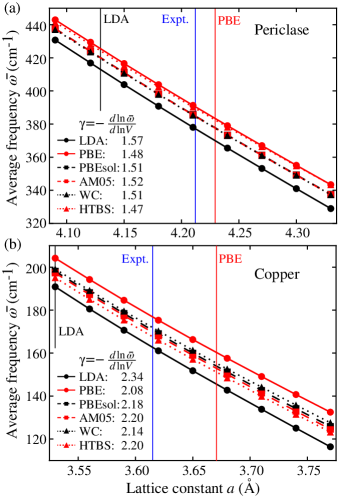
The different XC functionals lead to different lattice constants and the latter influence the computed frequency. Here, we study the volume dependence of the average frequency () for the different XC functionals.
We can distinguish an indirect effect through the equilibrium lattice constant from the direct effect (for a fixed lattice constant). Indeed, the average frequency changes quite strongly with the lattice constants as illustrated in Fig. 9 for periclase and copper: an increase of the lattice constant by 0.2 Å can induce a decrease of by 80-100 cm-1. In contrast, the direct effect is rather small at most 15 cm-1 between the two extreme results (produced by LDA and PBE). To illustrate this point, let us consider periclase. In Table 9, we have =413 cm-1 using LDA and 383 cm-1 using PBE. This looks like a decrease by 30 cm-1. However, these values are calculated for two different lattice constants =4.13 Å for LDA and =4.23 Å for PBE. If the functional were changed from LDA to PBE while keeping the LDA equilibrium lattice constant, the average frequency would actually increase by 13 cm-1 (from 413 to 426 cm-1). This is the direct effect of the XC functional. Whereas, the indirect effect (due to the change from LDA to PBE equilibrium lattice constant) produces a decrease by 43 cm-1.
The lattice (or volume) dependence of the average frequency is measured by the corresponding Grüneisen parameter which is also reported in Fig. 9. Interestingly enough, all functionals produce very comparable Grüneisen parameters. For periclase, 1.47-1.57 is comparable to the measured values ranging from 1.49 Ganesan1962 to 1.60. Ledbetter1991 For copper, 2.08-2.34 is in very good agreement with the reported experimental value of 2 Collins1963 ; Gshneider1964 ; Ledbetter1991 and previous theoretical results. Vila2007 This weak variation with the XC functional might be exploited as follows. If the average frequencies were known for various XC functionals at a given lattice constant value, computing the volume dependence of the frequency for just one of those functionals would be sufficient to provide a reasonable extrapolation scheme for for any of the XC functionals.
II.5 Thermodynamical properties
The vibrational entropy of a solid can be obtained from its phonon distribution. This quantity is of importance for the ab initio assessment of solid phase stability. The entropy at temperature is first computed within the harmonic approximation Lee1995 for the different materials in their equilibrium structural configuration. In Table 10, the entropy at 298K calculated using the various XC functionals is compared with the experimental measurements. Chase1998 ; Kubaschewski1993 ; Yong2012 All the results are in good agreement with experiments apart from those for zircon. note:zircon We note that the LDA functional presents the best results. AM05, PBEsol and WC are the best among the GGAs, while HTBS is the worst.
In any case, the absolute error on the contribution of the vibrational entropic term to the free energy (TS) is around 2 to 3 meV/atom. This is much smaller than the typical errors on the energy term.Lany2008 ; Hautier2012b
| LDA | PBE | PBEsol | AM05 | WC | HTBS | Expt. | |
| silicon | |||||||
| 19.41 | 19.56 | 19.67 | 19.61 | 19.67 | 19.71 | 18.81111Ref. Chase1998, -18.80222Ref. Kubaschewski1993, | |
| -quartz | |||||||
| 42.40 | 44.32 | 43.76 | 43.86 | 44.48 | 44.95 | 41.4411footnotemark: 1-43.4022footnotemark: 2 | |
| stishovite | |||||||
| 24.56 | 26.84 | 25.72 | 25.66 | 25.81 | 26.03 | 24.94333Ref. Yong2012, | |
| zircon | |||||||
| 90.15 | 94.86 | 92.77 | 92.38 | 93.20 | 93.41 | 84.5022footnotemark: 2 | |
| periclase | |||||||
| 25.71 | 28.59 | 27.59 | 27.52 | 27.63 | 28.96 | 26.9511footnotemark: 1-26.9022footnotemark: 2 | |
| copper | |||||||
| 30.21 | 32.94 | 31.06 | 31.34 | 30.85 | 31.57 | 33.1511footnotemark: 1-33.1022footnotemark: 2 | |
| -0.83 | 5.68 | 2.83 | 2.79 | 3.18 | 4.77 | mre (%) | |
| 4.52 | 5.87 | 4.90 | 4.58 | 5.47 | 6.34 | mare (%) | |
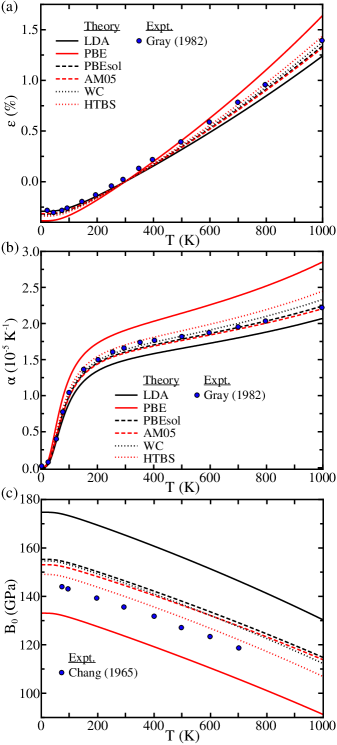
In the following, we take periclase and copper as examples to study how XC functionals impact other thermal properties. First, the free energy [] at temperature and lattice constant [volume ] are computed within the quasi-harmonic approximation. Baroni2001 By fitting the results for the free energy to the thrird-order Birch-Murnaghan equation of state,Birch1947 we can obtain the variation in temperature of the equilibrium lattice constants [volumes ], the bulk modulus , and the pressure derivative of the bulk modulus . The linear expansion is then given by
where =298 K is the reference temperature. Finally, the coefficient of linear expansion is obtained as
Figs. 10 and 11 show the results for (a) (expressed as a percentage), (b) , and (c) using various XC functionals.
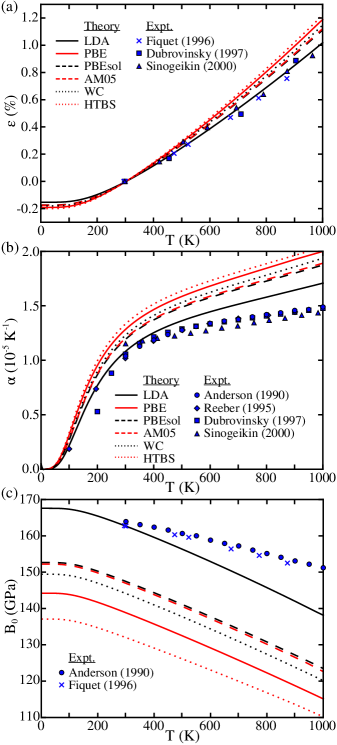
For periclase, the anharmonic effects are very important. Thus, empirical corrections are necessary to obtain good thermodynamical properties over a wide temperature range. Otero2011 ; Zhang2012 Here, we did not go through this special procedure that would not allow to discriminate the different XC functionals. So, the calculations of , , and were limited to temperatures lower than 1000 K. Ideally, it would be better to focus on even smaller temperatures but very few data are available. At low temperature, LDA seems to produce the best results. In contrast, like for the frequency at , the HTBS results fall outside the LDA-PBE range on the PBE side, leading to the worst agreement with experiments.
For copper, LDA (resp. PBE) underestimates (resp. overestimates) the expansion ( and ) while all the other GGAs show an excellent agreement with the experimental results. For the bulk modulus, PBE underestimates compared to the measured data, while all other functionals overestimate. HTBS performs the best and LDA is the worst with 5% and 20% discrepancy, respectively. All other GGAs (including PBE) show an error of 7-8% compared to experiments.
II.6 Dielectric permittivity tensors
Finally, we turn to the calculation of the electronic () and static () permittivity tensors. The electronic (ion-clamped) dielectric permittivity tensor is related to the second-order derivatives of the energy with respect to the macroscopic electric field. The static dielectric permittivity tensor also includes the polarization coming from the ionic displacements. It is obtained by adding the contributions of different modes to as follows
| (1) | |||||
where is the volume of the primitive unit cell and is the mode-oscillator strength.
The electronic () and static () permittivity tensors, as well as the contributions of the individual modes , are reported in Table 11 for -quartz, stishovite, zircon, and periclase. Due to the symmetry of the different crystalline systems, they have two different components parallel () and perpendicular () to the axis for the first three materials [-quartz (trigonal), stishovite and zircon (tetragonal)], while the tensor is isotropic for periclase (cubic). In stishovite and zircon (resp. -quartz), the phonon mode contributions to come from the three IR-active A2u (resp. A2) modes, while the contributions to come from the four IR-active Eu (resp. E) modes. In periclase, the contribution arises from the T1u mode. For -quartz, the experimental values (at 298K) are taken from Ref. Gervais1975, , except for the two lowest E modes which are from Ref. Russel1967, . For stishovite, the measurements are those of Ref. Stishov1961, . For zircon, the reported experimental values are from Ref. Gervais1973, for the parallel components (values at 295 K), and from Ref. Pecharroman1994, for the perpendicular components. For periclase, the measurements are those of Ref. Sun2008, .
| LDA | PBE | PBEsol | AM05 | WC | HTBS | Expt. | LDA | PBE | PBEsol | AM05 | WC | HTBS | Expt. | |||||
| -quartz | ||||||||||||||||||
| 2.50 | 2.41 | 2.46 | 2.39 | 2.43 | 2.31 | 2.42 | 2.47 | 2.38 | 2.43 | 2.36 | 2.41 | 2.29 | 2.39 | |||||
| 0.73 | 0.68 | 0.71 | 0.65 | 0.69 | 0.00 | 0.67 | 0.00 | 0.00 | 0.00 | 0.00 | 0.00 | 0.02 | 0.00 | |||||
| 0.75 | 0.85 | 0.79 | 0.87 | 0.81 | 1.50 | 0.65 | 0.06 | 0.03 | 0.05 | 0.02 | 0.04 | 0.00 | 0.05 | |||||
| 0.15 | 0.05 | 0.09 | 0.04 | 0.07 | 0.00 | 0.11 | 0.41 | 0.32 | 0.36 | 0.31 | 0.35 | 0.00 | 0.33 | |||||
| 0.73 | 0.76 | 0.74 | 0.74 | 0.74 | 0.74 | 0.66 | 0.84 | 0.93 | 0.88 | 0.94 | 0.89 | 1.23 | 0.83 | |||||
| 0.03 | 0.01 | 0.02 | 0.01 | 0.02 | 0.00 | 0.02 | ||||||||||||
| 0.12 | 0.11 | 0.11 | 0.11 | 0.11 | 0.10 | 0.11 | ||||||||||||
| 0.70 | 0.72 | 0.71 | 0.71 | 0.71 | 0.71 | 0.65 | ||||||||||||
| 0.01 | 0.00 | 0.01 | 0.00 | 0.01 | 0.00 | 0.01 | ||||||||||||
| 4.85 | 4.74 | 4.79 | 4.68 | 4.74 | 4.55 | 4.64 | 4.64 | 4.52 | 4.57 | 4.46 | 4.52 | 4.35 | 4.43 | |||||
| stishovite | ||||||||||||||||||
| 3.38 | 3.44 | 3.43 | 3.42 | 3.42 | 3.43 | 3.33 | 3.30 | 3.35 | 3.35 | 3.34 | 3.34 | 3.34 | 3.24 | |||||
| 5.59 | 5.77 | 5.63 | 5.60 | 5.69 | 5.62 | — | 6.85 | 9.01 | 7.49 | 7.69 | 7.58 | 7.67 | — | |||||
| 0.45 | 0.09 | 0.38 | 0.30 | 0.35 | 0.34 | — | ||||||||||||
| 0.79 | 0.74 | 0.80 | 0.78 | 0.79 | 0.79 | — | ||||||||||||
| 8.97 | 9.21 | 9.06 | 9.02 | 9.11 | 9.05 | — | 11.40 | 13.19 | 12.02 | 12.12 | 12.06 | 12.14 | — | |||||
| zircon | ||||||||||||||||||
| 4.35 | 4.41 | 4.41 | 4.39 | 4.39 | 4.41 | 3.80 | 4.15 | 4.17 | 4.19 | 4.17 | 4.18 | 4.18 | 3.50 | |||||
| 6.03 | 7.12 | 6.53 | 6.71 | 6.49 | 6.69 | 5.75 | 5.69 | 8.07 | 6.68 | 7.15 | 6.59 | 7.10 | 5.70 | |||||
| 0.54 | 0.50 | 0.52 | 0.51 | 0.52 | 0.51 | 0.36 | 1.19 | 0.57 | 0.95 | 0.79 | 0.94 | 0.79 | 0.60 | |||||
| 0.88 | 0.95 | 0.91 | 0.92 | 0.91 | 0.91 | 0.78 | 0.12 | 0.23 | 0.17 | 0.20 | 0.16 | 0.21 | 0.15 | |||||
| 0.42 | 1.48 | 1.45 | 1.44 | 1.45 | 1.44 | 1.20 | ||||||||||||
| 11.80 | 12.98 | 12.37 | 12.54 | 12.30 | 12.51 | 10.69 | 12.59 | 14.52 | 13.44 | 13.76 | 13.31 | 13.70 | 11.25 | |||||
| periclase | ||||||||||||||||||
| 3.04 | 3.10 | 3.11 | 3.09 | 3.09 | 3.10 | 2.95 | ||||||||||||
| 6.76 | 7.37 | 6.81 | 6.87 | 6.80 | 7.50 | 6.25 | ||||||||||||
| 9.80 | 10.47 | 9.91 | 9.96 | 9.89 | 10.60 | 9.20 | ||||||||||||
| mre (%) | mare (%) | |||||||||||||||||
| 6.59 | 6.59 | 7.27 | 6.10 | 6.68 | 5.42 | 6.59 | 6.83 | 7.27 | 6.81 | 6.68 | 7.91 | |||||||
| 7.62 | 13.70 | 9.86 | 9.88 | 9.01 | 10.05 | 7.62 | 13.70 | 9.86 | 9.88 | 9.01 | 11.55 | |||||||
The theoretical values of are larger than the experimental ones by about 6–8%, as often found in DFT. The only exception is -quartz for which the values obtained with the different GGAs are much closer to the experimental values and tend to slightly underestimate it (note that HTBS results actually refer to -quartz). In fact, the overestimation of the electronic dielectric constant can be related to the band-gap problem of DFT. And, since the different XC functionals used here have not been designed to produce a correct band gap, there is not a significant difference among the different results.
The contributions of each individual mode depend on the volume (), the oscillator strength () and the frequency of the IR-active mode (). As a result, the effects of the different XC functionals are closely connected to previous discussions of the structural properties and the frequencies at the point. The largest differences (in absolute values note:deps ) from one functional to another obviously appear in the low frequency modes for which the contributions can be quite significant (since ). For such modes, the errors with respect to experiments can also be quite large.
For instance, the error on for zircon is about 40% when using PBE. It is also the contribution for which there is the largest difference between XC functionals (42% from LDA which is very close the experimental value to PBE). The difference in is the combination of the differences in each of its components (, , and ). In this case, the most important differences originate from oscillator strength (22%) and (12%, which also leads to 22% discrepancy when taken to the square). These are slightly compensated by the difference in (2%).
It is worth mentioning that the differences in the oscillator strength are due essentially to differences in the atomic displacements (related to the second derivatives of the total energy with respect to atomic displacements, just like the frequencies). Indeed, we found that the XC functional has a very little impact (at most 1-2%) on the Born effective charges (connected to the mixed second-order derivative of the energy with respect to atomic displacements and macroscopic electric field). And, since our results are in excellent agreement with previous calculations, the Born effective charges are not reported here for sake of brevity. However, we would like to point out that it is known that DFT tends to overestimate the Born effective charges. Filippetti2003 And, as a result, part of the discrepancy of with respect to experiments can be explained by the too large oscillator strengths.
Finally, we turn to the static dielectric constant . The theoretical values are larger than the experimental ones by about 8-14%. This is directly related to previous discussion about and . The best results are obtained within LDA, while PBE and HTBS lead to the worst results. The other three functionals (PBEsol, AM05, and WC) have a similar accuracy which is slightly worse than for LDA.
III Discussion
In view of our results on different functionals, materials and DFPT properties, a few general statements and considerations can be made. For all oxides and semiconductors, LDA performs surprisingly well in most of the cases. As the LDA lattice parameter is strongly underestimated and the lattice parameter has a large role in determining the frequencies (see Sec. II.4), the success of LDA must be due to some cancellation of errors. Accurate vibrational properties are obtained with a significantly underestimated lattice parameter. This implies that using the experimental lattice parameter with LDA will degrade the quality of the DFPT results. Interestingly, PBE does not benefit from a similar effect and, as a result, it is inaccurate in both the lattice parameters and the frequencies. Similar conclusions were found when investigating the theoretical Debye-Waller factors Vila2007 , leading the proposal of an ad-hoc functional obtained by mixing 50% of LDA and 50% of PBE. The optimal functionals providing both accurate structural factors and reasonably accurate (i.e., at least better than PBE) frequencies are the WC, PBEsol and AM05. Finally, HTBS is not to be recommended for DFPT as both structural parameters and frequencies are not accurate.
If one uses a functional such as PBEsol or WC (that give very good structural parameters), phonon frequencies are usually accurate within maximum 5%, vibrational entropies within maximum 6%, and static dielectric constants overestimate experiments systematically by at most 10%. These results show that while there are differences between functionals, DFPT computations are accurate enough to lead to a reasonable predictive power.
On the other hand, the only metal in our data set (copper) shows a very different behavior with the best functional being PBE and the worst being LDA, PBEsol, WC and AM05. In view of previous work on metal phonon frequencies DalCorso2013 and Debye-Waller factors Vila2007 with DFPT this discrepancy might originate from the pseudopotential.
IV Summary
In this paper, the validity of various exchange-correlation functionals (LDA, PBE, PBEsol, WC, AM05, and HTBS) has been investigated for computing the structural, vibrational, dielectric, and thermodynamical properties of various materials (silicon, SiO2 -quartz and stishovite, ZrSiO4 zircon, MgO periclase, and copper) in the framework of DFPT. For the structural properties, PBEsol and WC are found to provide the results closest to the experiments and AM05 performs only slightly worse. These three functionals constitute an improvement over LDA and PBE in contrast with HTBS which has been shown to be really problematic for -quartz.
For the vibrational and thermodynamical properties, LDA performs surprisingly very well. In the majority of cases, it outperforms PBE significantly and yields slightly better results than the WC, PBEsol, and AM05 functionals. For the latter functionals, this slight improvement is however detrimental for the structural parameters. On the other hand, HTBS performs also poorly for vibrational quantities.
For the dielectric properties, all the functionals fail to reproduce the electronic dielectric constant due to the well-known band gap problem. They all tend to overestimate the oscillator strengths and hence the static dielectric constant.
Overall, LDA provides very good performances in DFPT computations provided the LDA lattice parameter is used. If accurate lattice parameters are also sought for, the PBEsol, WC and AM05 provide the most accurate structural results while still improving in terms of vibrational quantities compared to PBE.
Acknowledgments
L.H. and A.Z. acknowledge support from the Funds for Creative Research Groups of China under grant 11021101, the National Basic Research Program of China under grant 2011CB309703, and the National Center for Mathematics and Interdisciplinary Sciences of Chinese Academy of Sciences. F.L. is grateful for the funding from the National Science Foundation of China (grants 11071265 and 11171232) and from the Program for Innovation Research in Central University of Finance and Economics. G.H. and G.-M.R. would like to thank the Fund for Scientific Research (F.R.S.-FNRS) for financial sponsorship. M.J.T.O. thankfully acknowledges financial support from the Portuguese FCT (contract #SFRH/BPD/44608/2008). M.A.L.M. is grateful to the French ANR for funding through the project ANR-12-BS04-0001-02. J.J.R. and F.D.V. would like to thank the DOE for financial support through the grants DE-FG03-97ER45623 (J.J.R.) and DE-FG02-03ER15476 (F.D.V.). The computations were carried out on LSSC3 cluster in the State Key Laboratory of Scientific and Engineering computing, Chinese Academy of Sciences.
References
- (1) R. P. Feynman, in Six Easy Pieces (Addison-Wesley, Reading MA), p. 59. (1991).
- (2) G. Hautier, A. Jain, and S. P. Ong, J. Mater. Sci. 47, 7317 (2012).
- (3) W. Kohn and L. J. Sham, Phys. Rev. A 140, 1133(1965).
- (4) S. Baroni, S. de Gironcoli, A. Dal Corso, and P. Giannozzi, Rev. Mod. Phys. 73, 515 (2001).
- (5) J. P. Perdew and Y. Wang, Phys. Rev. B 45, 13244 (1992).
- (6) J. P. Perdew, K. Burke, and M. Ernzerhof, Phys. Rev. Lett. 77, 3865 (1996).
- (7) R. Armiento and A. E. Mattsson, Phys. Rev. B 72, 085108 (2005).
- (8) W. Kohn and A. E. Mattsson, Phys. Rev. Lett. 81, 3487 (1998).
- (9) J. P. Perdew et al., Phys. Rev. Lett. 100, 136406 (2008).
- (10) Z. Wu and R. E. Cohen, Phys. Rev. B 73, 235116 (2006).
- (11) P. Haas, F. Tran, P. Blaha, Phys. Rev. B 79, 085104 (2009).
- (12) P. Haas, F. Tran, P. Blaha, and K. Schwarz, Phys. Rev. B 83, 205117 (2011).
- (13) B. Hammer, L. B. Hansen, and J. K. Nørskov, Phys. Rev. B 59, 7413 (1999).
- (14) F. Favot and A. Dal Corso, Phys. Rev. B 60, 11427 (1999).
- (15) A. Dal Corso and S. de Gironcoli, Phys. Rev. B 62, 273 (2000).
- (16) F. D. Vila, J. J. Rehr, H. H. Rossner, and H. J. Krappe, Phys. Rev. B 76, 014301 (2007).
- (17) A. Dal Corso, J. Phys.: Condens. Matter 25, 145401 (2013).
- (18) X. Gonze et al., Comput. Phys. Commun. 180, 2582-2615 (2009). http://www.abinit.org
- (19) M. A. L. Marques, M. J. T. Oliveira, and T. Burnus, Comput. Phys. Commun. 183, 2272 (2012). http://www.tddft.org/programs/Libxc
- (20) M. Oliveira and F. Nogueira, Comput. Phys. Comm. 178, 524 (2008). http://www.tddft.org/programs/APE/
- (21) Landolt-Börnstein Semiconductors, edited by O. Madelung, U. Rössler, and M. Schulz (Springer-Verlag, Berlin, Heidelberg, New York, 2002), Vol. 41.
- (22) L. Levien, C. T. Prewitt, and D. Weidner, Am. Mineral. 65, 920 (1980).
- (23) R. J. Hill, M. D. Newton, and G. V. Gibbs, J. Solid State Chem. 47, 185 (1983).
- (24) Z. Mursic, T. Vogt, H. Boysen, and F. Frey, J. Appl. Crystallogr. 25, 519 (1992).
- (25) B. Li, K. Woody, and J. Kung, J. Geophys. Res. 111, B11206 (2006).
- (26) N. W. Ashcroft and N. D. Mermin, Solid State Physics (Saunders College, Philadelphia, 1976).
- (27) W. G. Wyckoff, Crystal Structures, 4th ed. (Interscience, New York, 1974).
- (28) For the sake of brevity, the calculated Born effective charge tensors are not reported here. In fact, we found that the XC functionals provide very similar results.
- (29) G. Dolling, in Inelastic Scattering of Neutrons in Solids and Liquids, edited by S. Ekland (IAEA, Vienna, 1963), Vol. II, p. 37.
- (30) F. Gervais and B. Piriou, Phys. Rev. B 11, 3944 (1975).
- (31) E. K. Zakharova, V. G. Zubov, and L. P. Osipova, Kristallografiya 19, 788 (1974) [Sov. Phys. Crystallogr. 19, 489(1975)].
- (32) M. F. Vigasina, E. V. Guseva, and R. Y. Orlov, Sov. Phys. Solid State 31, 747 (1989).
- (33) A. M. Hofmeister, J. Xu, and S. Akimoto, Am. Mineral. 75, 951 (1990).
- (34) P. Dawson, M. M. Hargreave, and G. R. Wilkinson, J. Phys. C: Solid State Phys. 4, 240 (1971).
- (35) M. J. L. Sangster, G. Peckham, and D. H. Saunderson, J. Phys. C. 3, 1026 (1970).
- (36) G. Nilsson and G. Nelin, Phys. Rev. B 6, 3777 (1972).
- (37) B. Dorner, H. Grimm, and H. Rzany, J. Phys. C 13, 6607 (1980)
- (38) D. Strauch and B. Dorner, J. Phys. Condens. Matter 5, 6149 (1993).
- (39) H. Schober et al., J. Phys. Condens. Matter 5, 6155 (1993).
- (40) A. Bosak et al., Geophys. Res. Lett. 36, L19309 (2009).
- (41) R. Mittal, S. L. Chaplot, M. N. Rao, N. Choudhury, and R. Parthasarthy, Physica B 241, 403 (1998).
- (42) R. Mittal, S. L. Chaplot, R. Parthasarathy, M. J. Bull, and M. J. Harris, Phys. Rev. B 62, 12089 (2000).
- (43) S. L. Chaplot, L. Pintschovius, N. Choudhury, and R. Mittal, Phys. Rev. B 73, 094308 (2006).
- (44) E. C. Svensson, B. N. Brockhouse, and J. M. Rowe, Phys. Rev. 155, 619 (1967).
- (45) R. M. Nicklow, G. Gilat, H. G. Smith, L. J. Raubenheimer†, and M. K. Wilkinson, Phys. Rev. 164, 922 (1967).
- (46) S. Ganesan, Philos. Mag. 7, 197 (1962).
- (47) H. Ledbetter, Int. J. Thermophys. 12, 637 (1991).
- (48) J. G. Collins, Philos. Mag. 8, 323 (1963).
- (49) K. A. Gschneider, Jr., in Solid State Physics, edited by F. Seitz and D. Turnbull (Academic, New York, 1964), Vol. 16, p. 275.
- (50) C. Lee and X. Gonze, Phys. Rev. B 51, 8610 (1995).
- (51) M. W. Chase, NIST-JANAF Thermochemical Tables, (American Institute of Physics, Woodbury, NY, 1998).
- (52) O. Kubaschewski, C. B. Alcock, and P. J. Spencer, in Materials Thermochemistry, 6th ed. (Pergamon, New York, 1993), Chap. 5, pp. 257–323.
- (53) W. Yong, E. Dachs, A. Benisek, and R. A. Secco, Phys Chem Minerals 39, 153 (2012).
- (54) Given the good agreement between the calculated and experimental phonon bandstructures, we suspect a problem with the experimental measurement.
- (55) S. Lany, Phys. Rev. B 78, 245207 (2008)
- (56) G. Hautier, S. P. Ong, A. Jain, C. J. Moore, G. Ceder Phys. Rev. B 85, 155208 (2012)
- (57) F. Birch, Phys. Rev. 71, 809 (1947).
- (58) O. Anderson and K. Zou, J. Phys. Chem. Ref. Data 19, 69 (1990).
- (59) R. R. Reeber, K. Goessel, and K. Wang, Eur. J. Mineral. 7, 1039 (1995).
- (60) G. Fiquet, D. Andrault, J. P. Itié, P. Gillet, and P. Richet, Phys. Earth Planet. Inter. 95, 1 (1996).
- (61) L. S. Dubrovinsky and S. K. Saxena, Phys. Chem. Miner. 24, 547 (1997).
- (62) S. V. Sinogeikin, J. M. Jackson, B. O’Neill, J. W. Palko, and J. D. Bass, Rev. Sci. Instrum. 71, 201 (2000).
- (63) Y. A. Chang and R. Hultgren, J. Phys. Chem. 69, 4161 (1965).
- (64) American Institute of Physics Handbook, 3rd ed., edited by E. D. Gray (McGraw-Hill, New York, 1982).
- (65) A. Otero-de-la-Roza and V. Luaña, Phys. Rev. B 84, 024109 (2011).
- (66) D. Zhang and J.-X. Sun, Chinese Phys. B 21 080508 (2012).
- (67) E. E. Russel and E. E. Bell, J. Opt. Soc. Am. 57, 341 (1967).
- (68) S. M. Stishov and S. V. Popova, Geokhimiya 10, 837 (1961).
- (69) F. Gervais, B. Piriou, and F. Cabannes, J. Phys. Chem. Solids 34, 1785 (1973).
- (70) C. Pecharromán, M. Ocaña, P. Tartaj, and C. J. Serna, Mater. Res. Bull. 29, 417 (1994).
- (71) T. Sun, P. B. Allen, D. G. Stahnke, S. D. Jacobsen, and C. C. Homes, Phys. Rev. B 77, 134303 (2008).
- (72) For high frequency modes, the relative errors with respect to experiments and the relative difference from one functional to another can be enormous due to the small absolute values of the contributions. This is the case of in -quartz, for example.
- (73) A. Filippetti and N. A. Spaldin, Phys. Rev. B 68, 045111 (2003).