The Innermost Regions of Relativistic Jets and Their Magnetic Fields
First Results from NuSTAR Observations of Mkn 421
Abstract
Mkn 421 is a nearby active galactic nucleus dominated at all wavelengths by a very broad non-thermal continuum thought to arise from a relativistic jet seen at a small angle to the line of sight. Its spectral energy distribution peaks in the X-ray and TeV -ray bands, where the energy output is dominated by cooling of high-energy electrons in the jet. In order to study the electron distribution and its evolution, we carried out a dedicated multi-wavelength campaign, including extensive observations by the recently launched highly sensitive hard X-ray telescope NuSTAR, between December 2012 and May 2013. Here we present some initial results based on NuSTAR data from January through March 2013, as well as calibration observations conducted in 2012. Although the observations cover some of the faintest hard X-ray flux states ever observed for Mkn 421, the sensitivity is high enough to resolve intra-day spectral variability. We find that in this low state the dominant flux variations are smooth on timescales of hours, with typical intra-hour variations of %. We do not find evidence for either a cutoff in the hard X-ray spectrum, or a rise towards a high-energy component, but rather that at low flux the spectrum assumes a power law shape with a photon index of approximately 3. The spectrum is found to harden with increasing brightness.
1 Introduction
Mkn 421 is one of the nearest and best-studied blazars – active galactic nuclei (AGN) whose relativistic jet is oriented almost directly along our line of sight. Like the other AGN of this type, Mkn 421 shows a flat radio spectrum, optical polarization, rapid and correlated variability, and other characteristics of relativistically beamed AGN. Its energy output shows the usual two peaks, located respectively in the X-ray and TeV -ray bands, which is typical for the high-peaked BL Lac (HBL) class urry+padovani-1995 . Its proximity and brightness in many spectral bands make it an important object to study in the context of AGN jet physics.
The non-thermal and polarized continuum observed in HBL objects from the radio to the X-ray suggests that this part of the spectral energy distribution (SED) is due to electron synchrotron radiation. The -ray part of the SED is likely due to the inverse Compton scattering by the same electrons responsible for the synchrotron radiation, and the seed photons are most likely the synchrotron photons internal to the jet. This scenario is the basis of the so-called Synchrotron Self-Compton (SSC) model, which has been successfully invoked to explain the complete SED of the BL Lac class of objects; see e.g. ulrich+1997 ; tavecchio+2010 . In the context of the SSC model, the variability in X-rays and high-energy -rays is expected to be high and correlated since they are produced by the same high-energy electrons. The time scales for energy loss of those electrons are very short, in agreement with the variability amplitude observed in Mkn 421 (spanning approximately two orders of magnitude) and rapid intra-day variability observed during epochs of high activity; see e.g. tanihata+2003 ; fossati+2008 .
In order to provide insight into the radiative processes, the distribution of radiating particles, constraints on the particle acceleration, and thus the structure of the relativistic jet, we conducted a multi-wavelength study of Mkn 421 focused on the X-ray and TeV -ray bands. Coordinated simultaneous observations were carried out from December 2012 to May 2013 with the MAGIC and VERITAS ground-based Cherenkov-telescope arrays, and the Swift and NuSTAR orbiting X-ray observatories. The campaign was supported by coordinated (but not necessarily simultaneous) observations by ground-based optical, infrared and radio observatories, and the orbiting Fermi -ray observatory. In this report we present a preliminary analysis of the NuSTAR data from January through March 2013.
NuSTAR (Nuclear Spectroscopic Telescope Array) is a hard X-ray (3–79 keV) observatory launched into low Earth orbit in June 2012 harrison+2013 . It features the first focusing X-ray telescope to extend high sensitivity beyond the 10 keV cutoff shared by all currently active focusing soft X-ray telescopes. The inherently low background associated with concentrating the X-ray light enables NuSTAR to achieve approximately a one-hundred-fold improvement in sensitivity over the collimated or coded-mask instruments that operate, or have operated, in the same spectral range. Part of the NuSTAR primary mission is aimed at advancing our understanding of astrophysical jets through observations of archetypal blazars, such as Mkn 421, with unprecedented spectral and temporal resolution in the underexplored hard X-ray band.
2 NuSTAR Observations
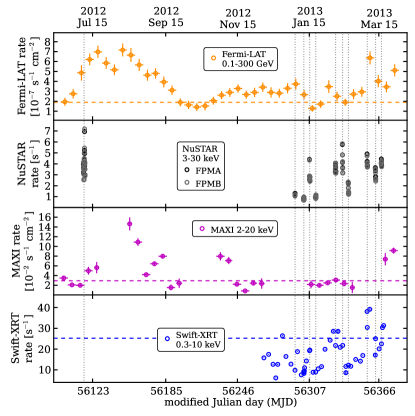
In order to maximize the strictly simultaneous overlap of observations by NuSTAR and ground-based TeV -ray observatories during the dedicated campaign, the observation times were arranged according to visibility of Mkn 421 at the MAGIC and VERITAS sites. Coordinated observations in 2013 were performed on January 10, 15 and 20, February 6, 12 and 17, and March 5, 12 and 17. A typical NuSTAR observation spanned 10 hours, resulting in 15–20 ks of source exposure after accounting for orbital modulation of visibility and intervals of high background radiation. In addition to these dates, NuSTAR observed Mkn 421 for pointing calibration on 2012 July 7 and 8 (70 ks in total111Due to sub-optimal pointing, the count rates for this observation have increased systematic uncertainties, estimated to be %.) and on 2013 January 2 (10 ks). The data were reduced using the standard NuSTARDAS pipeline222http://heasarc.gsfc.nasa.gov/docs/nustar/analysis/ nustar_swguide.pdf, version 1.2.0. Figure 1 shows the observations listed above with publicly available light curves in X-ray swift-public ; maxi-public and GeV -ray bands fermi-public in order to provide a broader context.
3 Analysis of Flux Variability
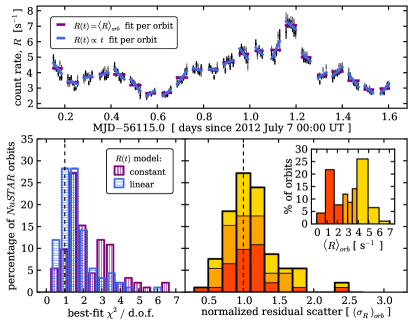
The variations in count rate between the NuSTAR observations, and the range covered in each observation alone, are entirely dominated by the intrinsic variability of the target, i.e. they are in clear excess of the observational uncertainties. For example, the calibration observation taken in July 2012 shows flux variability of up to 30% within an hour and a distinct increase in which the rate doubled in a roughly linear fashion over a 12-hour period (see upper panel of Figure 2). We note that it coincided with highly increased activity in the GeV -ray band observed by Fermi-LAT fermiflare-2012 , but we lack sufficient X-ray coverage to physically relate these two events. The MAXI light curve shown in Figure 1 suggests that the peak of the X-ray emission occured between mid-July and mid-August 2012, after the NuSTAR observation.
The campaign observations up to the end of March 2013 have covered relatively low flux states of Mkn 421, even though the lowest and the highest observed fluxes span approximately an order of magnitude. Modest count rates are apparent from both MAXI and Swift-XRT data in comparison with long-baseline light curves and the intense flaring episodes covered in the literature, e.g. tramacere+2009 . Very high fluxes in X-ray and -ray bands have been observed later in the campaign, peaking in mid-April 2013 atel1 ; atel2 ; atel3 . The data from this flaring period will be presented in a dedicated publication.
With the possible exception of the lowest-flux states, the observed count rates are not consistent with being constant during any of the observations – as demonstrated by light curves in Figures 1 and 2. In order to quantify the variability on timescales shorter than the observations, we divide the data into individual NuSTAR orbits, as they represent the most natural, although somewhat arbitrary, way of partitioning the data. The orbits are approximately 90 minutes long and contain up to 50 minutes of source exposure. We treat each orbit independently and fit two simple light curve models to the observed count rate in each one: a constant rate during an orbit, , and a linear trend in time, . We examine the count rate in the 3–30 keV band, where the background contribution is negligible. The top panel of Figure 2 provides an example of the two models fitted to the July 2012 data binned to 10-minute time intervals.
The lower panels of Figure 2 show the results of the fitting procedure performed on all orbits. We find that the majority of orbits are better described by a linear trend than a constant one. Linear trends account for most of the orbit-to-orbit variability and approximate smooth variations on super-orbital timescales of a few hours. On a 10-minute timescale, the variability amplitude typically does not exceed the observational count rate uncertainty of approximately 3%. Based on the mildly overpopulated tail of the d.o.f. distribution for the linear trend fits, we estimate that up to 20% of orbits show excess variance beyond the simple linear trend. Subtracting the trend and comparing the residual scatter to the median rate uncertainty within each orbit, , gives a distribution slightly skewed towards values greater than unity (see lower right panel of Figure 2). This is consistent with intrinsic sub-orbital variability on a 10-minute timescale in 20% of orbits. We find no evidence for an increase in variability with flux.
4 Spectral Analysis
For spectral analysis we use spectra grouped to a minimum of 20 photons per bin and perform the modeling in Xspec version 12.8.0. The spectra of all NuSTAR observations of Mkn 421 are above the background level at least up to 25 keV and up to 40 keV in high-flux observations. The dominant background component above 25 keV is internal instrument background. With good background characterization the spectra may be used up to the high-energy end of the NuSTAR band at 79 keV.
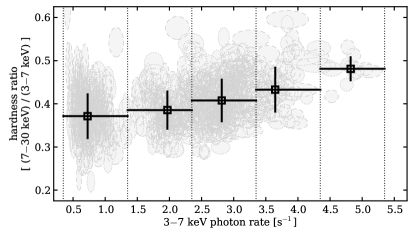
We initially model the X-ray spectrum as a simple power law, , where is the photon index. The model includes fixed Galactic absorption ( cm-2) and the redshift of Mkn 421 (). Fitting all full-observation spectra with a power law model and find that: i) the mean photon index, , is ; ii) the observations with higher mean flux systematically prefer values of lower than ; iii) the observations with lower mean flux systematically prefer values of higher than ; and iv) the best-fit increases with flux, owing to curvature apparent in the higher-flux spectra. These trends are entirely consistent with the observed hardening as the source brightens, shown in Figure 3. The modeling implies that a power law fits the low-flux spectra well. However, the curvature and the consequent poorer fits of the power law model at high flux may either be intrinsic or simply an effect of superposition of spectra with a range of different photon indices. These two possibilities can be resolved with a more complicated spectral model and time-resolved analysis.
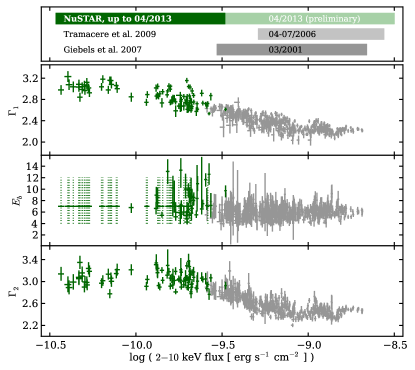
We therefore replace the power law with a purely phenomenological broken power law model: up to the break energy , and at higher energies. By fitting spectra of each orbit individually, we partially mitigate time-averaging, as each orbit covers a relatively narrow flux range. The broken power law model provides better fits to the spectra of high-flux orbits, indicating that the curvature is intrinsic. It is, however, degenerate for low-flux orbits as both photon indices coverge to for any value of the break energy in the 4–12 keV range. In those cases we fix to 7 keV, which is the median best-fit value for the full-observation spectra.
We find evidence that the low-energy photon index () strongly varies with flux, while the flux dependence of the high-energy index () is weaker in the flux range of the data presented here. The break energy is difficult to constrain since for many orbits the uncertainties in the best-fit value reach below the low-energy end of the NuSTAR band at 3 keV, effectively causing to become unbound by data. In Figure 4 we show the best-fit parameters , and as functions of 2–10 keV flux for all NuSTAR orbits up to the end of March 2013. The equivalent results from giebels+2007 are plotted for comparison, demonstrating that the spectral trends found in the NuSTAR data smoothly continue into the previously accessible flaring regime, now covering nearly two orders of magnitude in flux.
5 Summary and Conclusion
The data and the analysis presented here are preliminary, but indicative of the new results uncovered by NuSTAR in the hard X-ray band. Its high sensitivity enabled probing the flux state significantly fainter than previously possible with comparable spectral and temporal resolution. The observed variability ranges over an order of magnitude, including instances of flux-doubling over a half-day period and occasional variability on 10-minute timescales. In this low-flux regime we find that the hard X-ray spectrum does not cut off steeply, nor show any sign of an increase towards the inverse-Compton component of the SED, but rather saturates at . The spectrum hardens with an increase in flux, which can be phenomenologically described with a broken power law model: the break energy keV separates the soft and the hard power law slopes, both of which change with flux. This can be understood in terms of acceleration and cooling processes of radiating particles in the Mkn 421 jet, and the resulting shape of the high-energy tail of the relativistic electron energy distribution. These results, together with a broader analysis of the multi-wavelength data more physical modeling, will be presented in more detail in a paper currently in preparation.
References
- (1) Urry, C. M. & Padovani, P., PASP, 107, 803 (1995)
- (2) Ulrich, M.-H., et al., ARA&A, 35, 445 (1997)
- (3) Tavecchio, F., et al., MNRAS, 401, 1570 (2010)
- (4) Tanihata, C., et al., ApJ, 584, 183 (2003)
- (5) Fossati, G., et al., ApJ, 677, 906 (2008)
- (6) Harrison, F. A., et al., ApJ, 770, 103 (2013)
- (7) Stroh, M. C. & Falcone, A. D., ApJS, 207, 28 (2013)
- (8) Matsuoka, M., et al., PASJ, 61, 999 (2009)
- (9) Fermi-LAT Monitored Sources List
- (10) D’Ammando, F., et al., ATel #4261 (2012)
- (11) Tramacere, A., et al., A&A, 501, 879 (2009)
- (12) Baloković, M., et al., ATel #4974 (2013)
- (13) Cortina, J., et al., ATel #4976 (2013)
- (14) Paneque, D., et al., ATel #4977 (2013)
- (15) Giebels, B., et al., A&A, 462, 29 (2007)