17P/Holmes: Contrast in activity between before and after the 2007 outburst
Abstract
A Jupiter-family comet, 17P/Holmes, underwent outbursts in 1892 and 2007. In particular, the 2007 outburst is known as the greatest outburst over the past century. However, little is known about the activity before the outburst because it was unpredicted. In addition, the time evolution of the nuclear physical status has not been systematically studied. Here we study the activity of 17P/Holmes before and after the 2007 outburst through optical and mid-infrared observations. We found that the nucleus highly depleted its near-surface icy component before but became activated after the 2007 outburst. Assuming a conventional 1-µm-sized grain model, we derived a surface fractional active area of before the outburst whereas it was enlarged by a factor of 50 after the 2007 outburst. We also found that large (1 mm) particles could be dominant in the dust tail observed around aphelion. Based on the size of the particles, the dust production rate was 170 kg s-1 at the heliocentric distance AU, suggesting that the nucleus still held active status around the aphelion passage. The nucleus color was similar to that of the dust particles and average for a Jupiter-family comet but different from most Kuiper Belt objects, implying that the color may be inherent to icy bodies in the solar system. On the basis of these results, we concluded that more than 76 m surface materials were blown off by the 2007 outburst.
1 INTRODUCTION
17P/Holmes is a distinguished comet because of its spectacular outbursts in 1892 and 2007. There is no other known comet that has exhibited such large-scale outbursts. However, its size and orbit are typical among Jupiter-family comets: 17P/Holmes has a radius of 1.62–1.71 km (Snodgrass et al., 2006; Lamy et al., 2004) and orbital elements typical of the Jupiter-family comets (e.g., a Tisserand parameter with respect to Jupiter of 2.86) and most probably originated from the trans-Neptunian region (Levison & Duncan, 1997). It passed through perihelion at 2.05 AU on 4.5 May 2007 and suddenly outbursted on 23 October 2007 at 2.44 AU from the Sun in its outbound orbit.
Soon after the outburst, intensive research was conducted to characterize its physical and chemical properties. The optical magnitude data were compiled and the onset time of the outburst was estimated to be 23.7 October (Sekanina, 2008, 2009). Later, Hsieh et al. (2010) updated the onset time to October based on observations obtained with SuperWASP-North. Sekanina (2008) deduced the duration of the active phase of the outburst to be days. In contrast, Altenhoff et al. (2009) indicated that the nucleus was activated by the outburst and its activity continued for over 30 days. Small grains were dominant near the nucleus after the outburst whereas large grains were dominant gradually, probably because small grains were kicked out by solar radiation pressure (Zubko et al., 2011). The mineralogical properties of the dust grains were studied by mid-infrared spectroscopy. It is found that the infrared spectrum of the diffuse emission can be explained by a mixture of amorphous and crystalline silicate materials as observed in most comets (Watanabe et al., 2009; Reach et al., 2010). Total ejecta mass was estimated to be 1010–1013 kg (Montalto et al., 2008; Altenhoff et al., 2009; Reach et al., 2010; Ishiguro et al., 2010; Boissier et al., 2012). More than a 2-m-thick surface layer could be blown off by the initial event although this is strongly dependent on the size distribution and maximum size of the dust particles (Ishiguro et al., 2010). Cometary fragments were also found by optical wide-field imaging. Stevenson et al. (2010) detected 16 fragments having a maximum effective size of 10–100 m. The evidence of decameter-sized fragments may suggest that 10 m surface layer could be excavated by the outburst. Yang et al. (2009) detected two absorption features at 2 and 3 µm and suggested that the 17P/Holmes cloud contained a significant fraction of pure water ice.
It is unlikely that the outburst was triggered by an impact of a small object not only because the probability is incredibly low (Ishiguro et al., 2010) but also because of evidence that multiple-outbursts occurred on the same comet in 1892 (Barnard, 1896; Sekanina, 2008). Several possible scenarios have been presented to explain the cause of the outburst; these include vaporization of pockets of more volatile ices such as CO2 and CO (Schleicher, 2009; Kossacki & Szutowicz, 2011), the phase change of water from amorphous to crystalline ice (Sekanina, 2009), thermal stress in the nucleus, or the polymerization of hydrogen cyanide (Gronkowski & Sacharczuk, 2010). So far, according to our present knowledge of the physical and chemical structure of comets, CO inclusions are likely to be the most probable cause of Comet 17P/Holmes’s outburst (Kossacki & Szutowicz, 2010, 2011; Gronkowski & Sacharczuk, 2010).
Despite the intensive observations soon after the explosion, however, little is known about the change in activity between before and after the outburst. It is important to know the nucleus’s pre-outburst physical state and how the nuclear surface changed through the outburst. We found a unique pre-outburst data of 17P/Holmes serendipitously obtained by AKARI, an infrared astronomy satellite, two months before the 2007 outburst. In addition, we performed optical imaging over 3 years to monitor the long-term variation of the comet’s appearance and magnitude. From our results, we confirmed that the comet was observed in a dormant state before the 2007 outburst when it was near perihelion whereas it had been active after the outburst even beyond 5 AU, exhibiting a wide-spread dust tail. We describe the observations and data reduction in Section 2, and the observational results are presented in Section 3.
2 OBSERVATIONS AND DATA REDUCTION
The data presented in this paper were taken with four ground-based telescopes and one space infrared telescope: the Nishi-Harima Astronomical Observatory (NHAO) NAYUTA 2.0-m telescope (hereafter NHAO), the University of Hawaii 2.2-m telescope (UH2.2m), the Indian Institute of Astrophysics 2.0-m Himalayan Chandra telescope (HCT), the Subaru 8.2-m telescope (Subaru), and the AKARI space infrared telescope. In addition, we made use of data from the SMOKA archive, which is operated by the Astronomy Data Center, National Astronomical Observatory of Japan. All optical data were taken more than one year after the outburst when the comet was located at a heliocentric distance of 3.84 5.17 AU. The infrared data from AKARI were obtained before the 2007 outburst when the comet was at AU. A list of the observations is given in Table 1. Details of the data acquisition and reductions are given in the following.
2.1 NHAO OBSERVATIONS IN DECEMBER 2008 AND JANUARY 2010
The Nishi-Harima Astronomical Observatory (134°20′08″E, 35°01′31″N, 449 m) is a public astronomical observatory that conducts public relations activities. Our observations were conducted as a part of the NHAO @site program, which was contrived as a means of public outreach to introduce visitors into cutting-edge astronomy through research experiences (Sakamoto, 2008). We thus made observations with the @site program participants. We employed MINT, a N2-cooled optical CCD camera mounted on the f/12 Cassegrain focal plane with a focal reducer and -band filter. In this configuration, the pixel size on the sky was 0.276″, so that the field of view was . The observations of 17P/Holmes were made using non-sidereal tracking on 23 and 26 December 2008 and 16 January 2010 under photometric conditions. The average seeing size was 1.9″ on 23 December 2008, 2.0″ on 27 December 2008, and 1.6″ on 16 January 2010, respectively.
2.2 HCT OBSERVATION ON 29–30 MARCH 2011
The 2.0-m Ritchey-Chretien Himalayan Chandra Telescope is located in Hanle, India (78°57′51″E, 32°46′46″N, 4500 m), a high-altitude area in the Himalayan region. It is operated by the Indian Institute of Astrophysics (IIA). We made observation on 29 March 2011 with the Himalaya Faint Object Spectrograph (HFOSC) pixel CCD camera at the f/9 Cassegrain focus of the telescope. The telescope was controlled via a satellite from the CREST campus near Bangalore. Half of the imaging area of HFOSC was sampled so that the effective field of view was with a pixel scale of 0.296″. We made observation with an -band filter on the first night while without filter on the second night. The observation was performed under photometric conditions. Point sources on the images were spread out to 2.6″ probably because of inadequate adjustment of the focus position or vibration of the telescope by strong winds.
2.3 SUBARU OBSERVATIONS ON 7 JANUARY AND 5 JUNE 2011
Subaru is an 8.2-meter optical-infrared telescope at the summit of Mauna Kea, Hawaii, operated by the National Astronomical Observatory of Japan (NAOJ), National Institutes of Natural Sciences. We carried out the observation of 17P/Holmes with the wide-field camera Suprime-Cam (Miyazaki et al., 2002) attached to the prime focus of the 8.2-m Subaru Telescope for two nights on 7 January 2011 and 5 June 2011. The camera has a field of view with ten CCDs, whose pixel size is 0.20″. Since there are gaps of a few arcseconds (over ten arcseconds between the CCD chips), we dithered the telescope to make up for the gap areas. Five dithering modes were applied for one complete set of images. We took images with an -band filter on 7 January 2011 and with g′-, r′-, and i′-band filters on 9 June 2011. These observations were carried out in a non-sidereal tracking mode. The seeing size was 0.6″–0.8″. The weather was variable during the first run on 7 January 2011 and photometric conditions prevailed during the second run on 5 June 2011.
2.4 UH2.2m OBSERVATION ON 4–5 FEBRUARY 2011
The University of Hawaii 2.2-m observation was made for two nights on 4–5 February 2011. We used a Tek2k and a Kron-Cousins -band filter. The individual frames were taken in non-sidereal tracking mode. The CCD was used in binned mode on 4 February and binned mode on 5 February. The instrument provides a field of view and a pixel resolution of 0.22″ (in binned mode) and 0.44″ (in binned mode). At the time of the observation, the seeing size was 1.0″. The weather conditions for these two nights were photometric.
2.5 AKARI ALL-SKY SURVEY
AKARI (which was originally called ASTRO-F), launched on 21 February 2006 UT, is a Japanese infrared space telescope used to carry out an all-sky survey and pointed observations. It orbits at an altitude of 700 km in a Sun-synchronous polar orbit along the boundary between night and day sides. The boresight vector of the telescope is pointed at the solar elongation angle around 90° to suppress the incident thermal flux from the Earth and the Sun. AKARI consists of a bus module and a science module. The science module consists of a cryogenically cooled telescope of 68.5 cm aperture in diameter and two focal-plane instruments, the Far-Infrared Surveyor (FIS) (Kawada et al., 2007) and the Infrared Camera (IRC) (Onaka et al., 2007). Detailed descriptions on the design and operation of AKARI have appeared in Murakami et al. (2007). The all-sky survey, conducted between 8 May 2006 and 26 August 2007, is the major task of the AKARI project and the first half of the mission period is dedicated to it. 17P/Holmes was serendipitously detected with the longer channel of MIR in L18W (13.9–25.3 m) twice on 23 August 2007.
2.6 DATA REDUCTION
The observed optical raw data were reduced in the standard manner using bias (zero exposure) frames recorded at intervals throughout the nights plus skyflat data. The data were analyzed using SDFRED2 for the Subaru data (Ouchi et al., 2004) and IRAF for the other data. Flux calibration was done using standard stars in the Landolt catalog (Landolt, 1992, 2009) or field stars listed in the USNO–B1.0 catalog (Monet et al., 2003). To convert pixel coordinates into celestial coordinates, we employed the imcoords package in IRAF or WCSTools.
To find the faint dust cloud structure, star-subtracted composite images were produced in a method described in Ishiguro et al. (2007) and Ishiguro (2008). We first made images to align the stars to detect faint stars and galaxies. We masked the identified objects using 3seeing-size circular masks. We also masked pixels identified as bad in the bias (hot pixels) and flat-fielding images (pixels whose sensitivity was 5% higher or lower than the average). We combined the masked images with offsets to align 17P/Holmes, excluding the masked pixels and shifting the background intensity to zero. Since the comet moved relative to the stars, it was possible to exclude nearly all masked pixels in the resultant composite image.
The AKARI infrared images was constructed in the same manner as described in Ishihara et al. (2010). The reduction pipeline process includes a reset anomaly correction, a linearity and flat correction, and internal stray light removal. We applied the conversion factor of 4.3 MJy/sr/ADU in L18W (D. Ishihara 2012, private communication).
3 RESULTS AND DISCUSSION
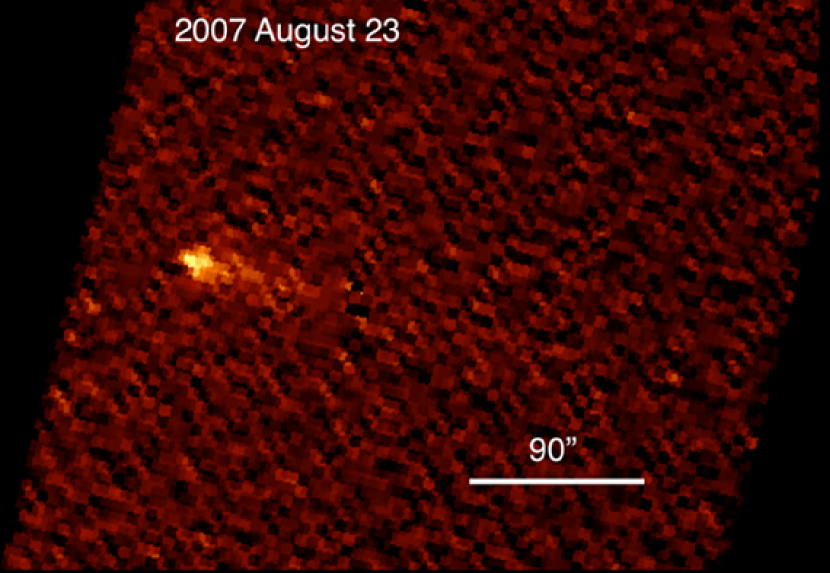
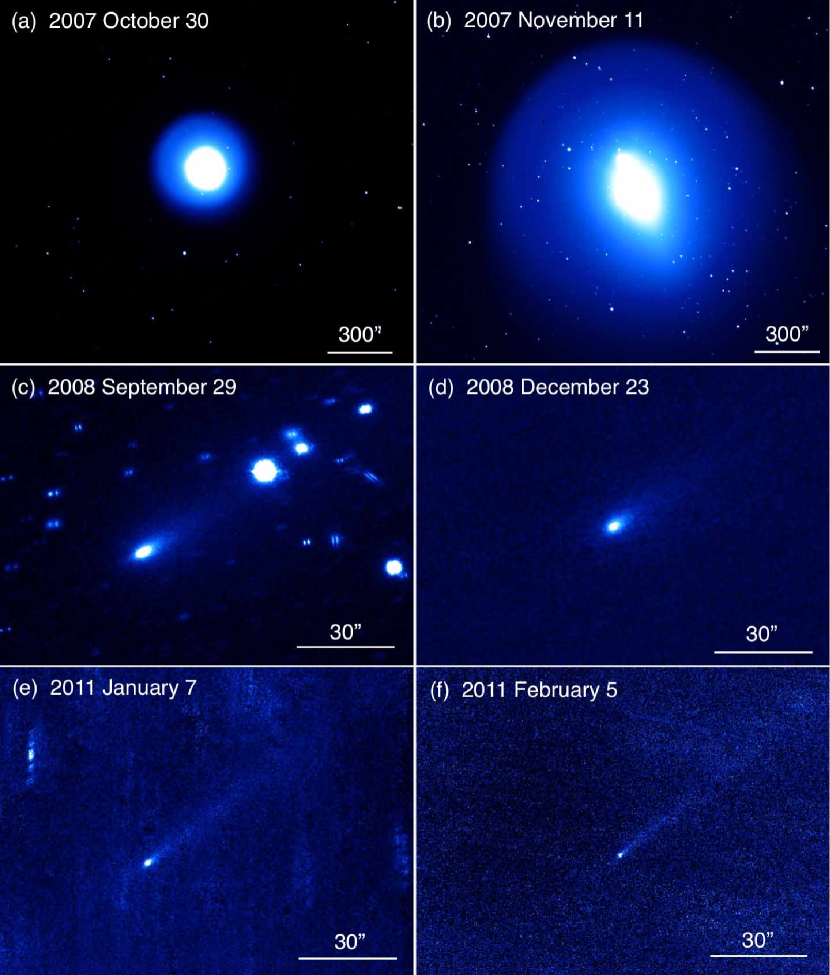
Figure 1 shows the pre-outburst mid-infrared image of 17P/Holmes taken with AKARI on 23 August 2007. It consists of a near-nuclear dust coma and a faint tail extended toward the southwest. Figure 2 shows the time-series post-outburst optical images of 17P/Holmes between 30 October 2007 and 5 February 2011. For reference, images taken soon after the initial outburst are shown in Figures 2(a) and (b); these were acquired with the Kiso observatory 1.05-m Schmidt telescope and archived at SMOKA. The dust cloud was initially observed as nearly spherical with respect to the position of the nucleus (Figure 2(a)), and gradually it stretched toward the southwest (Figure 2(b)). As it expanded, the inner coma becomes faint and pointlike (Figures 2(c)–(f)). Among these images, Figure 2(e) is the most sensitive among all of our data. Using the composite images with offset to align stars, we estimated a detection limit of 26.7 mag in Figure 2(e). Because there is no detectable fragment in the image, we put the upper limit of the fragment radius at 400 m. It is important to notice that all images in Figure 2 show the dust tail. Obviously, 17P/Holmes possessed a dust tail even when it was located around aphelion at 5.2 AU (Figures 2(e)–(f)). However, a pre-outburst observation on 3 May and 3 June 3 2005 revealed no comet-like coma at a heliocentric distance of AU (Snodgrass et al., 2006). This fact may suggest that an inactive dust layer was excavated by the outburst and fresh materials of icy composition were exposed on the surface at the time of our observations. In the following subsections, we provide a quantitative analysis of the activities.
3.1 RADIAL PROFILES
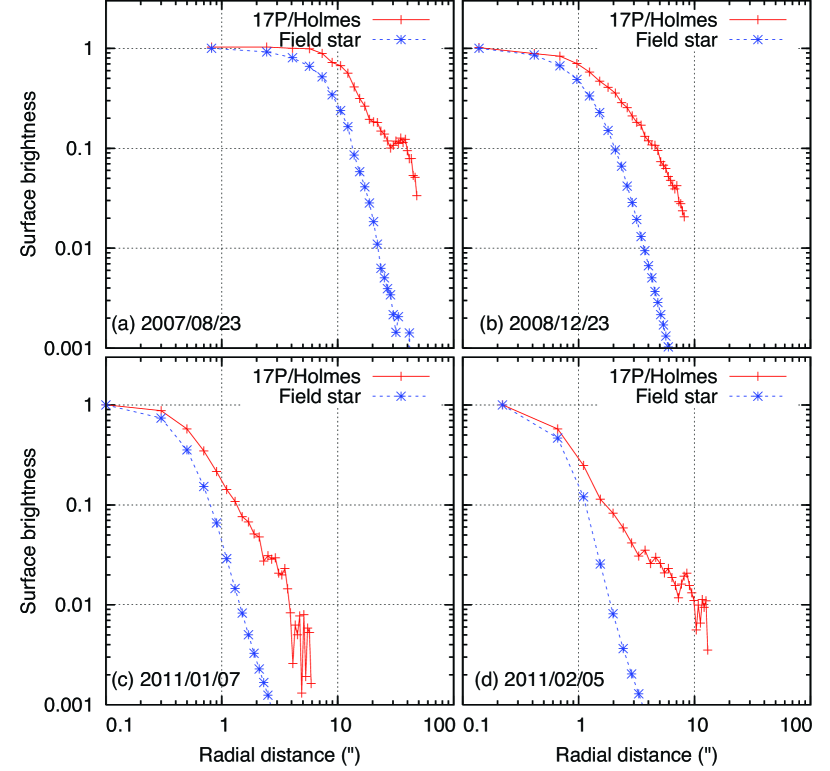
We examined radial brightness profiles of the near-nuclear light source to confirm the activity. We prepared these profiles using AKARI data on 23 August 2007, NHAO data on 23 December 2008, UH2.2m data in February 2011 and Subaru data in January 2011 and compared them with the point spread function (PSF) determined by stars and asteroids (Figure 3). Because the image was taken in non-sidereal tracking mode in the optical, field stars were usually stretched out in the comet’s images. Infrared data were taken with short exposure time (1 s), so both the comet and background stellar objects remained stationary in the observed data. Among the profiles in Figure 3, the Subaru data on 7 January 2011 is the best for the comparison because we set the individual exposure time of 40 s, which is too short for the field stars to be elongated in the non-sidereal tracking mode. In fact, the stars can be extended no longer than 0.1″ in Subaru data on 7 January 2011. For the AKARI data, we used the PSF of the average profiles of stars and asteroids in the same scan pass. We determined the PSF of the other data using images before or after the comet observations. They were usually taken with short exposure times to confirm the position of 17P/Holmes after the pointing of the telescopes. Therefore, there may be uncertainty in the time variation of the PSFs in NHAO data on 23 December 2008 and UH2.2m data in February 2011 (Figures 3(b) and (d)), but probably the variations were 0.3″, which is typical at these observational sites.
In Figure 3, one can see that the surface brightness profiles of 17P/Holmes were broader than those of point sources at 0.2″–1″ from the photometric center. Hence we consider the epoch of the dust emission that is responsible for the broadening of the radial brightness profiles. The expansion dust speed has been studied in much of the literature. It depends on how dust particles are coupled with the expanding gas molecules, the expansion velocity of gas molecules, the gas-to-dust mass ratio, and so on. Surface orography and its inhomogeneities also play a significant role in the terminal velocity of the grains (Crifo & Rodionov, 1997). Although there are many factors to determine the expansion dust speed, it can be approximated by a simple power-law function of the size and the heliocentric distance, that is, , where denotes the radius of dust particles in micron. is a constant, typically in the range of m s-1 based on theoretical studies (Whipple, 1951; Ip & Mendis, 1974), past observations of normal comet activities (Lisse et al., 1998; Ishiguro et al., 2007; Sarugaku et al., 2007; Snodgrass et al., 2008; Ishiguro, 2008), and cometary outbursts including the 17P/Holmes event in 2007 (Sekanina, 2008; Montalto et al., 2008; Moreno et al., 2008; Hsieh et al., 2010; Sarugaku et al., 2010; Reach et al., 2010; Stevenson & Jewitt, 2012). From the equation for the expanding speed, dust particles could escape from a region of 1″ aperture in 1.4–22 hours for µm and 6–94 days for cm particles. Since our postburst data were taken 342 days after the outburst, we can conjecture that the near-nuclear dust particles were not the remnant of the particles ejected by the 2007 outburst. We discussed the staying time of the dust particles in 0.2″–1″ aperture using a sophisticated dynamical model (Appendix A), but both model results are consistent with each other in that the near-nuclear dust particles were not the remnant of 2007 outburst.
3.2 PHOTOMETRY OF THE INNER DUST COMA
We next deduced the dust coma magnitude as a function of time and heliocentric distance. Photometry was performed using the APPHOT package in IRAF, which provides the magnitude within synthetic circular apertures projected onto the sky. Since the seeing disk sizes were different each night at each observatory, we set the flexible aperture radius to 1.75″–6.50″, which corresponds to 2.5 times the full width at half maximum (FWHM). The sky background was determined within a concentric annulus having projected inner and outer radii and of point objects, respectively. The observed -band magnitudes, , are summarized in Table 2. The absolute magnitude, the magnitude at a hypothetical point at unit heliocentric distance and observer’s distance, and at zero solar phase angle (Sun–object–observer’s angle), is given by
| (1) |
where is the observer’s distance in AU and is the solar phase angle in degree. The empirical scattering phase function, , is given by the following equation (Lamy et al., 2004):
| (2) |
where characterizes the phase slope. mag deg-1 has been commonly assumed for cometary nuclei (Lamy et al., 2004; Snodgrass et al., 2006). Alternatively, the phase function of active comets is given based on observations of 1P/Halley given by Schleicher et al. (1998), Li et al. (2011), and Stevenson & Jewitt (2012),
| (3) |
We found that these different phase functions result in only less than a 1%–2% inconsistency at ° in the range of our observations, i.e. °–13°. For this reason, we corrected the phase angle dependence of the observed magnitudes using Eq. (2) with mag deg-1.
Figure 4 shows the absolute -band magnitude of the dust coma as a function of the heliocentric distance. In the figure, we subtracted the nuclear magnitude, assuming 1.71-km spherical bodies and a geometric albedo of 0.04 (Lamy et al., 2004). For comparison, we plot the mean magnitude (the average of maximum and minimum magnitudes caused by the rotating nucleus) obtained before the 2007 outburst (Snodgrass et al., 2006), where the authors could not find the detectable coma. Figure 4 clearly shows that the photometric magnitudes after the outburst were significantly brighter than the nuclear magnitude. This result is consistent with the fact that the radial profiles of the near-nuclear light source were broader than the stellar profiles (Section 3.1). In addition, there is a trend that the magnitude decreased with increasing heliocentric distance. This trend can be attributed to the fact that the sublimation rate of ice, which is responsible for the dust emission from the nucleus, could decrease because of low solar flux. Accordingly, we can conclude that 17P/Holmes was active and had a faint coma during the time of our observations.
3.3 DUST MASS-LOSS RATE
Note that the absolute magnitude of active comets depends on the aperture size for the photometry. A larger physical aperture encloses more dust particles and accordingly the total cross section increases. Stevenson & Jewitt (2012) used apertures of fixed physical radius at the position of the comet to eliminate the effect. It is, however, difficult to fix the physical aperture size for our data because the seeing sizes differed at different sites from night to night. We adopted a method in Luu & Jewitt (1992) to correct for the aperture size effect. We converted the magnitude into the cross section and then mass-loss rate, by assuming that spherical dust grains with a certain radii and mass density. In addition, we utilized the infrared data from AKARI to derive the dust mass-loss rate before the outburst in the manner described below.
We first calculated the cross section of coma dust particles, , and compared it with the area of the comet nucleus, . We assumed the 17P/Holmes nucleus to be spherical with a radius of 1.71 km (Lamy et al., 2004). We supposed that the scattering properties of the dust particles are the same as those of the nucleus because of the small phase angles in our data set. We thus assumed a geometric albedo of 0.04 and a scattering phase function given in Eq. (2) for the dust particles. Second, we derived a parameter defined as the ratio of the coma cross section to the nucleus cross section . At optical wavelengths, is proportional to the ratio of the flux density scattered by the coma, , to the flux density scattered by the nucleus cross section, , which enables us to characterize the contribution of dust particles in the coma (Luu & Jewitt, 1992; Hsieh & Jewitt, 2005; Kasuga & Jewitt, 2008), that is,
| (4) |
For the mid-infrared data, it is improper to use Eq. (4) for the derivation of because the thermal properties of dust particles are largely different from those of cometary nuclei. We modified Eq. (4) into
| (5) |
where is the flux from a big spherical body like a comet nuclei of unit cross-sectional area. We calculated the flux by using the standard thermal model (STM) (Lebofsky & Spencer, 1989). In the model, it is assumed that the nucleus is a nonrotating spherical body. We thus considered that each element of the surface is in instantaneous equilibrium with solar influx. In situ observation with the Deep Impact spacecraft revealed that the STM was a good approximation to characterize the thermal balance of a comet nucleus whose surface consists of dry materials without icy components (A’Hearn et al., 2005). Standard thermal parameters are assumed, i.e., emissivity –0.95, beaming parameter –0.850, phase integral –0.75, and thermal phase coefficient mag deg-1. In the range, we obtained Jy/m2. In contrast, the flux from the dust coma, that has an equivalent total cross-sectional area was derived in the manner described in Ishiguro et al. (2010). We calculated the equilibrium temperature of a 1-µm-sized particle =2.23 AU using the optical constants of astronomical silicate (217 K), magnetite (229 K), and graphite (235 K) and derived a thermal flux at 18-µm AKARI wavelength of Jy/m2 for astronomical silicate, Jy/m2 for magnetite, and Jy/m2 for graphite. We obtained the observed flux Jy. Using the STM, we estimated the flux from the nucleus to be –5.5)10-2 Jy. Substituting these values in Eq. (5), we obtained for the pre-outburst data. The derived values are summarized in Table 2.
The dust mass-loss rate can be derived from in the manner in Luu & Jewitt (1992) as
| (6) |
where is the mass density of the dust particles, is the grain radius in meters, is the radius of the 17P/Holmes nucleus, and is the reference photometry aperture radius in arcsec. We assumed that 17P/Holmes emitted small dust grains, that is, m. We supposed the mass density of dust particles to be kg m-3. The derived dust mass-loss rates are listed in Table 2. Note here that the dust mass-loss rate is a crude estimate. In fact, there is a big uncertainty in the dust mass-loss rate because the mass-loss rate is proportional to the grain size.
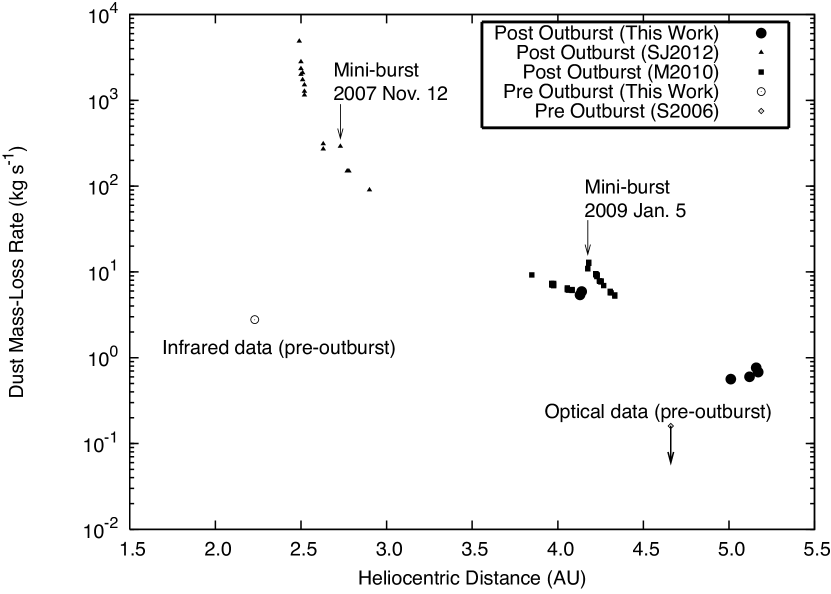
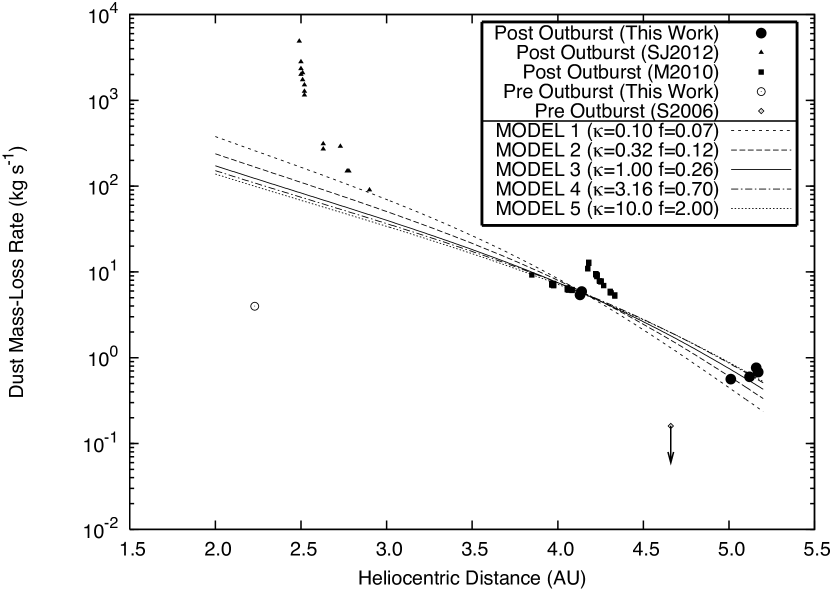
Figure 5 shows the dust mass-loss rate as a function of heliocentric distance . In addition to our data, we compared the dust mass-loss rate to data from previous research. As we previously mentioned, Snodgrass et al. (2006) could not detect any coma at 4.66 AU before the outburst and put an upper limit on an unresolved coma of 24.6 mag. We converted the magnitude into the mass-loss rate in the figure. Miles (2010) monitored the near-nuclear magnitude over five months using 2.0-m telescopes, the Faulkes Telescope North and the Liverpool Telescope, with an SDSS-r′ filter, and derived the magnitude. Since the aperture size for photometry and the bandpass filter of their observation were different from ours, we scaled their data to match our data at the NHAO run in December 2008. Owing to frequent observations as well as to good photometric stability, Miles (2010) succeeded in detecting a minor burst possibly occurring on January 2009 and attaining a peak magnitude enhancement of mag. Moreover, we refer to the dust mass-loss rate derived in Stevenson & Jewitt (2012). The observation covered when the comet was at 2.49–2.50 AU. They derived the mass-loss rate in a manner similar to ours. They thus obtained the mass-loss rate by assuming spherical dust grains with radii of 1 µm and a bulk density of 1000 kg m-3.
In Figure 5, it is clear that the mass-loss rate significantly increased after the 2007 outburst. In addition, it had decreased with increasing heliocentric distance most likely because of weaker solar influx. There are two minor peaks on 12 November 2007 and 5 January 2009, indicating minibursts occurred at those epochs (Stevenson & Jewitt, 2012; Miles, 2010).
3.4 FRACTIONAL ACTIVE AREA OF THE NUCLEUS
We now consider a model to predict the dust mass-loss rate based on a thermal balance on the surface. We assume that this element of the surface is in instantaneous equilibrium with solar radiation and the latent heat of sublimation of ice. We thus consider the energy balance on the surface of the icy body given by
| (7) |
(Desvoivres et al., 1999, 2000), where is the solar flux at 1 AU, is the zenith distance of the Sun, is the emissivity, and is the Stefan-Boltzmann constant. is the geometric albedo and is the surface temperature. The latent heat of sublimation of water, is given by
| (8) |
The sublimation rate of the water ice is given by
| (9) |
where is the water ice-to-dust mass ratio, defined as = (where and are the masses of water ice and dust particles per unit volume, respectively), is the molecular mass of water, and is the Boltzmann constant. denotes the sticking coefficient (Haynes et al., 1992; Enzian et al., 1997) given by
| (10) |
In Eq. (9), the saturated vapor pressure of water, is given by the Clausius-Clapeyron equation. The mass-loss rate of the dust particles, , is therefore given by an integral over the sunlit hemisphere of the spherical body:
| (11) |
where is the fractional active area. We used .
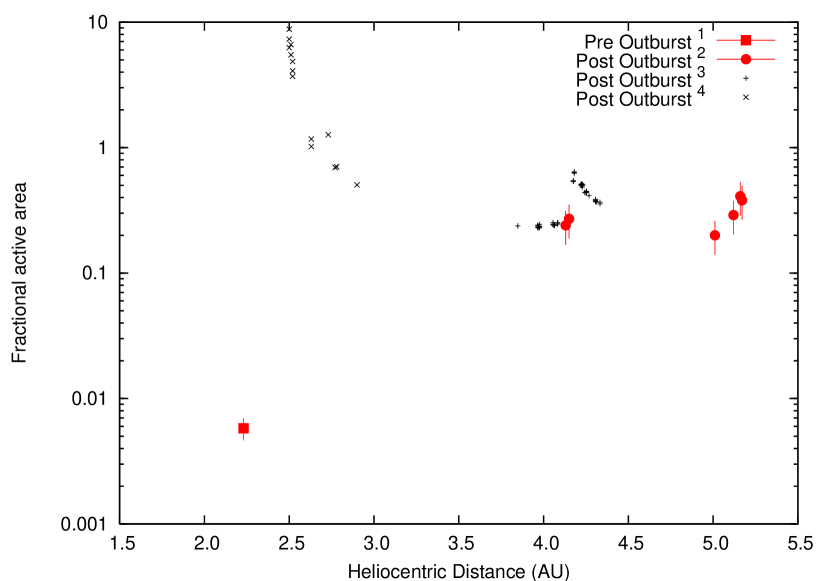
In this model, there is a large uncertainty in . It is conventionally assumed to be unity in the literature. Once we fix , it is possible to determine by a comparison with the observed mass-loss rate. We considered five different cases in the range of 0.1 10 and fit the model results to the observed data at 4.1 AU, adjusting . Figure 6 shows the heliocentric distance dependence of the dust mass-loss rate. In the figure, we compared the observed dust mass-loss rate with those calculated from the models. Our models reproduce the trend that the dust mass-loss rate decreases with increasing heliocentric distance. However, there are big differences at 3 AU and at the time of the miniburst on 5 January 2009. We infer that there could be remnants of large dust particles in the physical aperture (Stevenson & Jewitt, 2012) or that the nucleus was still in an extraordinarily excited state in the aftermath of the 2007 outburst.
Infrared space observations of periodic comets suggested that the mass-loss rate of dust trail particles is comparable to that inferred from OH production rates or larger than that inferred from visible-light scattering in comae (Sykes & Walker, 1992; Reach et al., 2007; Lisse et al., 2006). A theoretical model to simulate the recurrent outburst nature of the 17P/Holmes outburst shows favorable results when –0.6 (Hillman & Prialnik, 2012). MODEL 2 () and MODEL 3 (=1.00) are therefore reasonable models among these five. When we adopt these models, we can derive the fractional active area, as shown in Figure 7. The fractional active area was 0.20–0.38 over the time of our observations but increased to 0.64 when the miniburst occurred. The values are larger than the average for short-period comets (0.2 on average; see, e.g., Tancredi et al. (2006)). Note again that the dust mass-loss rate derived from the observation strongly depends on the particle size. If we assume 10-µm-sized particles, the fractional active area is saturated to be unity. Therefore, we conclude that a significant fraction of the surface of 17P/Holmes was still active.
3.5 DUST TAIL MORPHOLOGY
So far, we derived the dust mass-loss rate under the assumption of small particles (i.e., µm). The model has been widely used in previous research (see, e.g., Luu & Jewitt, 1992). It also permits a direct comparison with the previous study of the 17P/Holmes dust mass-loss rate given in Stevenson & Jewitt (2012). However, the existence of large particles as well as micrometer-sized particles is widely confirmed based on telescopic observations (Watanabe et al., 1990; Ishiguro et al., 2002; Sykes & Walker, 1992; Fulle, 2004; Reach et al., 2007), remote-sensing observations with spacecraft onboard cameras (Sekanina et al., 2004), and in situ measurements of cometary dust particles (McDonnell et al., 1986; Tuzzolino et al., 2003; A’Hearn et al., 2011). The detection of a cometary dust trail associated with 17P/Holmes with Spitzer is definitive evidence that 17P/Holmes had ejected large dust particles (Reach et al., 2010). Furthermore, Moreno et al. (2008) suggested that 600 µm particles could be ejected by the 2007 outburst. Millimeter-wavelength continuum observations also suggested the existence of submillimeter particles (Altenhoff et al., 2009). We hence examined the dust particle size using our observed composite images.
Orbits of dust grains are, in principle, determined by the size and the ejection speed. The size of the particle can be parametrized by , the ratio of the solar radiation pressure to the gravitational attraction. Assuming a spherical particle, we can define as
| (12) |
where and are the particle radius in meters and the mass density in kg m-3. = 5.7 10-5 kg m-2 is a constant and is the radiation pressure coefficient averaged over the solar spectrum (Burns et al., 1979). Supposing that particles are compact in shape and large compared to the optical wavelength, we considered as unity.
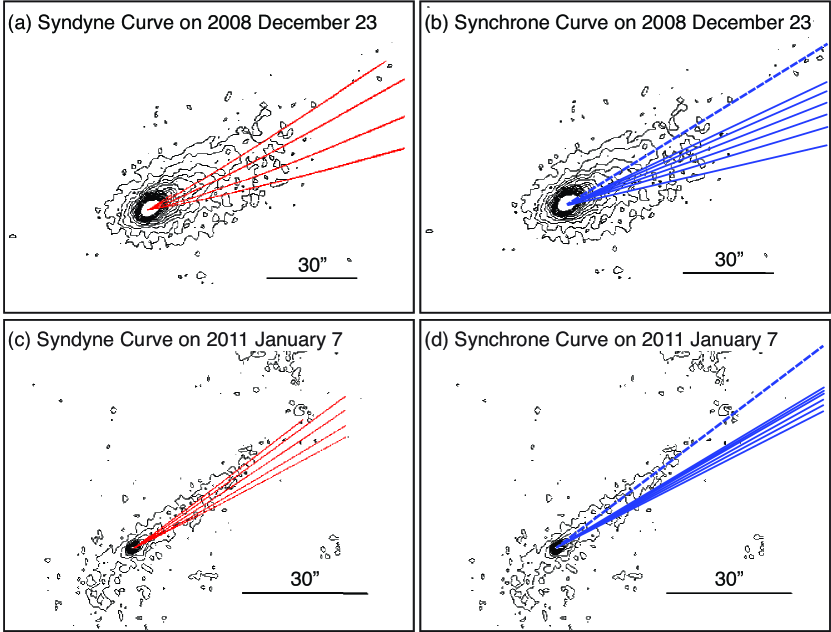
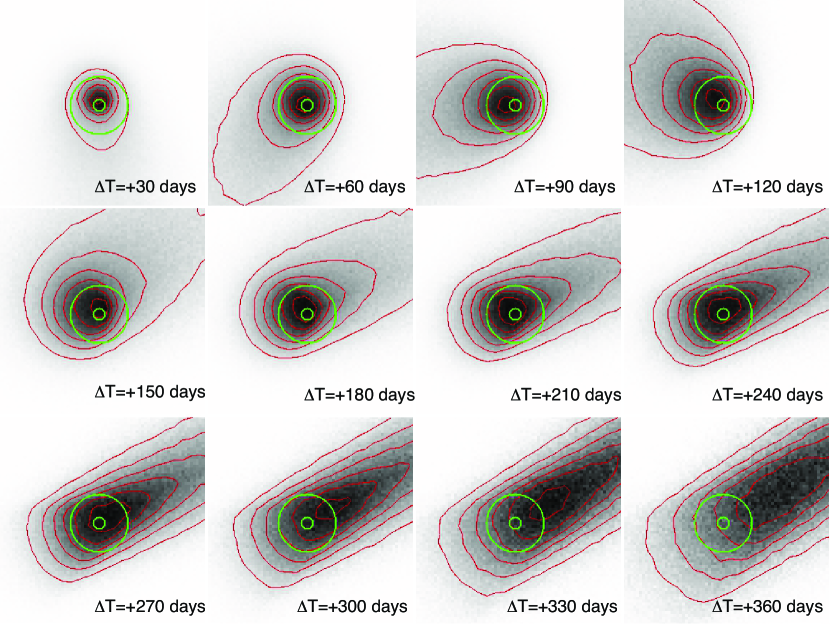
As an initial guess, we drew the syndyne and synchrone curves. Syndynes are curves representing a constant value of when the ejection velocity is assumed to be zero. Synchrones are curves representing the positions of particles of different sizes (i.e., different ) ejected at the same time with zero velocity. Figure 8 left shows a comparison between the observed contour maps and the syndyne curves of µm, 10 µm, 100µm, 1 mm, and 1 cm. We selected two composite images on 23 December 2008 and 7 January 2011 because synchrones and syndynes are well separated in these images. From the syndyne curves, the loci of larger particles, –1 cm, match the center of the dust tail. This suggests that big particles are dominant in the cross-sectional area in the dust tail. From the synchrone curves, particles ejected more than one year before the observation match the position of the dust tail (Figure 8 right). It is likely that the dust particles ejected soon after the outburst were responsible for the dust tail. Synchrone–syndyne analysis, however, tends to lead to a misleading value of dust sizes (Ishiguro et al., 2007; Fulle, 2004). A three-dimensional analysis, which allows nonzero ejection velocities to be considered, is appropriate to estimate the particle sizes and mass-loss rate. Here we applied a three-dimensional analysis to match the observed images, following the model in Ishiguro et al. (2007), Sarugaku et al. (2007), Ishiguro (2008), and Hanayama et al. (2012).
We assumed that the dust particles were ejected symmetrically with respect to the Sun–comet axis in a cone-shape jet with half-opening angle , implying that the active regions are distributed ubiquitously over the surface of the nucleus and therefore that the dust emission occurred homogeneously around the subsolar point. The model also suggests that the dust particles were ejected independently of the rotation of the nucleus. Given that the ejection speed was a power-law function of heliocentric distance, we adopted an empirical function for the ejection terminal velocity of dust particles:
| (13) |
where is the reference ejection velocity of the particles at . We set and AU, respectively. and are the power indices of and the heliocentric distance dependence of the ejection velocity. A random variable follows the Gaussian probability density function, , which is given by the following formula:
| (14) |
where is standard deviation of . We set =0.25. From this method, most (68%) has a value ranging from 1- to 1+.
A power-law size distribution with index was used, i.e.,
| (15) |
in the size range of .
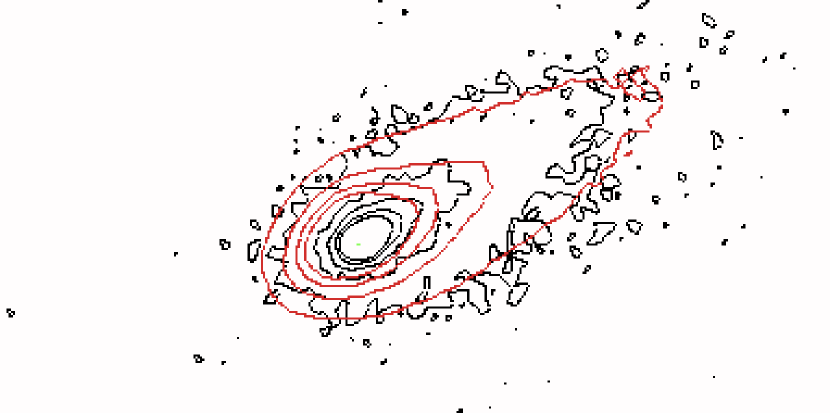
We derived the above parameters to fit the morphology of the dust cloud. We focused on the positions of the extended dust tail and the flux ratio between coma and extended structures. The input and best parameters sets are summarized in Table 3. We show an example simulation image to compare with the observational data on 23 December 2008. From the fitting we derived a mass-loss rate at 4.1 AU of 170 kg s-1. Although there are large uncertainties in these best-fit values, it is clear that the resultant mass-loss rate is significantly larger than the rate we derived based on the small-grain model in Section 3.3.
3.6 TOTAL MASS AND DEPTH EXCAVATED BY THE OUTBURST
We hereby consider the total mass of the ejecta and the depth excavated by the 2007 outburst. There is a big uncertainty in the total mass in the range of 1010–1013 kg (Montalto et al., 2008; Altenhoff et al., 2009; Reach et al., 2010; Ishiguro et al., 2010; Boissier et al., 2012). In addition, little is known about the excavated depth by the initial outburst. As discussed in Ishiguro et al. (2010), the power index of the size distribution and the maximum size of the particles are critical factors to derive the total mass. The fraction of the active area is a crucial factor in determining the depth. In the previous subsection, we confirmed that 1mm–1cm particles were ejected from the nucleus. The power index of the size distribution was derived to be 3.4–3.6, which is consistent with previous studies (Zubko et al., 2011; Boissier et al., 2012). Moreover, we deduced the fractional active area of 0.20–0.38. It is reasonable to think 20–38% of the surface materials were blown out by the initial outburst if the surface condition remained constant after the outburst. Using these parameters and assuming the mass density of the particles and the nucleus are =1 g cm-3 and =0.5 g cm-3, respectively, we could update the total mass and newly derive the depth excavated by the 2007 outburst in the same manner as Ishiguro et al. (2010). We found that the total mass of the ejecta was in the range of 5.31011– 6.11012 kg. The derived mass is consistent with Reach et al. (2010) and Boissier et al. (2012). In addition, it was found that 76m–1600m of surface materials were excavated by the initial outburst. Since the upper limit of the depth, 1600 m, is equivalent to the nuclear radius, our upper limit may not be a realistic estimate. Therefore, we can safely conclude that more than 76 m surface materials were blown off by the 2007 outburst.
3.7 DUST COLOR
We measured the color of the dust within an aperture radius of 1.0″ plus the nucleus using Subaru data on 6 June 2011. The observed magnitudes are (g′ band), (r′ band), and (z′ band), respectively. The photometric magnitudes were converted into VRI magnitudes using transformation equations from Smith et al. (2002). We derived the color indices and . These color indies are consistent with those of the nucleus before the outburst, that is, and (Snodgrass et al., 2006). They are also similar to the average of Jupiter-family comets but different from most Kuiper Belt objects (Jewitt, 2002; Meech et al., 2004). Because the old surface was excavated and fresh surface was exposed in our data, the color may be inherent to fresh comets, that is, icy bodies in the solar system.
4 SUMMARY
We have outlined the observational evidence of 17P/Holmes activity before and after the 2007 outburst and found the followings:
-
•
The nucleus highly depleted its near-surface icy component before the 2007 outburst.
-
•
It had been active even near the aphelion passage in 2010.
-
•
The surface fractional active area was before the outburst whereas it enlarged by a factor of 50 after the 2007 outburst under the assumption of a small-dust-grain model.
-
•
The nucleus color was similar to that of the dust particles and to the pre-outburst color of the nucleus.
-
•
More than 76 m surface materials were blown off by the 2007 outburst.
We expect that long-term monitoring observations during the 2014 perihelion passage and even later will give important information about how the active nucleus depletes its near-surface ice.
Acknowledgments
We express our gratitude to the participants of the @site program for
helping with our observations. We shared a joyful occasion with the
public visitors at NHAO. Use of the UH2.2m telescope was supported by
NAOJ, and HCT observation was assisted by the observatory staff at the
Indian Institute of Astrophysics. Subaru data were obtained with the
support of the National Astronomical Observatory. We particularly thank
Drs. Fumiaki Nakata and Miki Ishii for their observational
support and technical advice. The infrared data is acquired with AKARI,
a JAXA project with the participation of ESA. A portion of the data was
collected with the Subaru Telescope and obtained from SMOKA, which is
operated by the Astronomy Data Center, National Astronomical Observatory
of Japan. We thank the referee for his/her careful reading and valuable
comments. SH is supported by the Space Plasma Laboratory, ISAS/JAXA.
This work at Seoul National University was supported by a National
Research Foundation of Korea (NRF) grant funded by the Korean government
(MEST) (No. 2012R1A4A1028713).
Appendix A CONTRIBUTION OF DUST PARTICLES EJECTED THROUGH 2007 OUTBURST
In the second paragraph of Section 3.1, we provided a simple theory to explain the cause of broadening in Figure 3, which helps us to understand the broadening in a straightforward manner. A similar theory was given in Stevenson & Jewitt (2012). It is important to check the consistency of the discussion with the three dimensional model we provided in Section 3.5. We examined whether the outburst dust particles contributed to the broadening in our images using our three dimensional model. The motion of the dust particles is more complicated than we discussed in Section 3.2. Dust particles expand because of the initial velocity, but at the same time, some dust particles ejected sunward are affected by the solar radiation pressure. Figure 10 shows time-series simulation images of dust particles ejected on 23 October 2007 based on the three dimensional model. There is no circular envelope as observed in Figure 2 (a) and (b) most likely because the model simulates the low velocity component. In the figure, two circles denote the aperture radius of 0.2″ and 1″, respectively. Within the aperture, we observed the broadening in all data sets. We found that the brightest part of the cloud, which could contribute the broadening of radial profiles, was detached 10 months after the outburst. Since our postburst data were taken 11 months after the outburst, dust particles ejected by the outburst could not contribute the broadening of the radial profiles. It is natural to think 17P/Holmes showed the broadened brightness profile because it was active when we made the observations.
References
- A’Hearn et al. (2005) A’Hearn, M. F., et al. 2005, Science, 310, 258
- A’Hearn et al. (2011) A’Hearn, M. F., et al. 2011, Science, 332, 1 396
- Altenhoff et al. (2009) Altenhoff, W. J., Kreysa, E., Menten, K. M., Sievers, A., Thum, C., & Weiss, A. 2009, A&A, 495, 975
- Barnard (1896) Barnard, E. E. 1896, ApJ, 3, 41
- Boissier et al. (2012) Boissier, J., et al. 2012, A&A, 542, A73
- Burns et al. (1979) Burns, J. A., Lamy, P. L., & Soter, S. 1979, Icarus, 40, 1
- Crifo & Rodionov (1997) Crifo, J. F., & Rodionov, A. V. 1997, Icarus, 127, 319
- Desvoivres et al. (2000) Desvoivres, E., Klinger, J., Levasseur-Regourd, A. C., & Jones, G. H. 2000, Icarus, 144, 172
- Desvoivres et al. (1999) Desvoivres, E., et al. 1999, MNRAS, 303, 826
- Enzian et al. (1997) Enzian, A., Cabot, H., & Klinger, J. 1997, A&A, 319, 995
- Finson & Probstein (1968) Finson, M., & Probstein, R. 1968, ApJ, 154, 327
- Fulle (2004) Fulle, M. 2004, Comets II, 565
- Gronkowski & Sacharczuk (2010) Gronkowski, P., & Sacharczuk, Z. 2010, MNRAS, 408, 1207
- Grün et al. (1985) Grün, E., Zook, H. A., Fechtig, H., & Giese, R. H. 1985, Icarus, 62, 244
- Hanayama et al. (2012) Hanayama, H., et al. 2012, PASJ, 64, 134
- Haynes et al. (1992) Haynes, D. R., Tro, N. J., & George, S.M. 1992, J. Phys. Chem., 96, 8502
- Hillman & Prialnik (2012) Hillman, Y., & Prialnik, D. 2012, Icarus, 221, 147
- Jewitt (2002) Jewitt, D. C. 2002, AJ, 123, 1039
- Hsieh & Jewitt (2005) Hsieh, H. H., & Jewitt, D. 2005, ApJ, 624, 1093
- Hsieh et al. (2010) Hsieh, H. H., Fitzsimmons, A., Joshi, Y., Christian, D., & Pollacco, D. L. 2010, MNRAS, 407, 1784
- Ip & Mendis (1974) Ip, W.-H., & Mendis, D. A. 1974, Ap&SS, 26, 153
- Ishiguro (2008) Ishiguro, M. 2008, Icarus, 193, 96
- Ishiguro et al. (2002) Ishiguro, M., et al. 2002, ApJ, 572, L117
- Ishiguro et al. (2007) Ishiguro, M., Sarugaku, Y., Ueno, M., Miura, N., Usui, F., Chun, M.-Y., & Kwon, S. M. 2007, Icarus, 189, 169
- Ishiguro et al. (2010) Ishiguro, M., et al. 2010, ApJ, 714, 1324
- Ishihara et al. (2010) Ishihara, D., et al. 2010, A&A, 514, A1
- Kasuga & Jewitt (2008) Kasuga, T., & Jewitt, D. 2008, AJ, 136, 881
- Kawada et al. (2007) Kawada, M., et al. 2007, PASJ, 59, 389
- Kossacki & Szutowicz (2010) Kossacki, K. J., & Szutowicz, S. 2010, Icarus, 207, 320
- Kossacki & Szutowicz (2011) Kossacki, K. J., & Szutowicz, S. 2011, Icarus, 212, 847
- Lamy et al. (2004) Lamy, P. L., Toth, I., Fernandez, Y. R., & Weaver, H. A. 2004, Comets II, 223
- Landolt (1992) Landolt, A. U. 1992, AJ, 104, 1, 340
- Landolt (2009) Landolt, A. U. 2009, AJ, 137, 4186
- Lebofsky & Spencer (1989) Lebofsky, L. A., & Spencer, J. R. 1989, Asteroids II, 128
- Levison & Duncan (1997) Levison, H. F., & Duncan, M. J. 1997, Icarus, 127, 13
- Li et al. (2007) Li, J.-Y., A’Hearn, M. F., McFadden, L. A., & Belton, M. J. S. 2007, Icarus, 188, 195
- Li et al. (2011) Li, J., Jewitt, D., Clover, J. M., & Jackson, B. V. 2011, ApJ, 728, 31
- Lisse (2002) Lisse, C. 2002, Earth Moon Planets, 90, 497
- Lisse et al. (1998) Lisse, C. M., et al. 1998, ApJ, 496, 971
- Lisse et al. (2006) Lisse, C. M., et al. 2006, Science, 313, 635
- Luu & Jewitt (1992) Luu, J. X., & Jewitt, D. C. 1992, Icarus, 97, 276
- McDonnell et al. (1986) McDonnell, J. A. M., et al. 1986, Nature, 321, 338
- Meech et al. (2004) Meech, K. J., Hainaut, O. R., & Marsden, B. G. 2004, Icarus, 170, 463
- Miles (2010) Miles, R. 2010, arXiv:1006.4019
- Miyazaki et al. (2002) Miyazaki, S., et al. 2002, PASJ, 54, 833
- Monet et al. (2003) Monet, D. G., et al. 2003, AJ, 125, 984
- Montalto et al. (2008) Montalto, M., Riffeser, A., Hopp, U., Wilke, S., & Carraro, G. 2008, A&A, 479, L45
- Moreno et al. (2008) Moreno, F., et al. 2008, ApJ, 677, L63
- Mukai (1985) Mukai, T. 1985, A&A, 153, 213
- Murakami et al. (2007) Murakami, H., et al. 2007, PASJ, 59, 369
- Onaka et al. (2007) Onaka, T., et al. 2007, PASJ, 59, 401
- Ouchi et al. (2004) Ouchi, M., et al. 2004, ApJ, 611, 660
- Reach et al. (2007) Reach, W. T., Kelley, M. S., & Sykes, M. V. 2007, Icarus, 191, 298
- Reach et al. (2010) Reach, W. T., Vaubaillon, J., Lisse, C. M., Holloway, M., & Rho, J. 2010, Icarus, 208, 276
- Sakamoto (2008) Sakamoto, M. 2008, in Global Hands-on Universe 20070 for Win-Win Relations between Science Research and Education, eds. T. Handa & M. Okyudo (Tokyo, Universal Academy Press), 123
- Sarugaku et al. (2007) Sarugaku, Y., et al. 2007, PASJ, 59, L25
- Sarugaku et al. (2010) Sarugaku, Y., Ishiguro, M., Ueno, M., Usui, F., & Watanabe, J. 2010, ApJ, 724, L118
- Schleicher (2009) Schleicher, D. G. 2009, AJ, 138, 1062
- Schleicher et al. (1998) Schleicher, D. G., Millis, R. L., & Birch, P. V. 1998, Icarus, 132, 397
- Sekanina (2008) Sekanina, Z. 2008, Int. Comet Q. 30, 63
- Sekanina (2009) Sekanina, Z. 2009, Int. Comet Q., 31, 5
- Sekanina et al. (2004) Sekanina, Z., Brownlee, D. E., Economou, T. E., Tuzzolino, A. J., & Green, S.F. 2004, Science, 304, 1769
- Snodgrass et al. (2006) Snodgrass, C., Lowry, S. C., & Fitzsimmons, A. 2006, MNRAS, 373, 1590
- Snodgrass et al. (2008) Snodgrass, C., Lowry, S. C., & Fitzsimmons, A. 2008, MNRAS, 385, 737
- Stevenson & Jewitt (2012) Stevenson, R., & Jewitt, D. 2012, AJ, 144, 138
- Stevenson et al. (2010) Stevenson, R., Kleyna, J., & Jewitt, D. 2010, AJ, 139, 2230
- Sykes & Walker (1992) Sykes, M. V., & Walker, R. G. 1992, Icarus, 95, 180
- Tancredi et al. (2006) Tancredi, G., Fernández, J. A., Rickman, H., & Licandro, J. 2006, Icarus, 182, 527
- Tuzzolino et al. (2003) Tuzzolino, A. J., et al. 2003, J. Geophys. Res. (Planets), 108, 8115
- Watanabe et al. (1990) Watanabe, J.-I., Tsumura, M., & Sugawara, K. 1990, PASJ, 42, L69
- Watanabe et al. (2009) Watanabe, et al. 2009, PASJ, 61, 679
- Whipple (1951) Whipple, F. L. 1951, ApJ, 113, 464
- Yang et al. (2009) Yang, B., Jewitt, D., & Bus, S. J. 2009, AJ, 137, 4538
- Zubko et al. (2011) Zubko, E., et al. 2011, J. Quant. Spectrosc. Radiat. Transfer, 112, 1848

| Observatory | Instrument | UT | Filter | Exptime | ||||
|---|---|---|---|---|---|---|---|---|
| (Perihelion) | 2007/05/05.04 | 2.05 | 171.3 | |||||
| AKARI | MIR | 2007/08/23.36 | L18W | – | 2.23 | 1.99 | 27.0 | 60.9 |
| (Outburst) | 2007/10/23.30 | 2.43 | 0.0 | |||||
| Subaru | Suprime-Cam | 2008/09/29.62 | VR | 4.5 | 3.84 | 4.26 | 12.9 | +342.3 |
| NHAO | MINT | 2008/12/23.71 | 297 | 4.13 | 3.35 | 9.2 | +427.4 | |
| NHAO | MINT | 2008/12/27.70 | 258 | 4.15 | 3.32 | 8.3 | +431.4 | |
| NHAO | MINT | 2010/01/16.86 | 33 | 5.01 | 4.27 | 8.0 | +816.6 | |
| (Aphelion) | 2010/10/14.25 | 5.19 | ||||||
| Subaru | Suprime-Cam | 2011/01/07.57 | 30 | 5.17 | 4.90 | 10.8 | +1172.3 | |
| UH2.2m | Tex2k | 2011/02/04.48 | 114 | 5.16 | 4.48 | 8.6 | +1200.2 | |
| UH2.2m | Tex2k | 2011/02/05.53 | 216 | 5.16 | 4.47 | 8.5 | +1201.2 | |
| HCT | Site2k4k | 2011/03/29.85 | 87 | 5.12 | 4.16 | 3.2 | +1253.6 | |
| HCT | Site2k4k | 2011/03/30.76 | Free | 231 | 5.12 | 4.16 | 3.7 | +1254.5 |
| Subaru | Suprime-Cam | 2011/06/06.28 | g′, r′, z′ | 4.5, 3, 15 | 5.06 | 4.82 | 11.5 | +1322.0 |
| (Perihelion) | 2014/03/03.16 | 2.05 | +2345.1 |
| UT | [error] | [″] | [kg s-1] | ||
|---|---|---|---|---|---|
| 2005/03/06.00 | 22.86 [0.15] | 16.24 | 1.00 | 0.14 | 0.17 |
| 2007/08/23.36 | 0.39† [0.04] | – | 21.0 | 17.0 | 2.75 |
| 2007/10/27.65 | 2.46 [0.20] | 1.11 | – | – | – |
| 2008/12/23.71 | 18.99 [0.19] | 12.96 | 4.75 | 17.3 | 5.40 |
| 2008/12/26.81 | 18.82 [0.15] | 12.83 | 5.00 | 19.8 | 5.89 |
| 2010/01/16.86 | 21.81 [0.22] | 14.97 | 4.00 | 2.13 | 0.56 |
| 2011/01/07.57 | 22.60 [0.15] | 15.20 | 1.75 | 1.32 | 0.68 |
| 2011/02/05.53 | 22.08 [0.12] | 14.96 | 2.50 | 1.91 | 0.76 |
| 2011/03/29.85 | 21.22 [0.26] | 14.47 | 6.50 | 3.58 | 0.59 |
| Parameter | Input values | Best-fit values |
|---|---|---|
| 0.1–0.5 with 0.1 interval | 0.3–0.5 | |
| 0.1–0.5 with 0.1 interval | 0.2–0.4 | |
| 3.0–4.0 with 0.1 interval | 3.4–3.6 | |
| 0–12 with 3 interval | 9 | |
| [µm] | 1 (fixed) | 1 |
| [µm] | 102, 103, 104 | 103–104 |
| [m/s] | 10–150 with 10 interval | 30–35 |
| [°] | 10–60 with 5 interval | 15–25 |