Phase behavior of binary mixtures of hard convex polyhedra†
Mihir R. Khadilkara, Umang Agarwal band Fernando A. Escobedo ∗c‡
Received Xth XXXXXXXXXX 20XX, Accepted Xth XXXXXXXXX 20XX
First published on the web Xth XXXXXXXXXX 200X
DOI: 10.1039/b000000x
Shape anisotropy of colloidal nanoparticles has emerged as an important design variable for engineering assemblies with targeted structure and properties. In particular, a number of polyhedral nanoparticles have been shown to exhibit a rich phase behavior [Agarwal et al., Nature Materials, 2011, 10, 230]. Since real synthesized particles have polydispersity not only in size but also in shape, we explore here the phase behavior of binary mixtures of hard convex polyhedra having similar sizes but different shapes. Choosing representative particle shapes from those readily synthesizable, we study in particular four mixtures: (i) cubes and spheres (with spheres providing a non-polyhedral reference case), (ii) cubes and truncated octahedra, (iii) cubes and cuboctahedra, and (iv) cuboctahedra and truncated octahedra. The phase behavior of such mixtures is dependent on the interplay of mixing and packing entropy, which can give rise to miscible or phase-separated states. The extent of mixing of two such particle types is expected to depend on the degree of shape similarity, relative sizes, composition, and compatibility of the crystal structures formed by the pure components. While expectedly the binary systems studied exhibit phase separation at high pressures due to the incompatible pure-component crystal structures, our study shows that the essential qualitative trends in miscibility and phase separation can be correlated to properties of the pure components, such as the relative values of the order-disorder transition pressure (ODP) of each component. Specifically, if for a mixture A+B we have that ODPODPA and ODP = ODPA - ODPB, then at any particular pressure where phase separation occurs, the larger the ODP the lower the solubility of A in the B-rich ordered phase and the higher the solubility of B in the A-rich ordered phase.
1 Introduction
††footnotetext: a Department of Physics, Cornell University, Ithaca, New York. ††footnotetext: b School of Chemical and Biomolecular Engineering, Cornell University, Ithaca, New York. ††footnotetext: c School of Chemical and Biomolecular Engineering, Cornell University, Ithaca, New York. E-mail: fe13@cornell.eduInterest in material design based on nanocrystal assemblies has been rapidly increasing over the past decade. The choice of building blocks, size and shape, composition and surface functionalization offers multiple avenues to taylor the properties of these assemblies. Going beyond the prototypical spherical nanoparticles, researchers have explored the effect of shape anisotropy on colloidal self-assembly afforded by the synthesis of cubes, rods, plates, disks and particles with core-shell structure 1234. With the advent of new particle synthesis methods5678 polyhedral nanoparticles are becoming ubiquitous in providing varying extent of shape ‘anisotropy’. Suspensions of a range of polyhedral shapes have been shown to produce interesting partially ordered ‘mesophases’ 9 101112 at intermediate volume fractions. The mixing of nanoparticles of different chemical composition could provide a simple way to prepare ordered structures with more desirable properties; e.g., if a dopant component adds some functionality to the host component in a matrix. If the particles differ not only in composition but also in shape, one may gain additional control over the extent of infiltration by the dopant component, how their particles orient and what spatial environment they encounter.
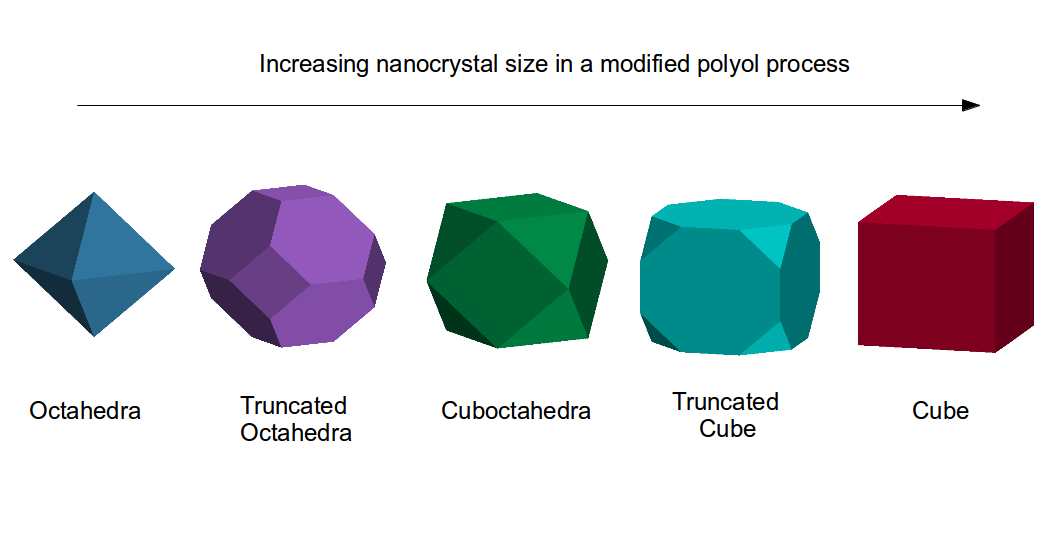
A range of different polyhedral nanocrystals have become readily synthesizable by controlling the growth step in a modified polyol process for the formation of nanocrystals made of gold 1314 and other inorganic materials1516 ; Figure 1 shows some of the particle shapes typically produced this way. This approach also readily leads to mixtures of these polyhedra (shape bidispersity) by stopping the growth process at different stages. The phase behavior of such binary mixtures (of particles having similar size but different shape) is expected to depend on multiple factors, including the phase behavior of the individual polyhedra and in particular their order-disorder transition pressure (ODP) and the crystal lattice they assemble into. A specific class of tessellating mixtures17 has been studied before; in that case the pure components exhibit incompatible crystal lattices, but at a precise (stoichiometric) composition and size ratio, they can assemble into binary crystalline compounds. However, most mixtures of polyhedra with incompatible crystal lattices (for the monodisperse systems) would be expected to phase separate at higher volume fractions into ordered phases resembling those of the pure components.
When a mixture of two polyhedral shapes A + B does phase separate, it is important to explore the extent to which they mix in the different phases; i.e., how much B is incorporated in the A-rich phase and how much A is incorporated in the B-rich phase. Such information will be useful, e.g., in predicting the limiting compositions at which such bidisperse mixtures can exist without phase separation. Two components that individually form the same type of mesophase may give rise to mixtures that exhibit a similar mesophase. For example, appreciable mixing of components has been observed in the case of polydisperse mixtures of rigid rods of different length which form a nematic phase18, and of cubes of different size that form a cubatic mesophase19.
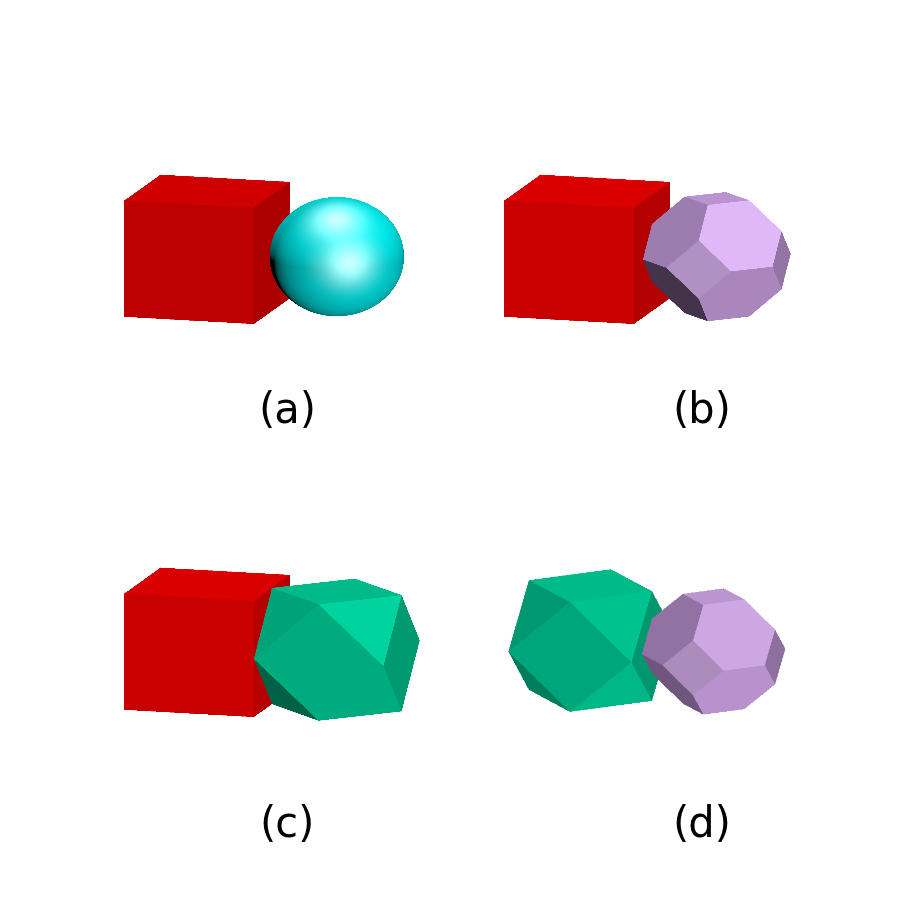
With these considerations in mind, we study here the self-assembly of binary mixtures of convex polyehdra. As a reference case, we study first the cube + sphere mixture (CS), taking the sphere as the infinite-facet limit of a regular polyhedron. Further, we choose three representative binary mixtures, each made from polyhedra that have been synthesized by various experimental methods 131420 : cubes + truncated octahedra (CTO), cuboctahedra +cubes (COC), and cuboctahedra + truncated octahedra (COTO). These mixtures represent different degrees of similarity in terms of rotational symmetry, asphericity 9 and the crystal lattice they individually assemble into. The presence of similar mesophases9 may also affect this degree of mixing. Large difference in ODPs between components is associated with larger difference in sizes and hence is expected to result in more ‘incompatible’ mixtures, that readily phase separate. Conversely, components with similar ODPs and similar mesophases could be expected to better mix with each other. Our aim in this paper is to determine approximate pressure-composition phase diagrams for each of these mixtures to try to elucidate the relation between the phase behavior of the mixture and that of the pure components. Although there are many experimental methods prevalent in the literature that allow synthesis of concave shapes, as a first step, we aim to keep our analysis simple by restricting ourselves to more common convex shapes.
The CS system represents a limiting case when one of the components (spheres) has no anisotropy. In this case, the individual shapes and their crystal structures are quite incompatible and they are expected to phase separate above the components’ ODPs. In our simulations, we have assumed that the side of the cube is equal to the diameter of the sphere. While such a choice does fulfill the criterion of having components similar in size, it will necessarily affect the precise location of phase boundaries in the phase diagram and also create an asymmetry in the relative diffusivities of the components in a given phase (with the smaller component typically having larger mobility).
The other mixtures studied, namely, CTO, COC and COTO represent cases of components with varying degrees of similarity in shape and size. The CTO mixture corresponds to components which are rather distant in the polyol process (see Figure 1); this mixture also embodies a peculiar feature where the two individual components are space tessellating (at close packing) but a mixture of any composition is not. Such a feature and the fact that their ordered phases have very different symmetry suggest that the CTO system should be largely incompatible (not unlike the CS system). Considering that cubes and truncated cubes have almost identical phase behavior and very similar shapes, one can consider the mixture of cubes and cuboctahedra (COC) as representing shapes which are essentially neighbors in the polyol process (see Figure 1). Further, the partial similarity of the ordered structures of the pure components suggest that the COC mixture could have an intermediate degree of compatibility. The mixture of cuboctahedra and truncated octahedral (COTO) can be considered as potentially the most compatible given that the components are proximal in the polyol process (Fig. 1) and that both form a rotator mesophase. In each of the mixtures, the size ratios of the components (see next Section) are consistent with those obtained in a typical polyol process1314.
2 Methodology
In our simulations, we assume the particles to be interacting via hard-core potentials, which amounts to ensuring that particles never overlap. Extensive expansion and compression Monte Carlo (MC) runs were performed to map out the equation of state of each of the mixtures, at constant pressure and particle number (NPT ensemble). Although we observe hysteresis between expansion and compression runs, we use expansion runs to estimate the transition pressures because they typically need to surmount a smaller free energy barrier at the transition points and are hence expected to more closely follow thermodynamic behavior. Unless otherwise indicated, the mixtures were simulated at the same composition of 50 %. We used a total of 2560 particles for CS, CTO and COTO mixtures and 2048 particles for COC mixture. As indicated earlier, the size of the components was chosen based on typical results of the modified polyol process. For such a process, Seo et al. 13 report the average edge lengths of different shapes to be 98, 120 and 145 nm for truncated octahedra, cuboctahedra and cubes respectively. Of course, synthesis conditions can be altered so that a given particle shape can be obtained with different sizes, but choosing sizes consistent with those attainable within a single growth experiment underscores a simple possible strategy to obtain the mixtures studied in this work.
The dimensionless osmotic pressure is defined as
| (1) |
where , is the characteristic length in each of the mixtures simulated here. In mixtures involving the cubic particles, this characteristic length is the length of the side of the cube, while in COTO mixture, it is the side of the imaginary cube from which the cuboctahedron is cut. is an arbitrary energy parameter (set to 1). In these reduced units, the edge-lengths, particle volumes, approximate order-disorder transition pressure (ODP) and mesophase-crystal transition pressure (MCP) for all the particles studied are shown in Table 1. The volume fraction of the system is just the ratio of the volume occupied by the polyhedral particles to the total volume of the simulation box.
Each pressure step of the expansion/compression run involved a total of MC cycles (as defined below) for both equilibration and production.
| Shape | Edge-length | Volume | ODP | MCP |
|---|---|---|---|---|
| Cube9 | 1 | 1 | 6.3 | 8 |
| Cuboctahedron19 | 0.707 | 0.833 | 7.1 | 14 |
| Sphere21 | 1 (diameter) | 0.524 | 11.5 | - |
| Truncated Octahedron9 | 0.354 | 0.5 | 14 | 28 |
Each MC cycle consisted on average of N translational, N rotational, N/10 flip, N/20 swap and 2 volume move attempts. Flip moves attempt to rotate a chosen particle to a random orientation in the plane perpendicular to its present orientation. Swap moves involved picking randomly two particles, one of each species, and attempting to swap their positions as well as orientations (since such moves are more likely to succeed with swapped orientations). Swap moves are essential to speed-up the equilibration process by allowing particles to move arbitrarily far from their original positions circumventing the slow diffusion associated with dense phases. Swap moves, however, can only be effective if the particle shape and size of the two components is similar and densities are moderate to allow some wiggle room around a lattice site to accommodate different particle shapes. At pressures where the system is ordered (as obtained in trial runs), the volume moves were allowed to be triclinic 9. The size of the move perturbations was adjusted so as to get an acceptance probability of 0.4, 0.4 and 0.2 for the translation, rotation and volume moves, respectively. Although the size of the pressure steps was not fixed, a typical value of near the phase transition was approximately 0.8, 1.3, 0.8 and 1.6 for CS, CTO, COC and COTO mixtures respectively. All trial moves are accepted according to the Metropolis criterion 22 (which for hard-core interactions requires the absence of overlaps, checked via the separating axes theorem23 for any two polyhedra or Arvo’s algorithm for the cube-sphere case 24).
Interfacial simulations where two phases and the intervening interfaces are present in the same box were used to estimate coexistence conditions. To facilitate the formation of distinct bulk regions, the box was at least four times more elongated along one direction that the others, so that the interfaces would form perpendicular to that axis. Once interfaces form, the longitudinal pressure (i.e., the one acting on a plane parallel to the interfaces) provides the proper estimation of the coexistence pressure since the transverse pressure contains a contribution from the surface tension 25. Thus, in such cases we chose the transverse box length (which sets the dimensions of the interface) to be commensurate with the lattice spacing for the individual phases at the given pressure, only sparingly allowing changes in transverse dimensions to help relieve any build-up of stresses. Especial care must be taken when dealing with interfacial simulations involving two solid phases where the box cross section (perpendicular to the long axes) must be chosen so that it can properly accommodate the unit cells of the distinct crystal lattices. Unfortunately, this is hard to achieve over a wide range of pressures. Hence, although triclinic volume moves did allow for box deformations that can rotate the lattices to alleviate internal stresses, our results in such regions are expected to have larger errors than at lower pressures.
Unless otherwise indicated, interfacial simulations were performed for an equimolar global composition as it was expected that, if phase separation occurs, the compositions of the coexisting phases would be relatively symmetric (on account of the particle-size similarity) and hence lead to similar amounts of the two phases. To estimate the equilibrium bulk densities of the two phases in an interfacial simulation, we used density profiles along the z-axis to mark the bulk regions.
We calculated the and bond-order orientational parameters 26 to probe and monitor translational order. These parameters are defined as:
| (2) |
where is given by
| (3) |
where are spherical harmonics for the position vector . Although the values of these order parameters are sensitive to the crystal structure, is generically a good descriptor of crystallinity, since its value increases monotonically with order. The value of the order parameter gives additional information about the type of crystalline structure present in the system; i.e., larger values are associated with cubic symmetry.
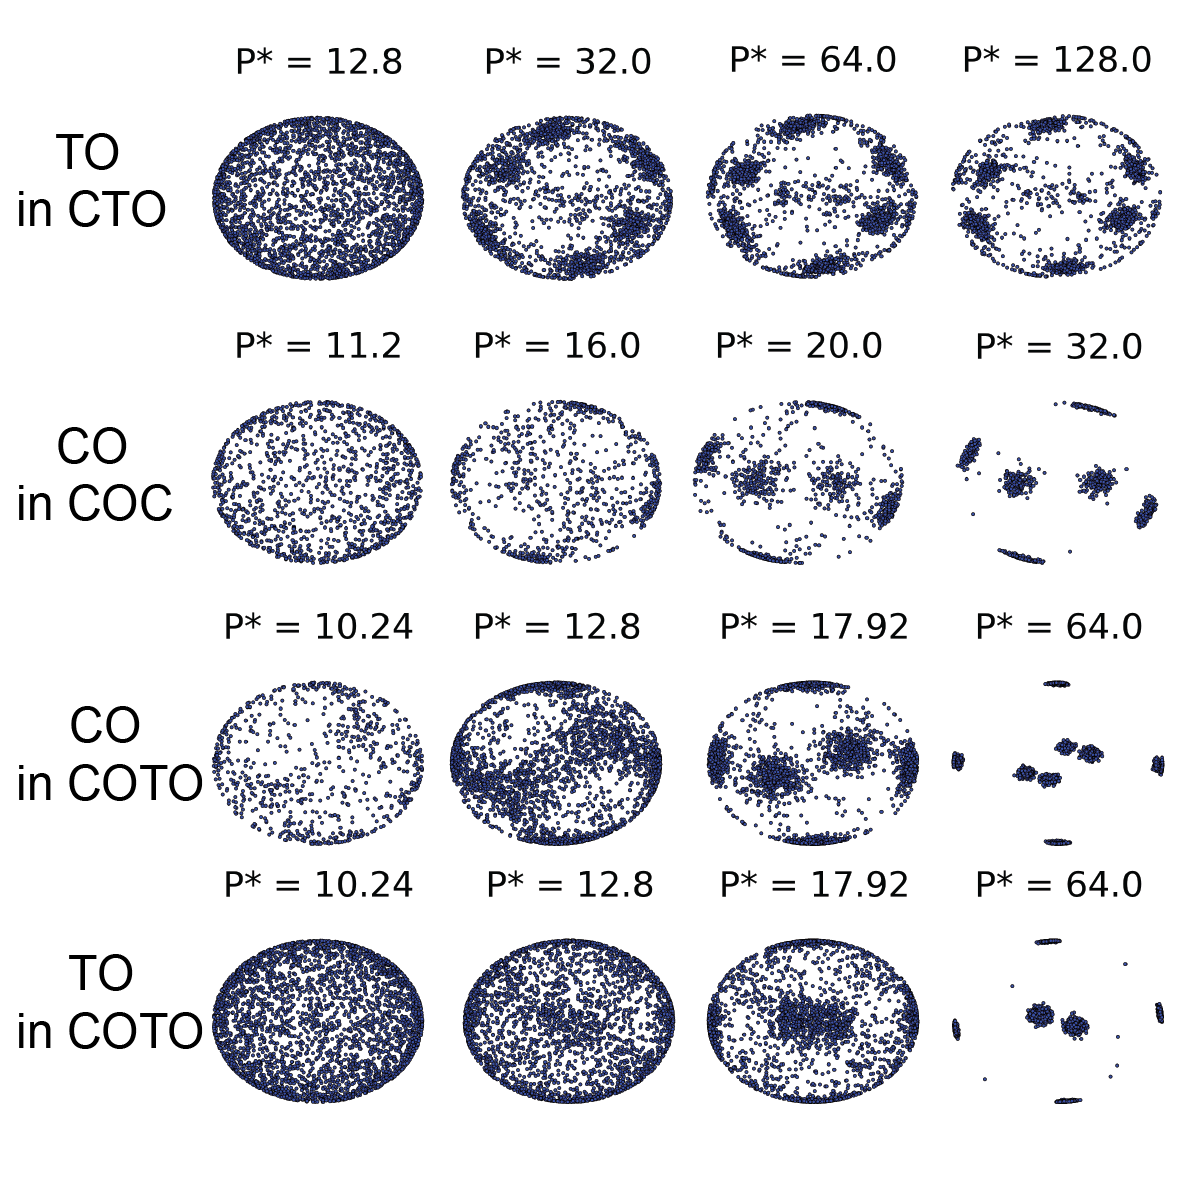
To determine the orientational order in the system, we calculated the cubatic order parameter12 which gives information about cubic-like orientational order. To mark the boundary between the rotator mesophase and the crystalline phase, we used a combination of the order parameter and the orientational scatterplots. Since such a transition is continuous, we set the upper limiting value of the rotationally disordered phase to be 0.3 (note that the maximum value of for perfect cubic order is 0.583). The scatterplots were generated by plotting the orientational axes of each the particles on a unit sphere. In these scatterplots, a mostly uniform distribution of points signals the absence of orientational order, which along with the presence of translational order (estimated through the order parameter) identifies a rotator mesophase. A patchy pattern gives the signature of a particular orientational-order symmetry, which is absent in a rotator mesophase. A set of representative scatterplots for the systems studied here are shown in Figure 3.
3 Results
3.1 Cubes + Spheres (CS) Mixture
As previously indicated, this system represents a base case of components with widely different shapes and monodisperse phase behavior. Cubes exhibit a mesophase27 for a small range of volume fractions (0.51-0.54) which separates isotropic and cubic crystalline phases9. There is disagreement in the literature 2829 about the precise nature of such a mesophase, which hinges on the criterion adopted for classifying a phase as being crystal-like or liquid-crystal-like. For the range of volume fractions specified above, while the average particle positions are crystal-like (despite a high vacancy content), the variance of the position fluctuations and particle mobilities are liquid-like 19. Since the current taxonomy is not completely satisfactory, for concreteness we will henceforth refer to this mesophase as cubatic. Spheres on the other hand, show a single phase transition from isotropic to FCC crystal. While spheres have full rotational symmetry, cubes do not and possess a relatively large asphericity (= ratio of circumradius to inradius = 1.732). In our simulations, the side of cubic particle was set to be equal to the diameter of the spherical particle.
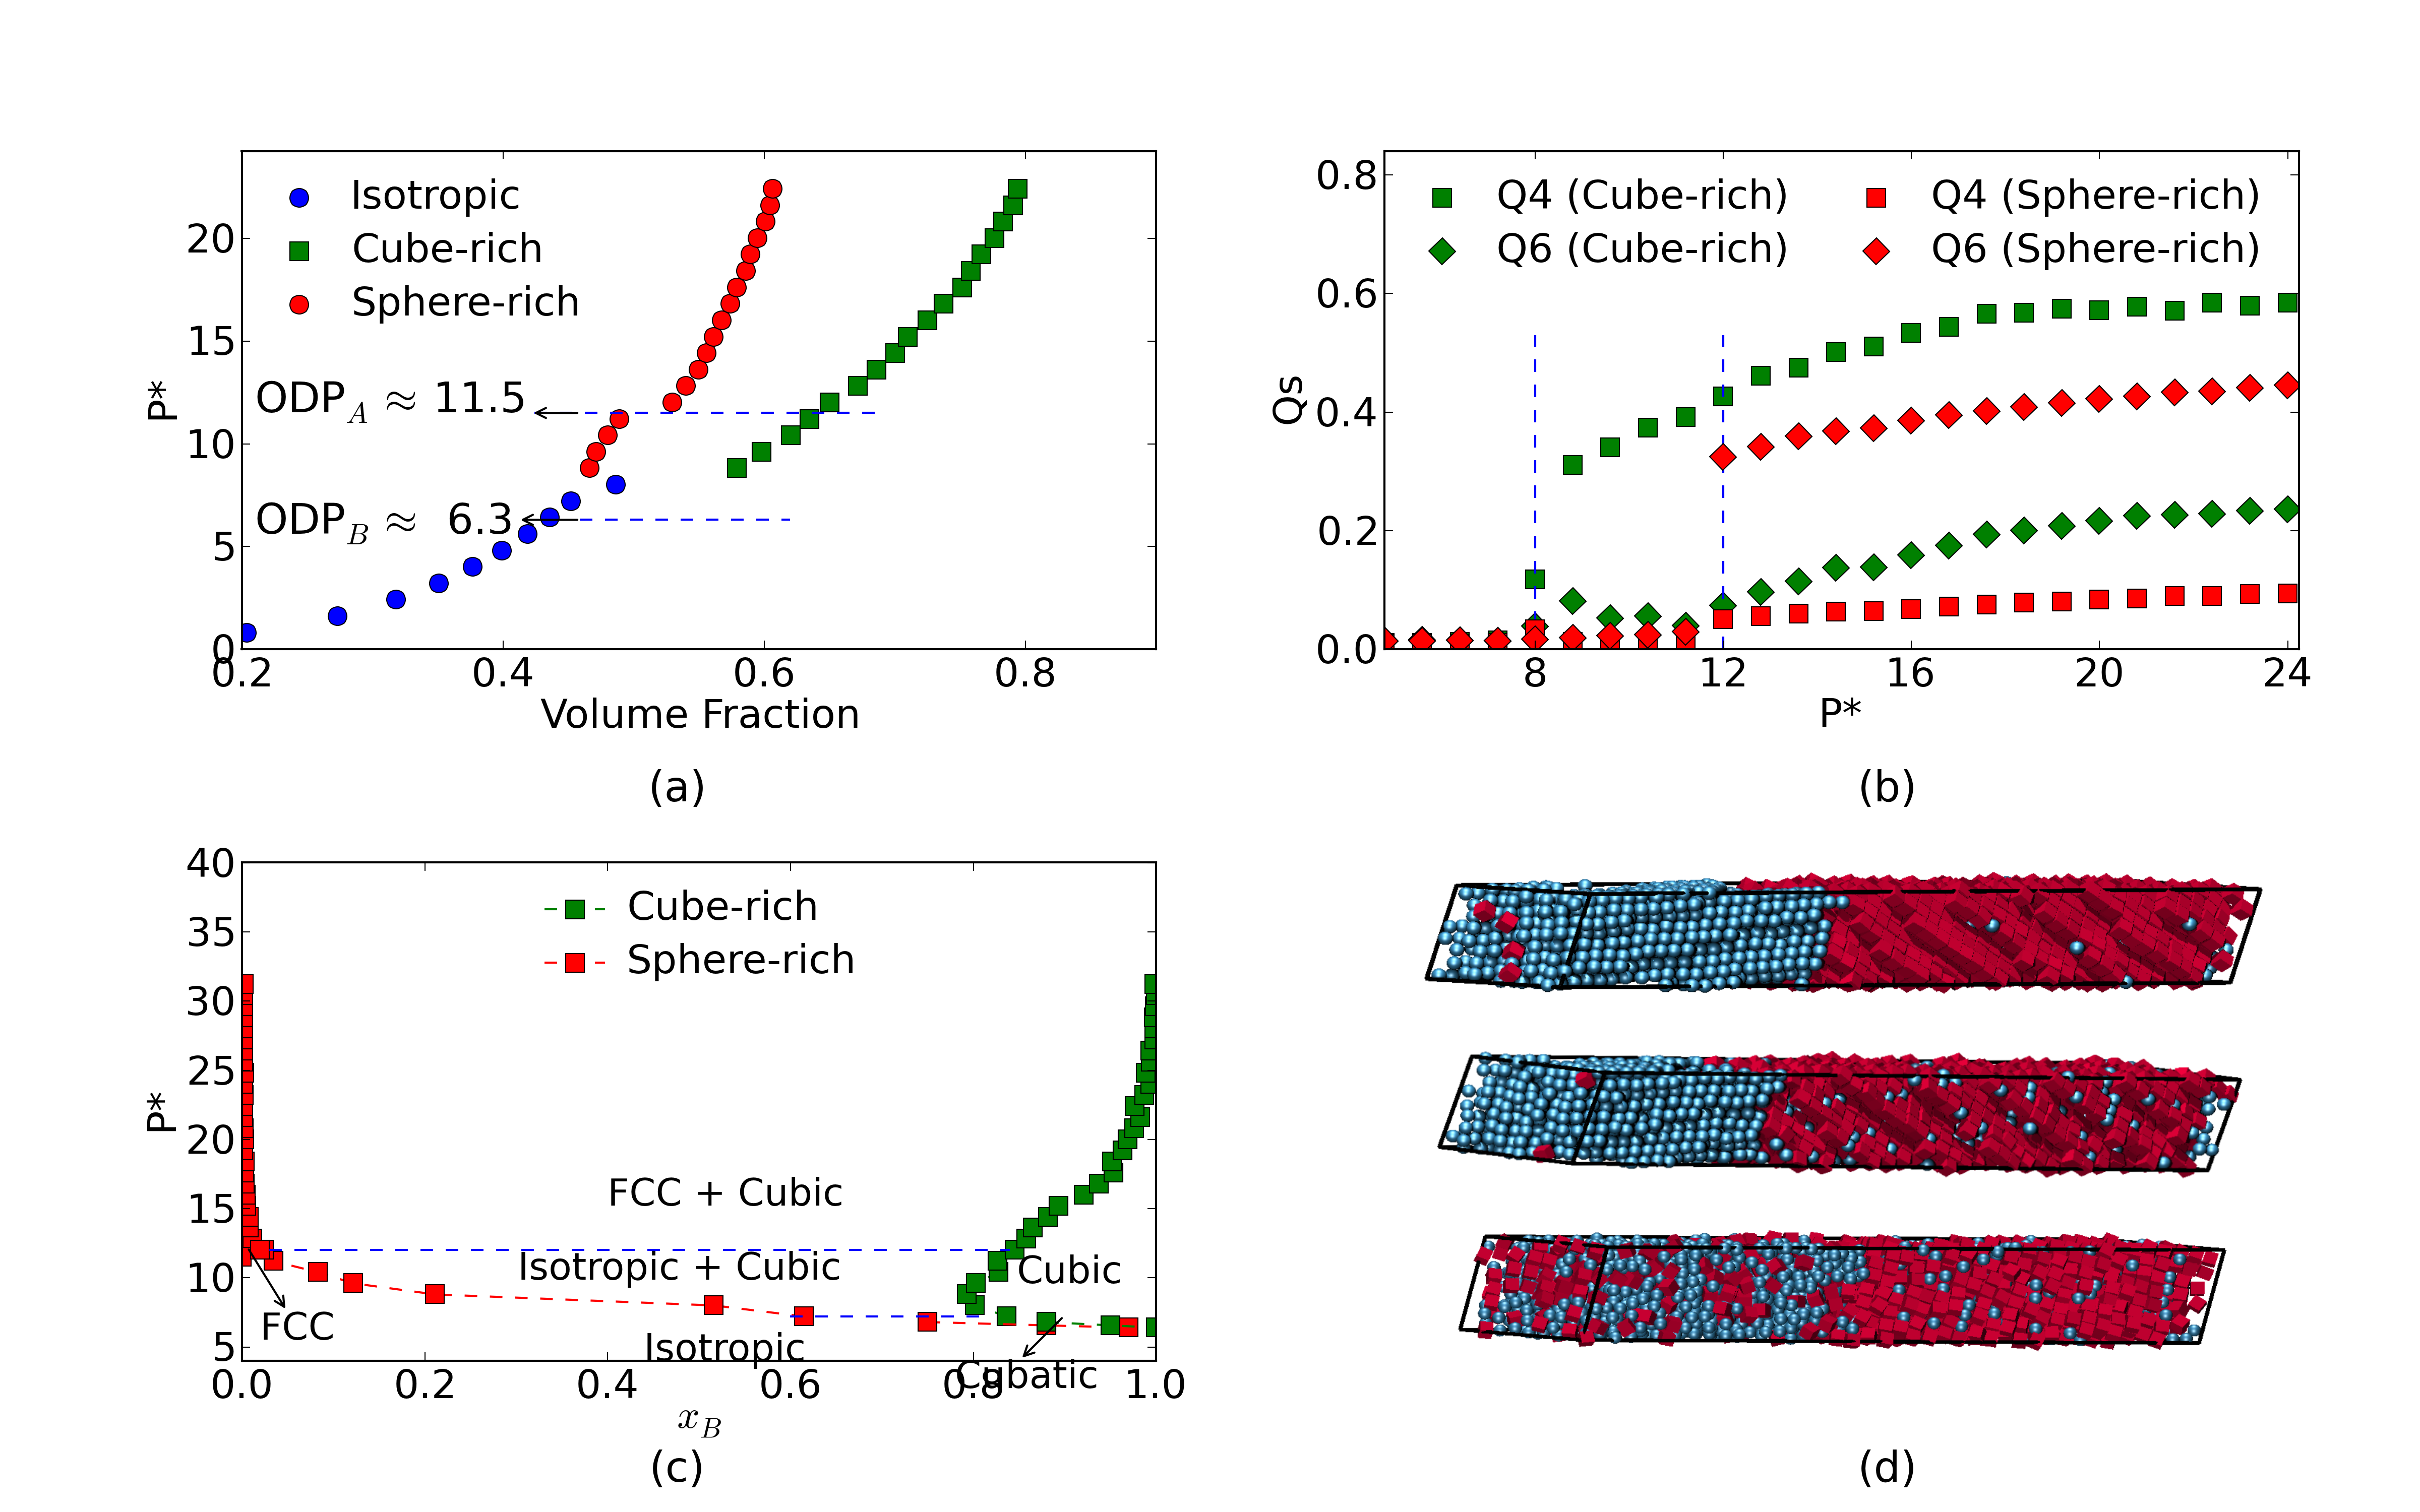
Extensive MC runs for the equimolar mixture exhibit an isotropic, fully mixed phase, up to P* 8, close to the MCP for cubes. Thus as phase separation ensues above P* 8, the cubes are already in a crystalline state, while spheres are still disordered. At a pressure P* 12, the spheres order, a value which is only slightly higher than the ODP for pure spheres (). Note that generally, for any A+B mixture, the apparent ODP in the A-rich phase is expected to be near but slightly above the ODP of the pure A system because of the disordering effect of the B particles present; our observations are consistent with this expectation.
We demarcate the putative cubatic region by a combination of increased order parameter and high translational mobility. We estimate the latter by calculating the mean square displacement (in a pseudo-dynamic setup) during compression runs at different pressures. A high value of translational mobility coefficient9 marks a region of cubatic phase. Mapping out the region of cubatic behavior was not possible for the global-composition system as the cube-rich phase formed by phase separation at even the lowest pressure already had the cubes in a cubic lattice (with ). We therefore performed additional simulations at to number composition of cubes at pressures just below the phase separation pressure. This helped us better define the isotropic-cubic and isotropic-cubatic boundaries in the phase diagram.
The approximate Pressure vs. Composition phase diagram is shown in Figure 4. Note that even the ordered phases of each of the individual species allow a certain extent of mixing with the other species. Further, the cube-rich phase solvates significantly more spheres than the sphere-rich FCC phase solvates cubes. This asymmetric solvation capacity seems to be primarily the result of both our choice of particle size ratios which gives cubes a larger volume (and excluded volume) than that of spheres, and the geometry of the respective lattice spacings. Indeed, a sphere can readily replace a cube without overlap (if placed at the same center of mass) but not the other way round. Consequently, mixing entropy favors cubic phases where numerous spheres are allowed provided they do not take away the packing entropy gains associated with the overall cubic order. Conversely, cubes are only allowed in the FCC sphere-rich phase as long as they can appear as very dilute localized defects that do not compromise the overall structural order.
In the bigger picture, this mixture can be seen to represent a ‘base case’, of particles with very distinct shapes and incompatible lattice structures. In this scenario, although there is certain amount of mixing at intermediate concentrations, the ordered phases and the transition pressures remain quite similar to those of the pure components. This is expected since the two shapes are different enough that the mixing entropy to be gained from their intermingling is outweighed by the packing entropy lost due to the incompatibility of lattices.
3.2 Cubes + Truncated Octahedra (CTO) Mixture
This mixture represents a case of two space-filling polyhedra, which have incompatible crystal structures. While cubes form a cubic lattice in their ordered state, truncated octahedra (TOs) form a BCC tessellation. Further, pure TOs exhibit a rotator mesophase as an intermediate between the liquid and the ordered crystal phase. Figure 5 shows the main results for this system with Fig. 3 also showing some relevant scatter plots (in the top row).
Upon extensive compression and expansion MC runs, the CTO mixture is observed to form a uniform isotropic phase at low volume fractions up to where two phases emerge: a cube-rich cubic crystal and a TO-rich isotropic phase.
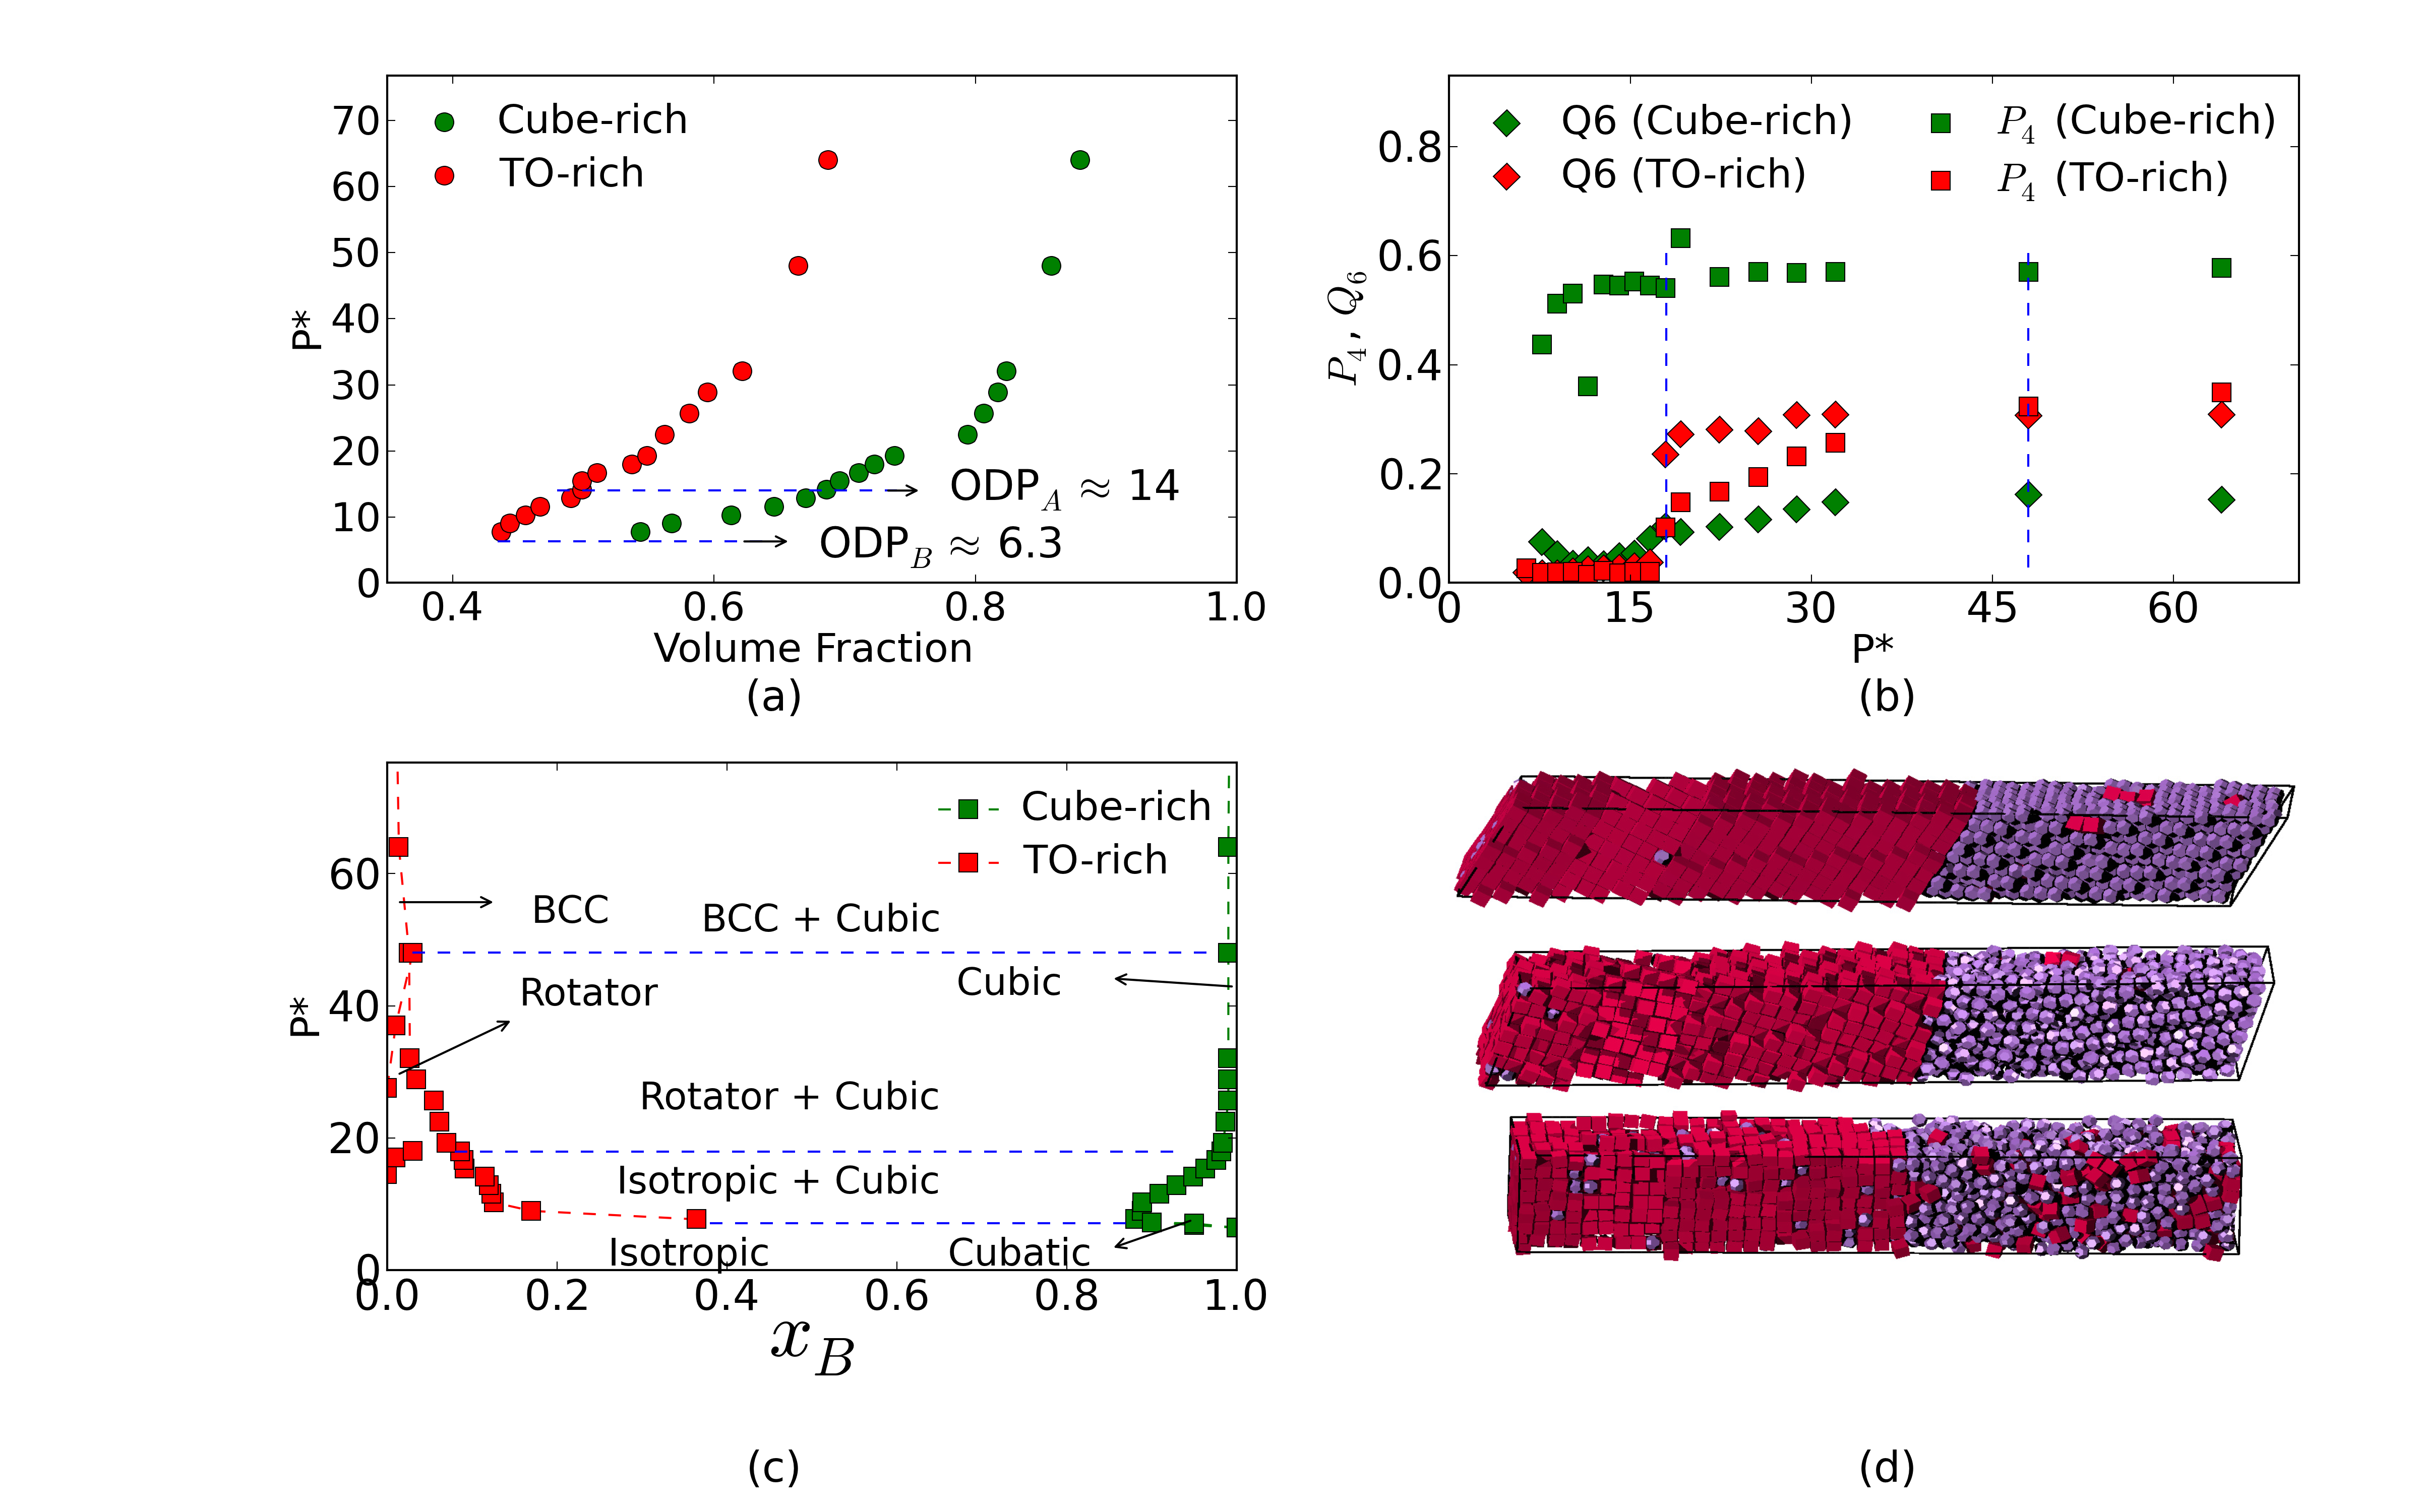
At P* 18, the TO-rich phase is seen to transition into a rotator mesophase, a value larger than that for pure TOs which form a rotator mesophase at P* 14. This difference is expected since the presence of cubes in the TO-rich phase should make ordering more difficult and drive the ordering pressure upwards. The onset of the positional order in the rotator mesophase is pinpointed by calculation of order parameter, which shows a sudden jump in for the TO-rich phase.
At P* 50, the TO-rich phase achieves a crystalline BCC order (found through and values) and orientational order (found through values and orientational scatterplots), a pressure that is again larger than that for pure TOs which gain crystalline BCC at around P* 28. To better define the cubatic region, we again perform independent runs away from the 50 number composition (between and ) and assigned a cubatic character to systems exhibiting both high values and a high particle translational mobility.
As seen in Figure 5(c), neither the cube-rich nor the TO-rich crystal phases allow a significant concentration of the other species. The saturation compositions tend to be symmetric; e.g., at intermediate pressures the cube-rich phase saturates with approximately 1% TOs and the TO-rich phase saturates with about 1% cubes. In a way, the CTO mixture shows less inter-species miscibility than the CS mixture. This could be because: (1) a slightly larger size disparity reduces the entropic gain obtained from mixing entropy as the pressure increases, and (2) the space-filling TOs are less tolerant of impurities (cubes) than spheres (which are non-space filling). This question is revisited in Section 4.
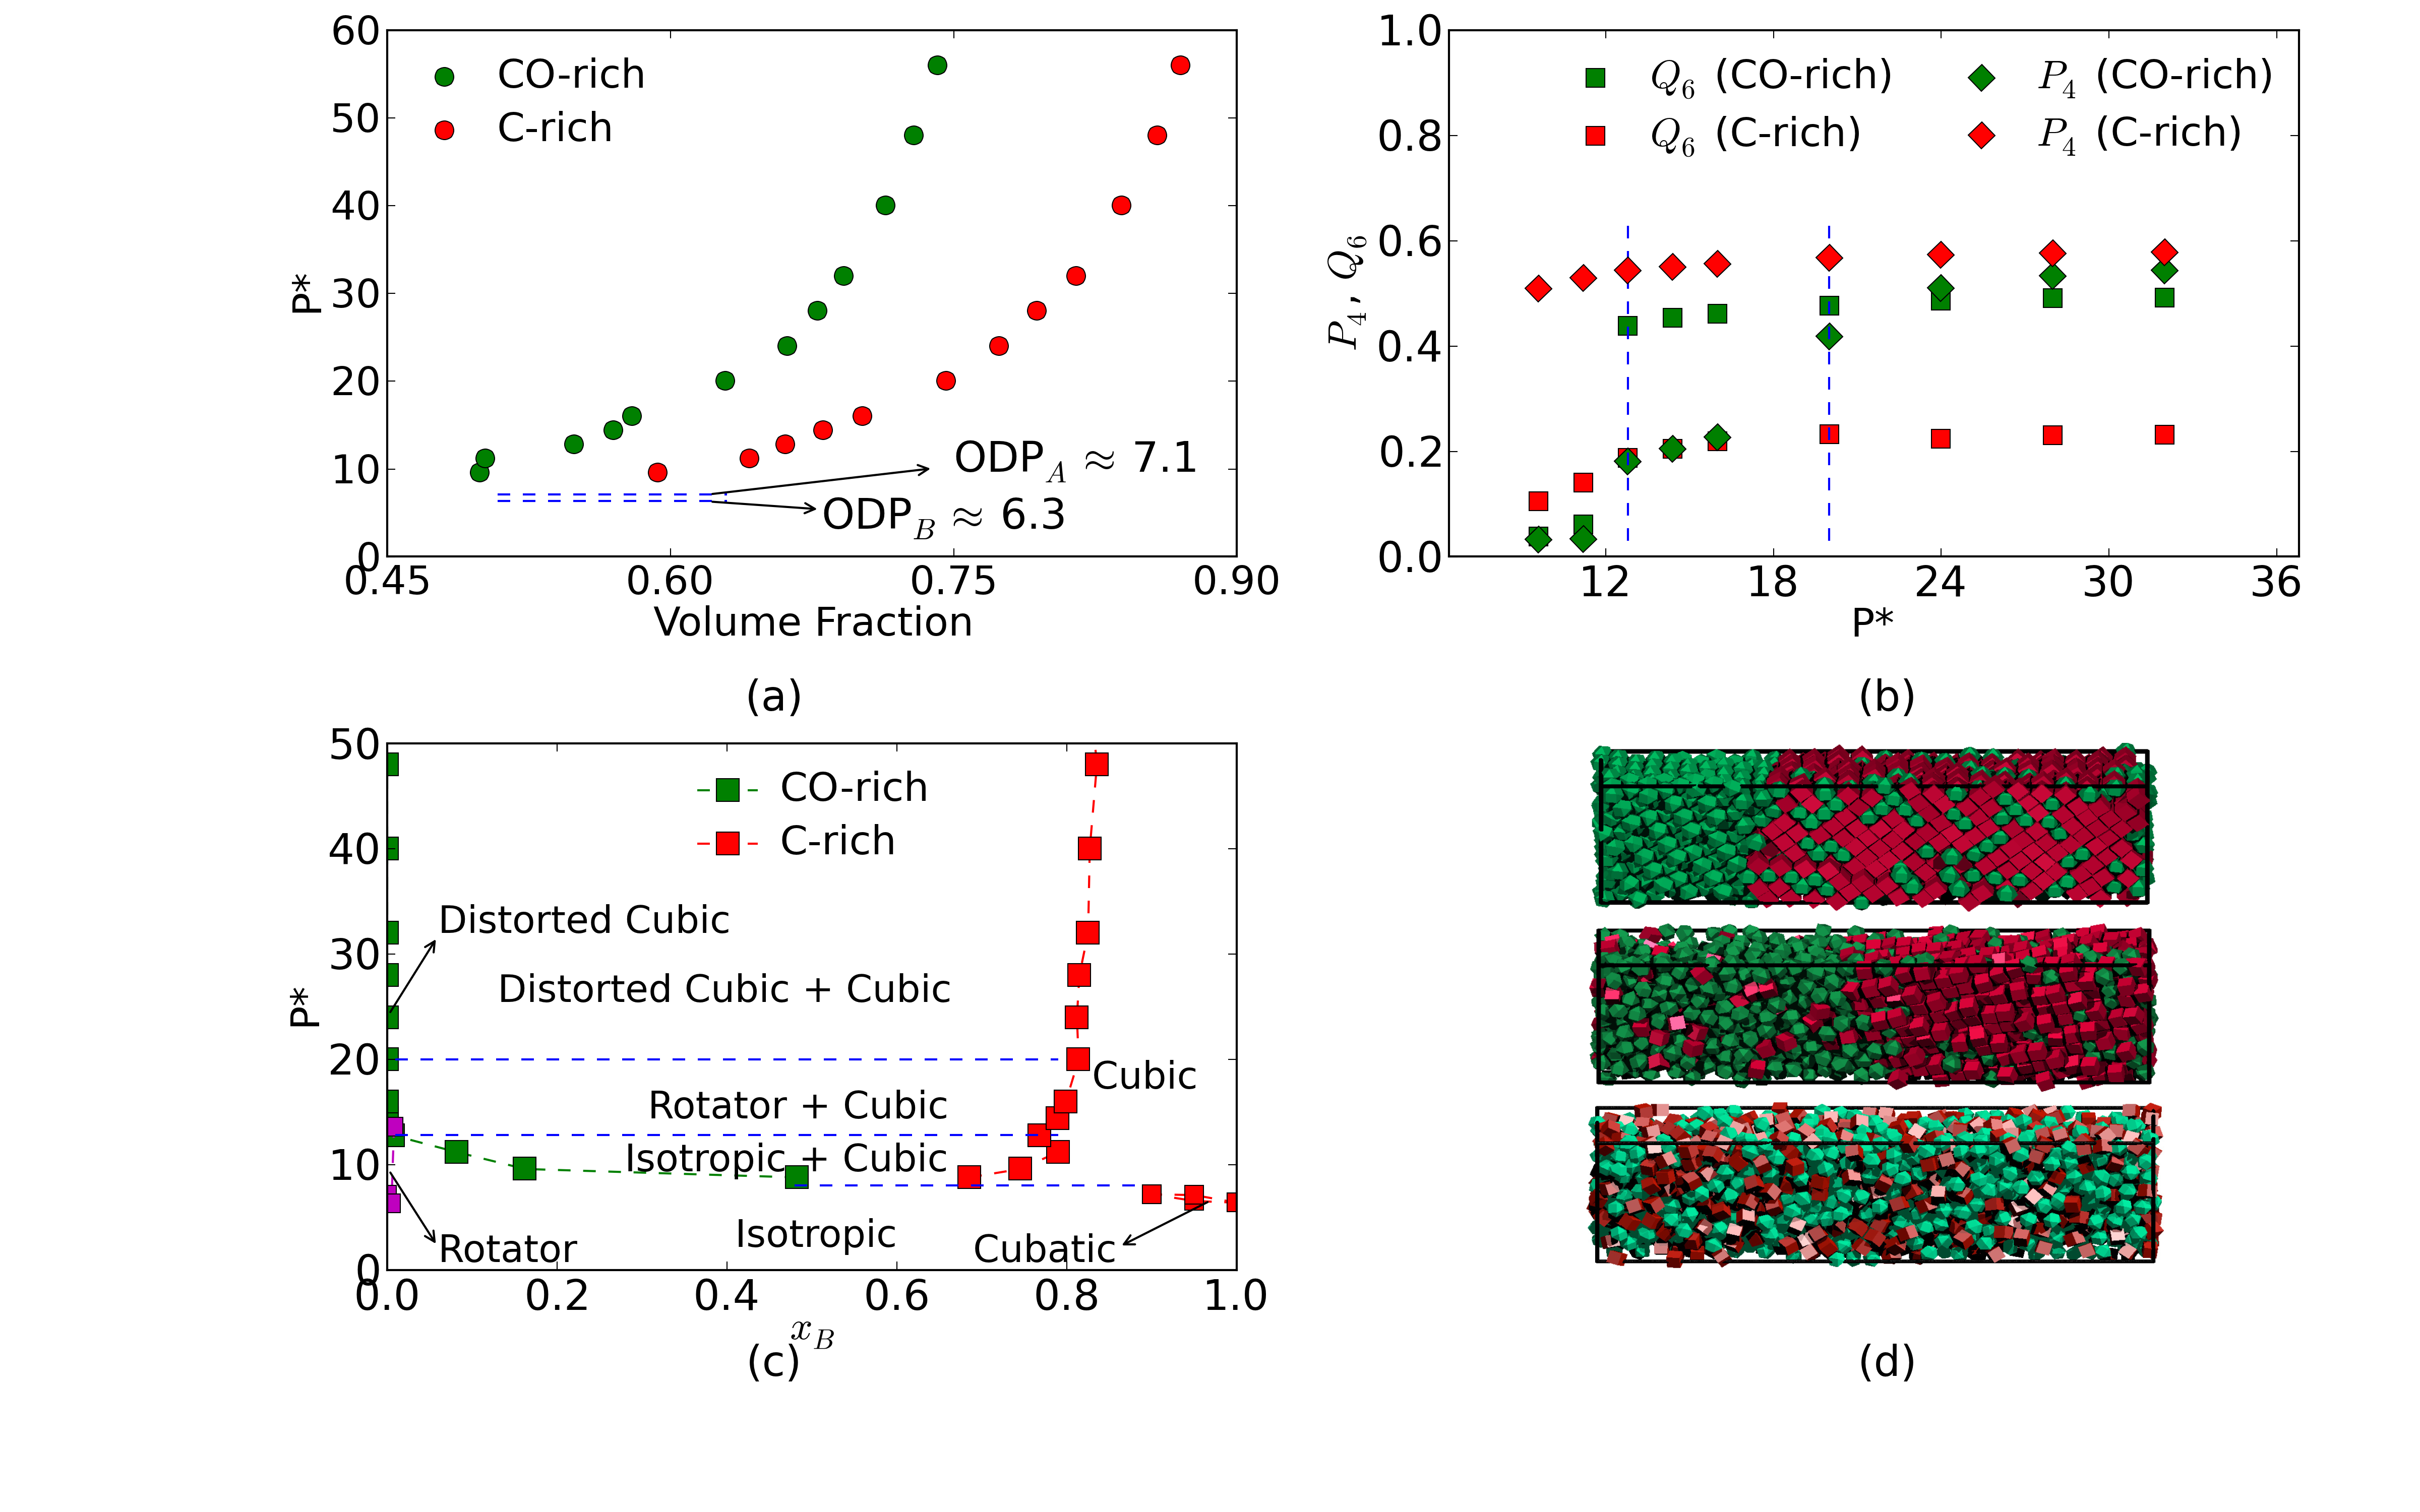
3.3 Cuboctahedra + Cubes (COC) Mixture
The components of this mixture have some key similarities and differences with those of the CTO mixture. Like TOs in the CTO mixture, cuboctahedra (COs) in the COC mixture also exhibit a rotator mesophase over a significant range of volume fractions, before going into a crystalline phase. The crystalline phase for pure COs, however, is a distorted cubic phase unlike the BCC crystal exhibited by pure TOs. More importantly, the two species in the COC mixture are quite close to each other in size, with a volume ratio of 0.83 (in the CTO mixture this ratio is 0.5). Our main results for this system are shown in Fig. 6 (see also Fig. 3 for some sample scatterplots).
Compression and expansion MC runs show phase separation of the mixture at P* 9, just above the MCP for cubes. Hence, phase separation upon compression of the isotropic phase gives rise to a CO-rich isotropic phase and a cube-rich cubic crystal. At P* 14, the CO-rich phase transitions into a rotator mesophase, as evidenced by a sudden rise in the value of the order parameter. For pure COs, this transition happens around P* 7. As the pressure increases to around P* 20, the CO-rich phase undergoes another phase transition from rotator to crystalline phase, while the same transition happens at P* 14 for pure COs.
An important difference observed in the Pressure vs. Composition phase diagram for the COC mixture (Fig. 6 (c)) as compared to the earlier mixtures is the relatively large saturation concentration of COs in the cube-rich phase (reaching about 30%) even at high pressures. This enhanced mixing may partially arises due to the COs gaining packing entropy by following orientations compatible with those of neighboring cubes. Further, near-equal volumes of the two phases imply that the packing entropy cost of allowing a CO-impurity in cubes is minimal. As in the previous systems, the low solubility of cubes in CO-rich phase is related to the bigger size of the cubes that makes them hard to be accommodated as guests in the CO-rich phase at high densities. See further analysis in Section 4.
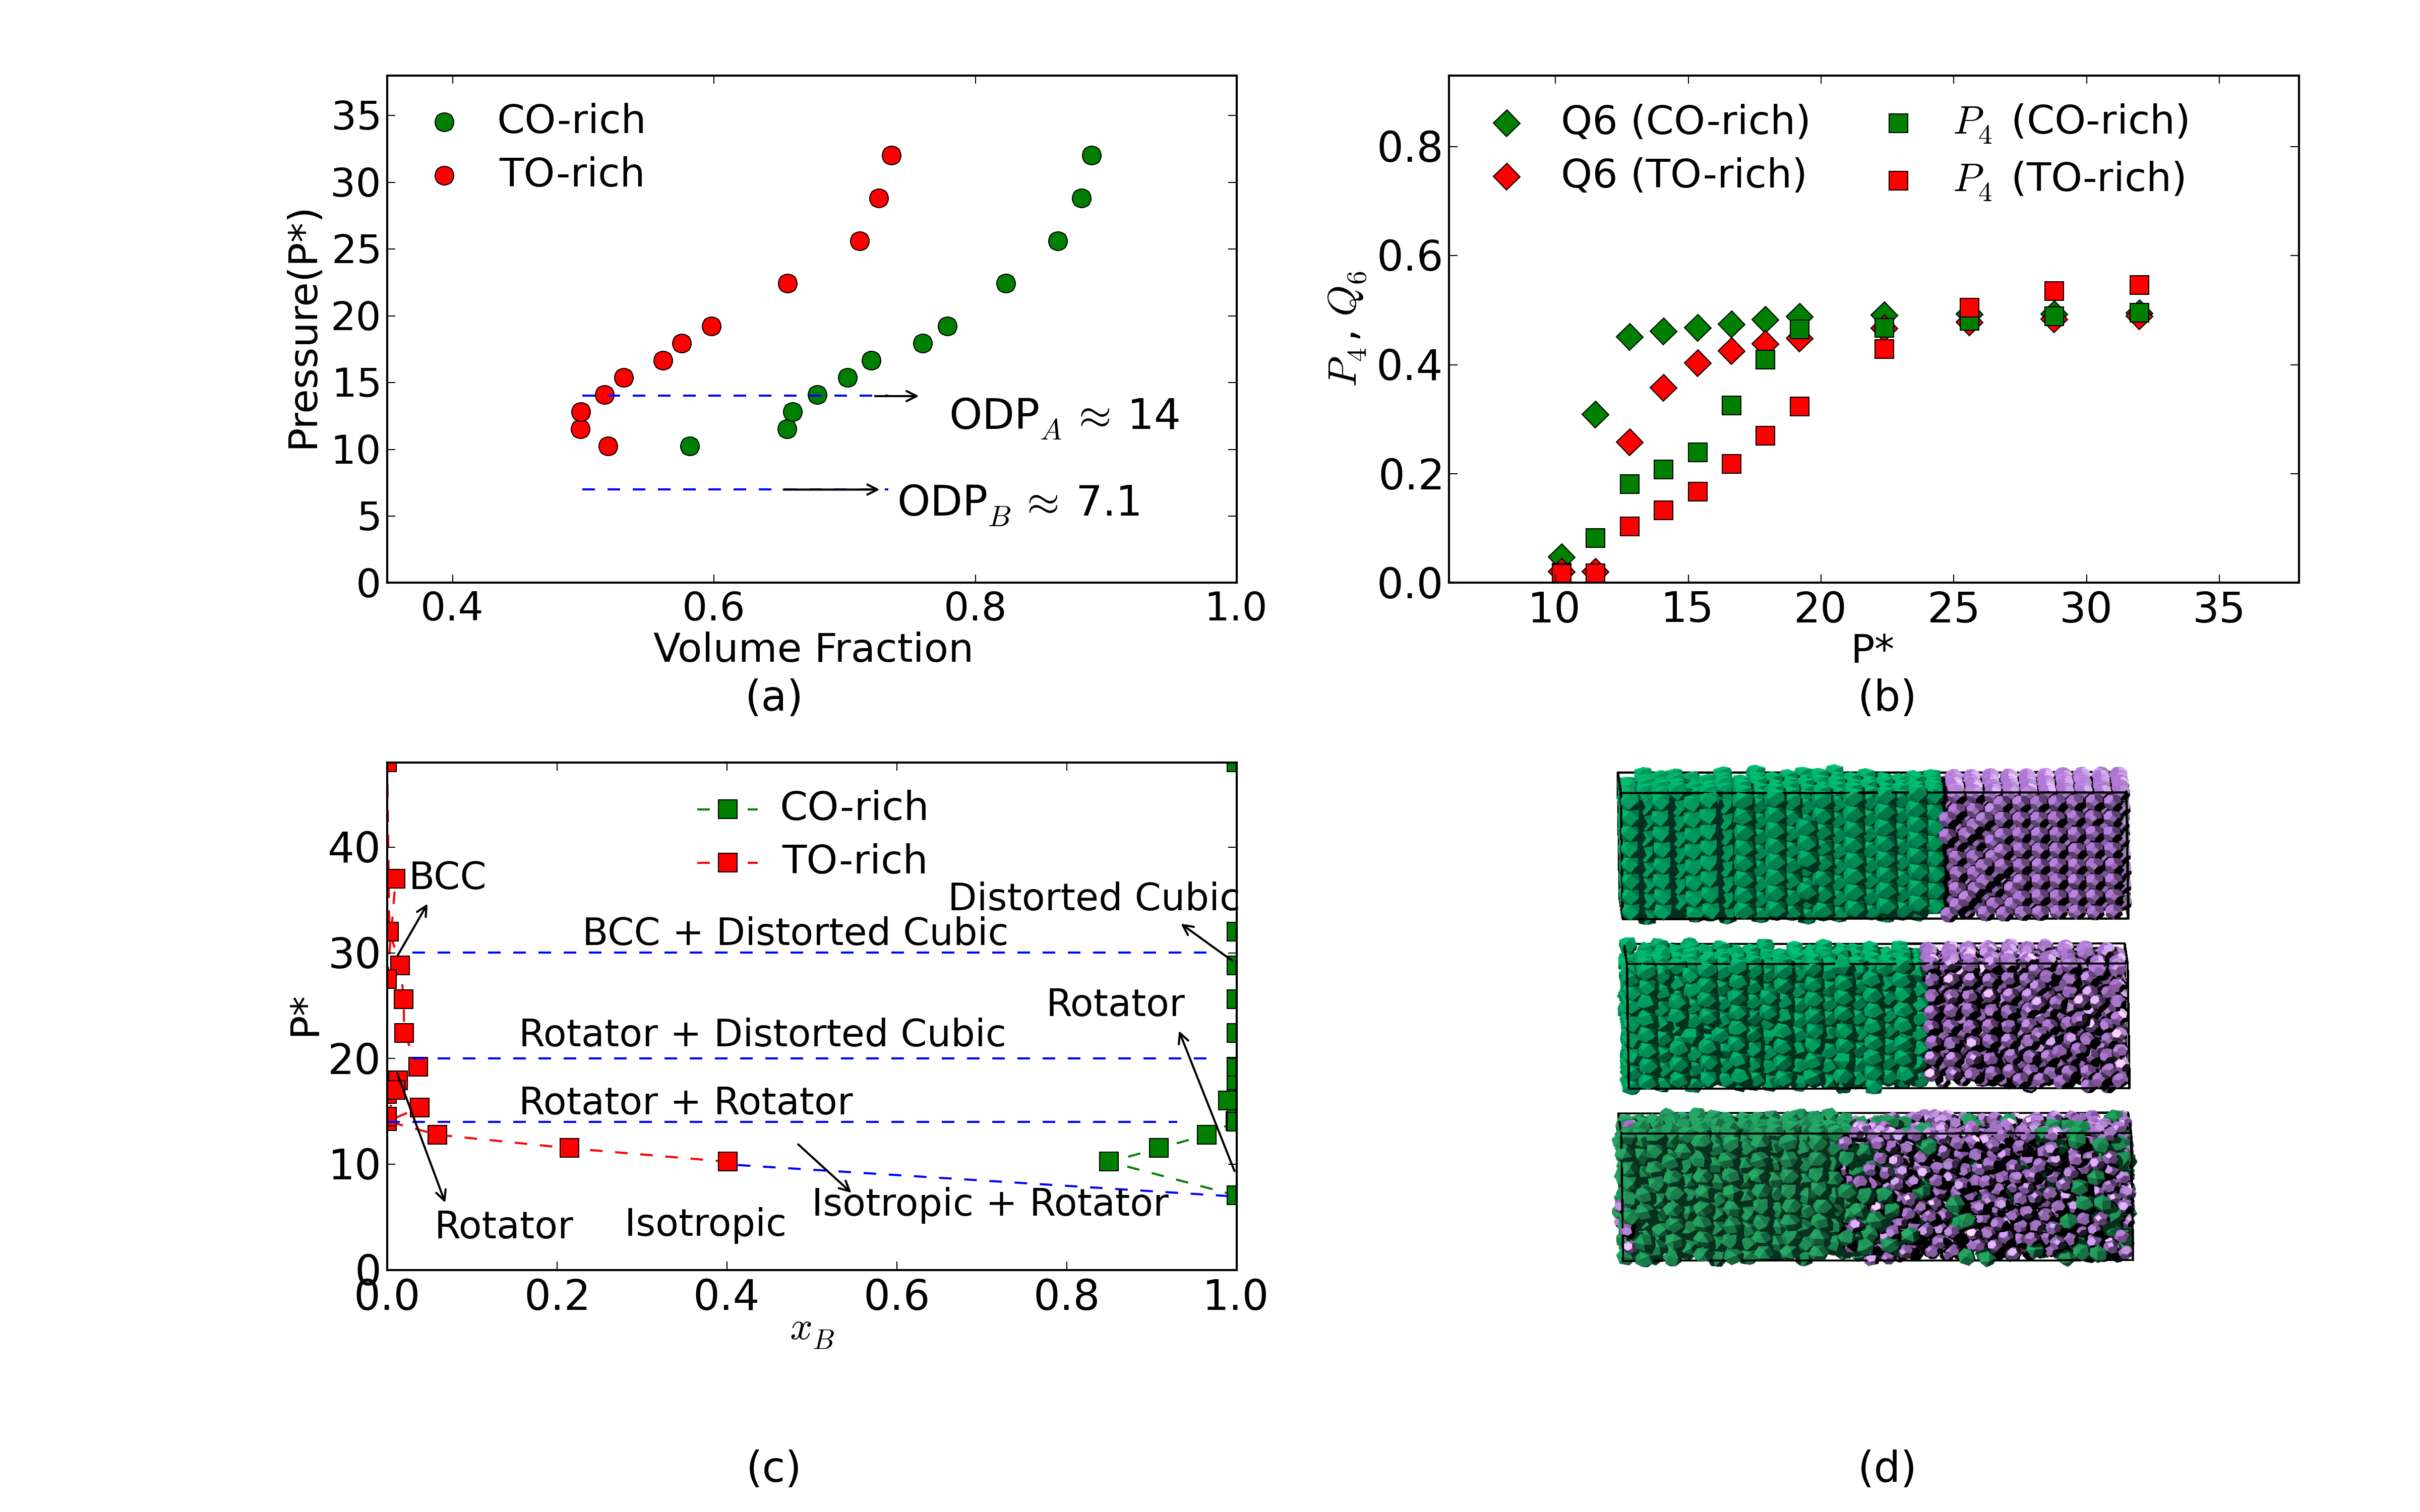
3.4 Cuboctahedra + Truncated Octahedra (COTO) mixture
The COTO mixture represents a case where the two shapes involved are similar in terms of their individual phase behavior. Further, they are neighbors in shape evolution (during polyol process). While truncated octahedra form a BCC tessellation, cuboctahedra arrange in a distorted cubic lattice which is non-space-filling. However, both shapes show a rotator mesophase for a wide range of volume fractions.
While one could have expected these two shapes to be the most miscible of the mixtures considered here, our simulation results shown in Fig. 7 (and in the relevant scatterplots of Fig. 3) provide evidence to the contrary. This is primarily because although the similarity between shape and individual phase behavior could promotes miscibility, the size ratios adopted here (based on the polyol process) make cuboctahedra significantly bigger than truncated octahedra. Both the volume ratio (1.6) and the ratio of the radii of their circumspheres (), translate into a twofold difference in the components ODP values (see Table 1) and a scant miscibility.
MC compression runs, which start from an isotropic liquid state fail to phase-separate and instead get kinetically trapped into a disordered state. It appears that at pressures where the mixture would prefer phase-separating, the mixtures is already too dense for a well-mixed system to demix and phase-separate. However, expansion runs started from two-phase ordered configuration (with individual shapes ordered in their corresponding crystal lattices) is observed to be stable in a two-phase state down to very low volume fractions. We thus use expansion runs in this case to estimate thermodynamic phase behavior. The fact that the compression and expansion runs yield different results at high pressures signals lack of ergodicity (assumed to be more severe for the compression process). While unphysical MC moves like particle-swaps help overcome diffusion barriers to compositional equilibration, more elaborated moves may be needed to speed up structural equilibration (and the nucleation of translational order).
Below P* 30 (which is slightly above the MCP for TOs), the TO-rich phase goes into a rotator phase while the CO-rich phase is still ordered in a distorted cubic lattice. Below P* 18, again slightly above the MCP for COs, the CO-rich phase too becomes a rotator phase. In a narrow region between P* = 13.5 and P* = 11.5, we see the TO-rich phase in an isotropic phase while the CO-rich phase remains as a rotator mesophase. Below P* = 11.5, the two phases mix to form a single isotropic phase.
As far as inter-species miscibility, in the small region (between P* of 11.5 and 13.5) where some miscibility occurs, COs are seen to be more miscible in the TO-rich phase than the other way around. This is expected since in that region the TO-rich phase is largely isotropic which makes the entropic cost of introducing a CO impurity in the TO-rich phase minimal. On the other hand, the CO-rich phase is positionally ordered and loses some packing entropy by hosting TO-impurities. This mixture demonstrates the fact that along with shape and individual phase behavior, the relative size of the particles can have a dominant effect on the mixture phase behavior.
4 Discussion of general trends and comparison to other systems
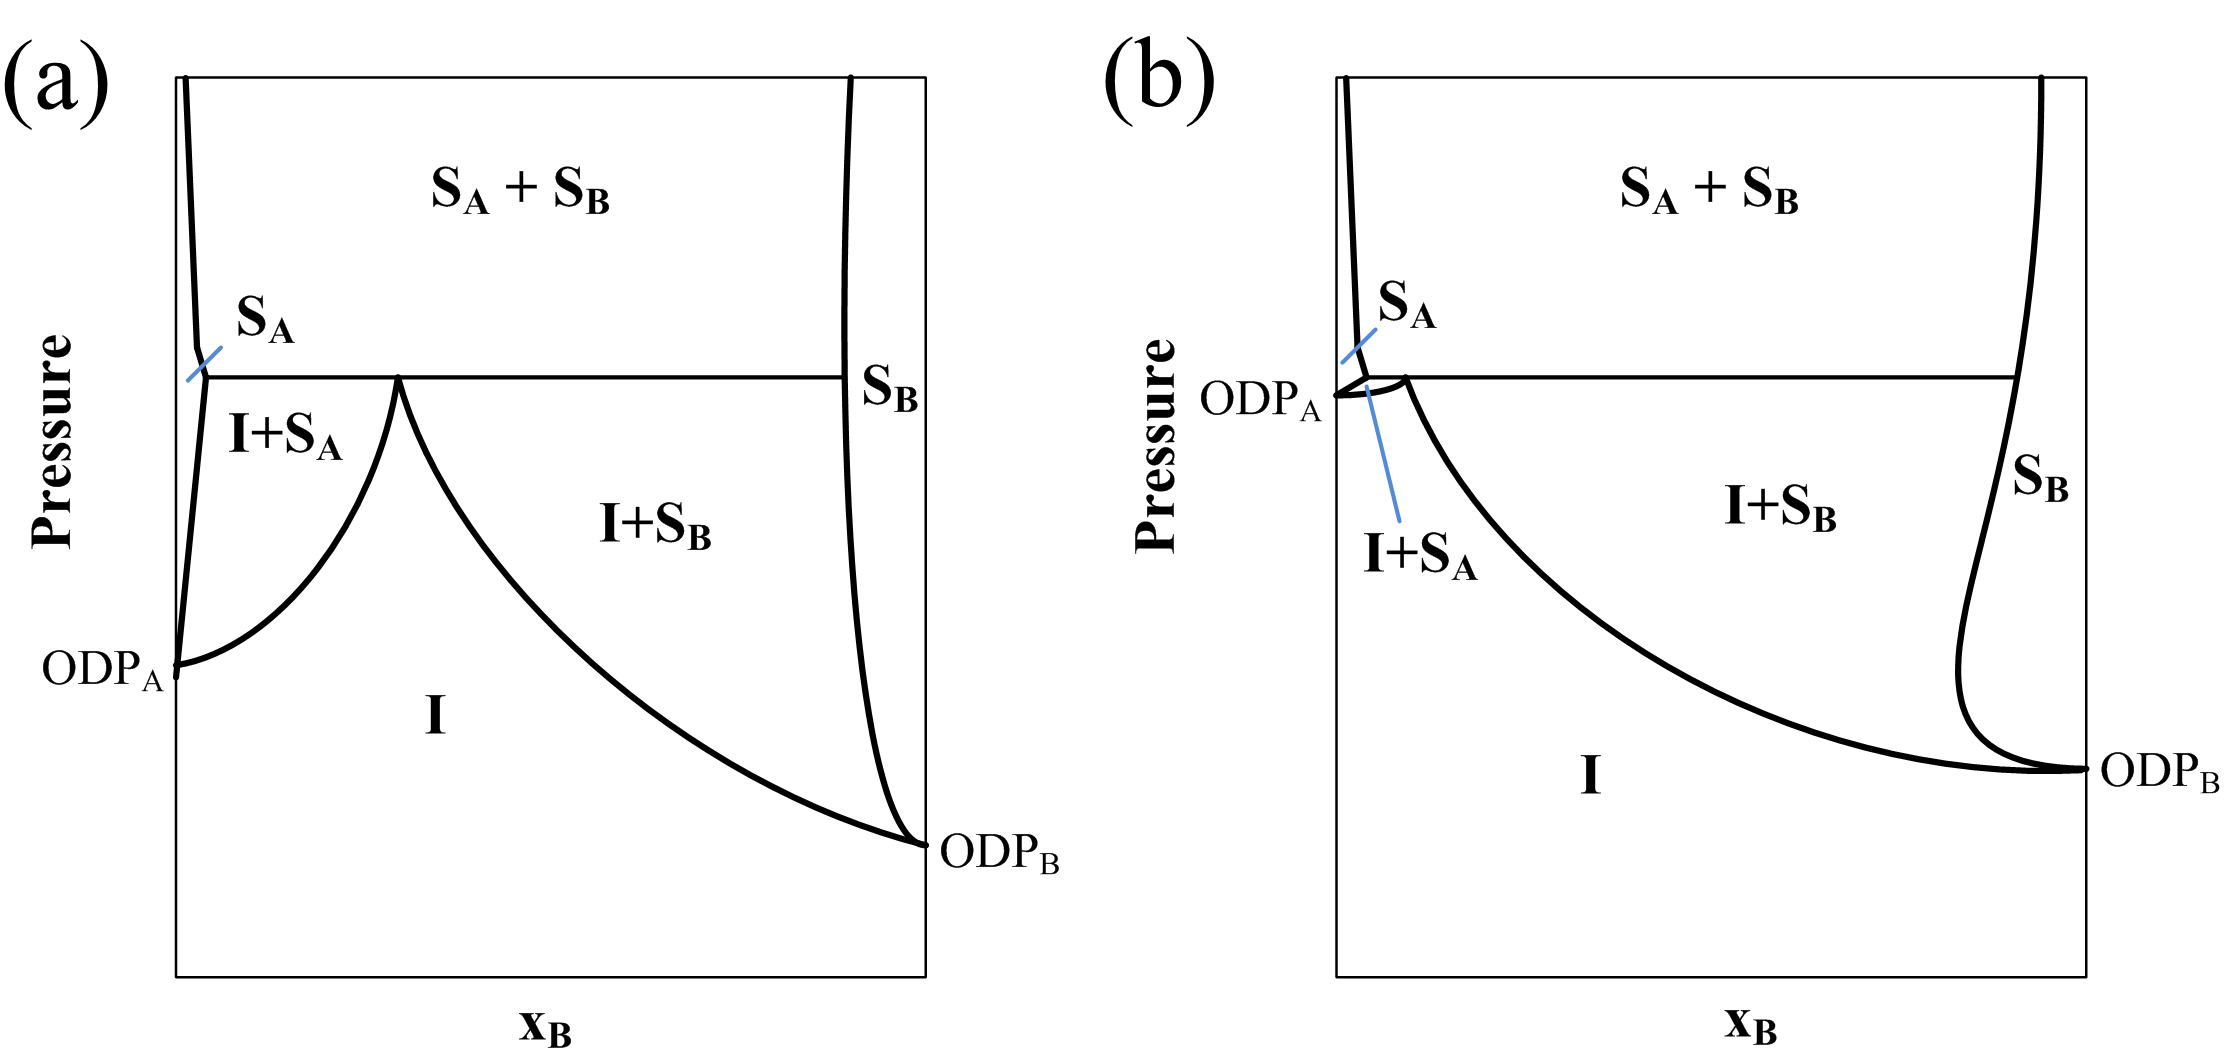
Systems CS, CTO, and COC constitute similar mixtures of a large component B, cubes, with a smaller component A that has moderate asphericity (1.5) and high rotational symmetry. The COTO mixture is slightly different but can also be cast as a A+B mixture with the TO and CO corresponding to species A and B. Overall these mixtures seem to exhibit a eutectic type of phase behavior, akin to that formed by binary A+B mixtures of hard spheres whose size ratio (=diameter of A/diameter of B) is different enough (say 0.85) so that at high pressures they tend to phase separate into two incompatible FCC lattices3031. Figure 8 shows a qualitative diagram for such a case along with one that encapsulates the behavior observed in the CS, CTO, and COC systems. Note that our simulations were unable to resolve neither the position of the eutectic point (which in all cases seems to be near zero cube composition) nor the very small isotropic+solid A phase coexistence region. Despite the quantitative disparities in the diagram proportions and the differences in the lattice symmetry of the ordered phases, the physics underlying the phase diagrams (a) and (b) in Figure 8 is the same: just like in our systems, in the mixture of hard spheres phase separation at high pressure is driven by the maximization of packing entropy that results from forming two distinct efficiently-packing solid phases. At intermediate pressures where (only) the pure B system would solidify (as it has the lower ODP), a B-rich ordered phase must form which hence coexists with an isotropic phase within a large two-phase region. In this context, the fact that in our systems one or the two components have flat facets does not fundamentally change the overall picture, that merely leads to ordered structures that depart from the ones favored by spheres. Also, the fact that our systems exhibit mesophases (that precede the perfect crystal at high pressures) does not add anything fundamentally new in the character of these diagrams since all mesophase-crystal phase transitions are continuous and hence such mesophases simply occupy the lower-pressure portion of the A-rich or B-rich solid regions.
Another general trend relevant to the CS, CTO, and COC mixtures (excluding now the COTO mixture) relates to the correlation between component relative sizes and inter-phase solubility (i.e., how much of A can be dissolved in a B-rich phase and vice versa). Here cubes (the common component) can be taken as the reference whose size sets not only a reference unit length but also a common baseline to directly compare pressure values. In such a case, the pure components rank in order of decreasing size ( volumes) as cubes, COs, spheres, and TOs, which is also the order of increasing ODPs. This shows that the ODPs are more strongly affected by differences in particle size (than in particle shape). To examine how the saturation solubilities compare for the same pressure across mixtures, we ovelay the pressure-composition diagram for these 3 mixtures in the same plot (Figure 9) and consider (for concreteness) two cases: P*=10 for the isotropic-cubic coexistence region and P*=18 for the rotator-cubic coexistence region (selecting other pressures would give similar results).
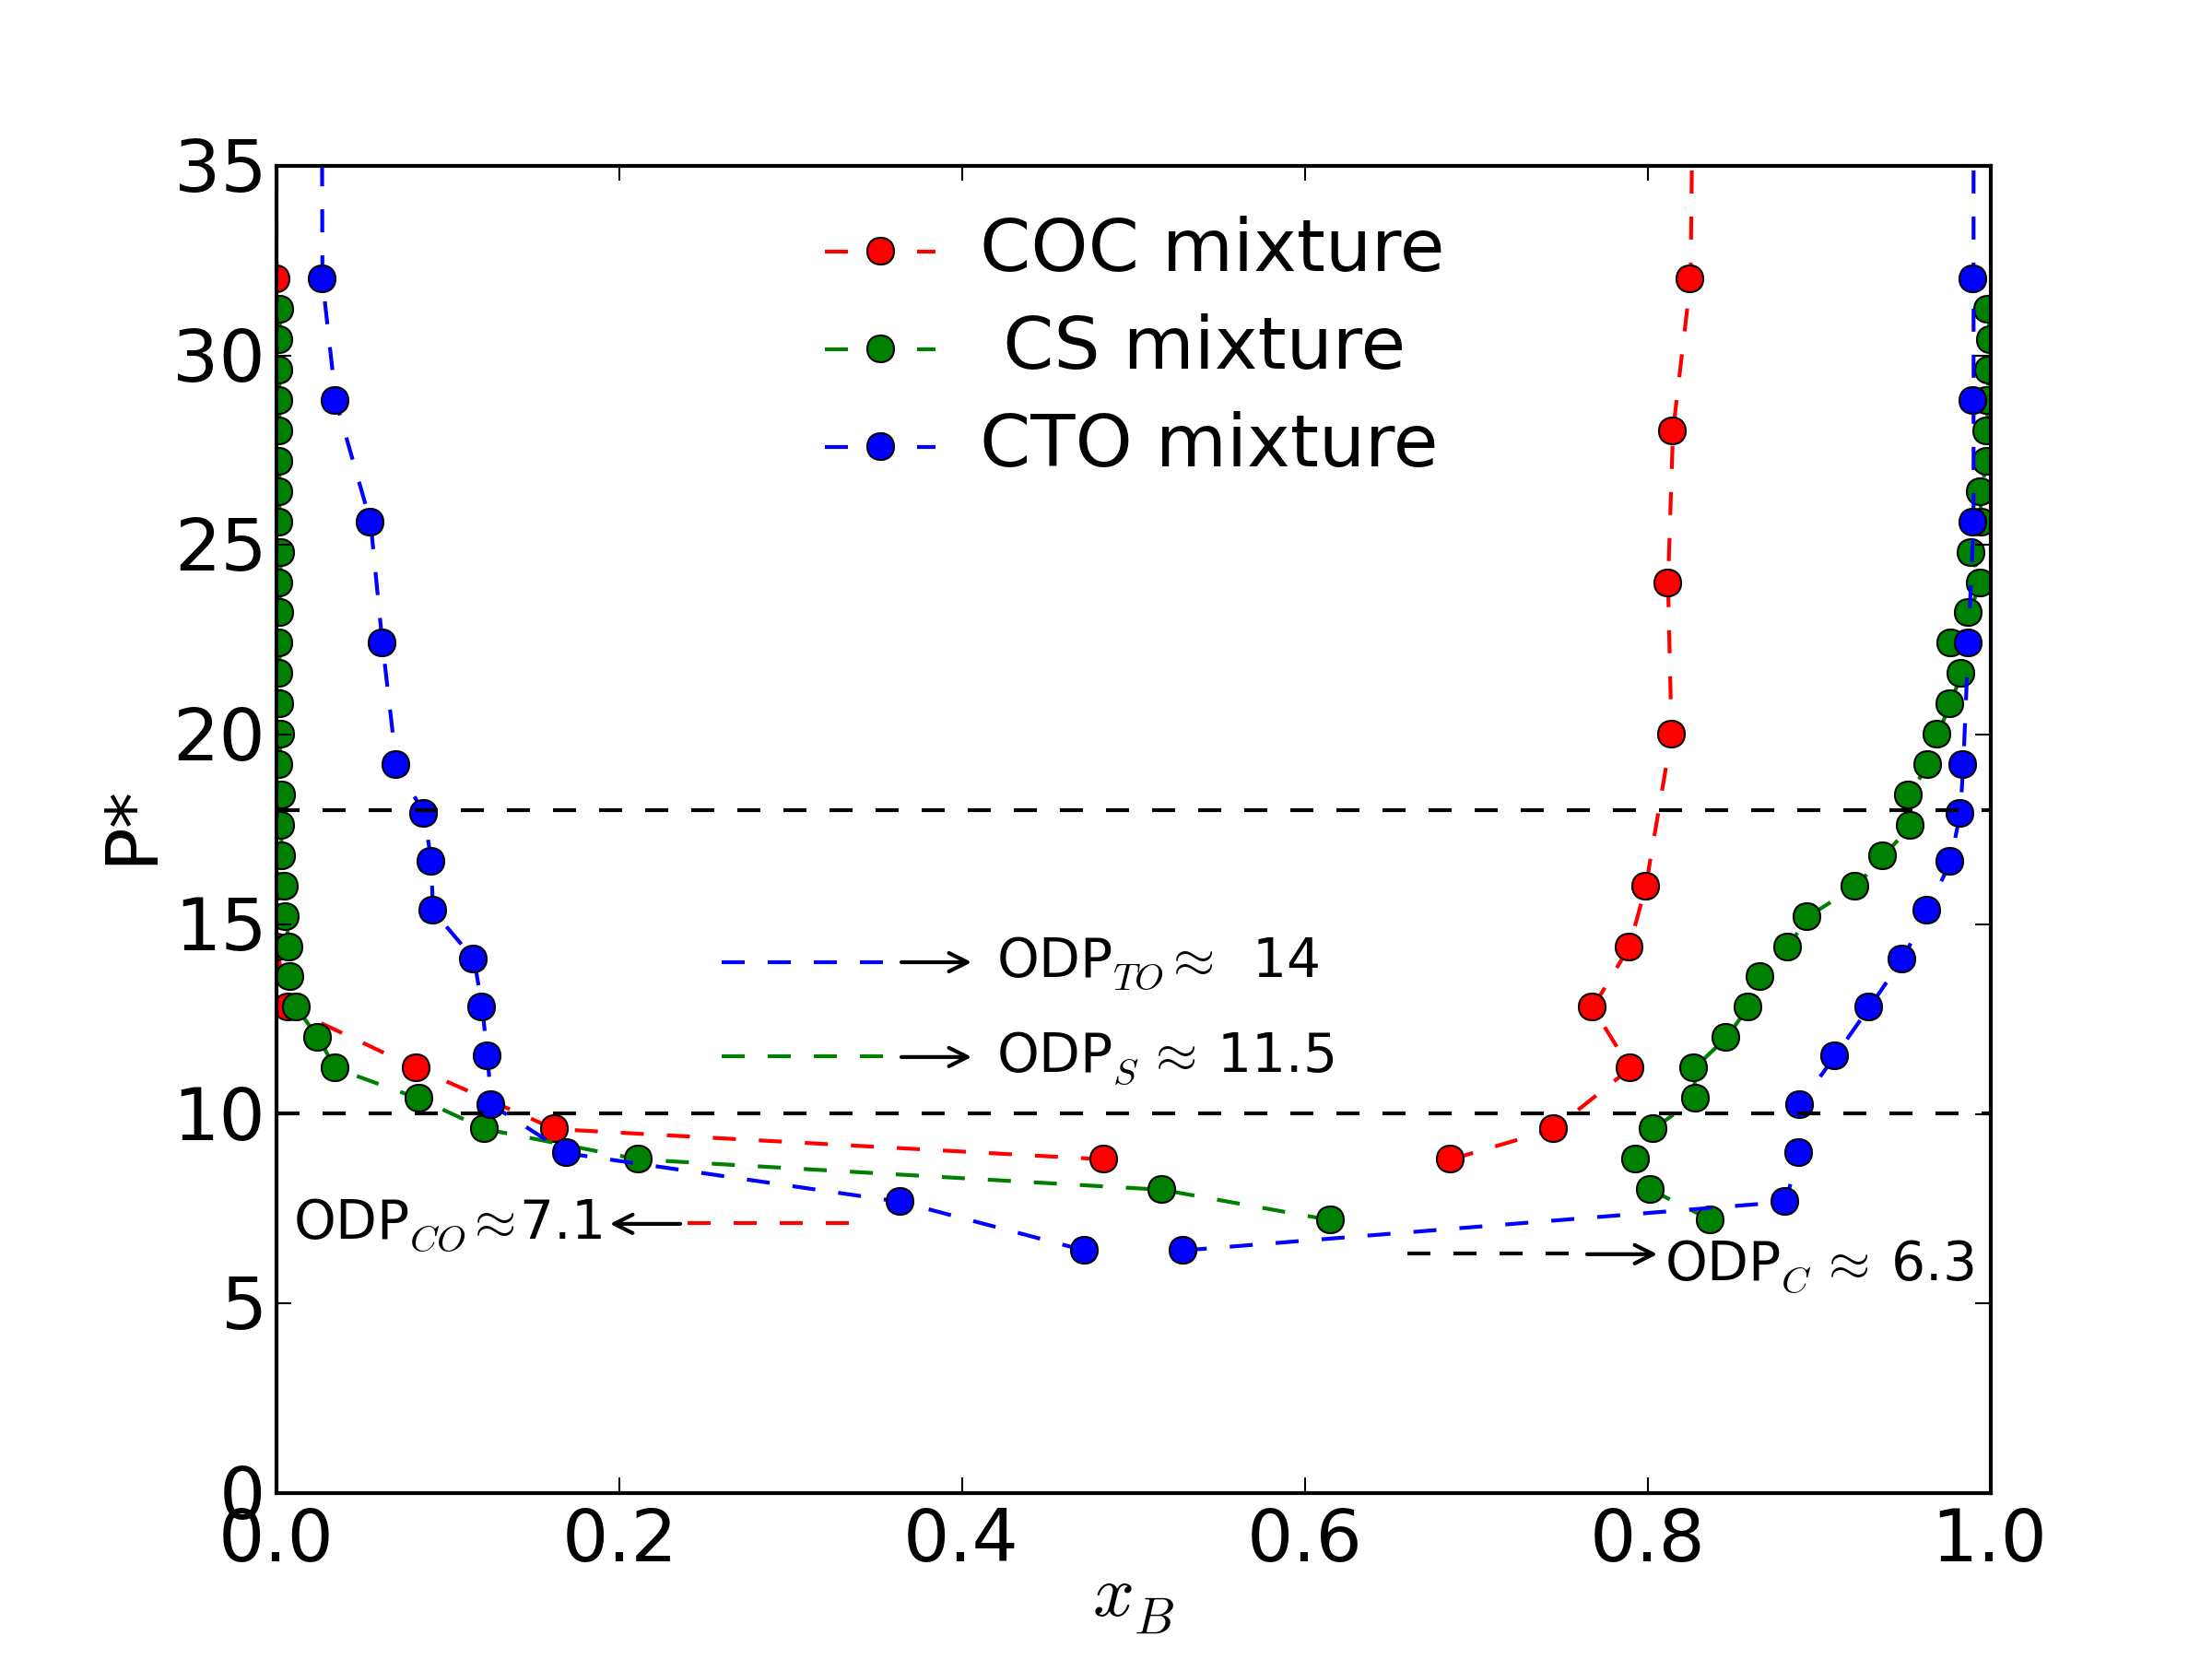
For a fixed P* we will denote as the most compressed A-rich phase (among the 3 mixtures) the one that has the lowest ODPA. (i.e., the degree of compression is relative to ODPA). This is rooted on the fact that at the ODP, the isotropic phase for all systems considered has a similar packing fraction and so one can assume that at the ODP all A-rich (or B-rich) systems are comparably dense. We see in Figure 9 that at a given pressure: (1) Cubes tend to dissolve more into the A-rich phase (whether it is isotropic or rotator) for the mixture that has the highest ODPA, namely, where the A-rich phase is less compressed (at the given P*), and (2) conversely, the A component dissolves more into the cubic phase for the mixture that has the lowest ODPA, namely, for the A-rich phase that is more compressed (at the given P*). Both of these trends are consistent with the idea that a component that is in a more compressed phase has a higher chemical potential (and a higher tendency to escape) and would then have a higher relative proclivity to transfer to the other phase so that chemical potentials can be equalized. For trend (1) cubes in the cubic phase are always equally compressed (for a given P*) but will transfer to and populate more a coexistence phase that is less compressed and hence more hospitable to guests; for trend (2) the A component experiences different states of compression in the A-rich phases across mixtures and hence escapes to different extents into the coexistence cubic phase (that is always equally compressed at a given P*). Because our systems are purely entropic, a higher (lower) relative degree of compression or chemical potential translates to essentially a lower (higher) entropy. Of course, these trends are only approximate and expected to hold provided that, among different systems, the ODPs are sufficiently different but one is still comparing at conditions where similar phases coexist. Note that other pure-system attributes (besides ODPs) could be used to try to correlate the observed miscibility trends; e.g.,the particle volume which, as Table 1 shows, consistently decreases as ODP increases and hence it is an equally good descriptor. Further, some particular function of ODP or particle volume may prove to be better at correlating those trends in a more quantitative way. Our limited sample of mixtures only allows us to point out qualitative correlations and to conjecture that relative values of ODPs, landmarks of pure component phase behavior that also capture particle size disparities, likely provide more robust clues of mixture phase behavior than any single geometrical feature of a particle shape. Of course, the precise particle shapes must also play a role in reinforcing or opposing these broad trends. The COTO mixture does not allow a direct comparison with the other mixtures for a fixed pressure but we expect that similar principles should apply on how the relative compression states of the phases affect the saturation solubility of the guest component.
5 Conclusions and a roadmap for equimolar phase behavior
Towards the goal of identifying key factors that govern the self-assembly of mixtures of polyhedral nanoparticles, we studied here the phase diagrams of four representative binary mixtures of hard convex polyhedra, using as components particle shapes that are readily accessible via well-established synthesis methods. In particular, we examined how the properties of the individual components affect the interplay between mixing and packing entropy which ultimately determines the types of phases formed and the extent of inter-particle mixing in such phases.
We find that, while the pure-component phase behavior is determined by the rotational symmetry and asphericity of the particle shape, the binary-component phase behavior depends on both the pure-component phase behavior and on the relative size ratio of the components, which in turn determines their relative difference in ODPs. For instance, in the COC mixture a combination of a similarity of size ratio and pure-component crystal lattices makes COs particularly more miscible in the cube-rich ordered phase.
Casting our systems as A+B mixtures where B is the component with the largest size and hence smaller ODP, we expectedly find that the relative extent of miscibility of the two shapes (miscibility of A in the B-rich phase vs. that of B in the A-rich phase) depends on the relative ODP values. In particular, if ODP = ODPA with ODP ODPB, then at any particular pressure where phase separation occurs, the larger the ODP the lower the solubility of A in the B-rich ordered phase and the higher the solubility of B in the A-rich ordered phase
We attempt now to sketch out a rough phase roadmap that identifies the phases formed at the ODP of an equimolar mixture of hard particles (henceforth denoted the ODPEM ); i.e., the first single- or two-phase state involving at least one ordered phase that arises upon compression of an isotropic equimolar mixture of A+B. We only consider mixtures consisting of shapes that for any particular asphericity exhibit (as pure components) one or more of the following mesophases or ordered states: rotator (R), solid crystal (S), and liquid crystal (LC). If a given particle forms multiple ordered states, it is assumed that a LC occurs at a lower packing fraction (and pressure) than an R phase, which in turn would occur at a lower packing fraction than an S phase. Very high values are assumed to be accessible with prolate or oblate shapes only, which should lead to LC behavior and low ODPs. The tentative roadmap shown in Figure 10 is based on observations from this work and those from selected previous studies on binary mixtures of hard particles (marked by numbers in the plot), and is restricted to intermediate particle volume ratios between r, which is the range that our mixtures fall into.
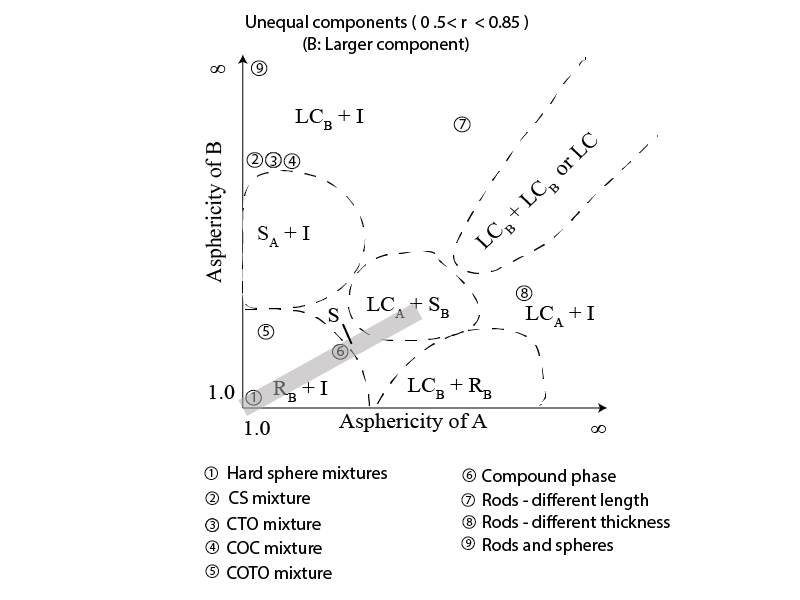
The diagram of Figure 10 is guided by the following observations. If B is the largest component, then it is expected that for low to moderate , ODPODPB and hence at the ODPEM (slightly above ODPB) a phase separated state should ensue comprising an ordered B-rich phase (R, S, or LC depending on the value) and an isotropic phase; however, for very large the pure A component would be expected to form a LC with ODPODPB in which case at the ODPEM an A-rich LC phase should coexist with a B-rich isotropic phase. Of course, a crossover behavior could exist between these small- and large- regimes, where two ordered phases coexist at the ODPEM. In Figure 10 we mark only the ordered phases that could be formed, if any such phase will form at all. The alternate outcome would be the formation of some type of jammed state without a well-defined structural order. The shape and extent of each region are only qualitative and meant to guide the eye. A secondary particle shape parameter besides would be necessary to make more discriminative diagrams ( rotational symmetry would be a good candidate 9). Note that we assumed that as approaches 1, particles have higher rotational symmetry and we ascribed to crystal phases of spheres a rotator character since any infinitesimal departure from = 1 would lead to a rotational degree of freedom.
Compound crystal phases are known to exist for a number of binary hard-core particles, like the Laves phases for unequal hard spheres35 36or polyhedra that form tessellating compounds17. However, these may not be the phases that arise at the ODPEM (i.e., at equimolar composition) or may arise for components with and so they would not be included in Figure 10. Likewise, a single mixed LC phase would only be a possibility for very specific types of component shapes. These two scenarios (where a single S or LC phase forms at the ODPEM) do not seem to correlate strongly with sphericity (other than a loose tendency of components to have similar ) and so are only included in Figure 10 (as a gray region) for completeness.
Altogether, our observations highlight the fact that although many factors such as relative size, asphericity, individual crystal lattices, and mesophase formation determine the phase behavior of a mixture, the trends in mutual miscibility are best captured by the components asphericities and their relative ODPs. Towards designing novel nanoparticle superstructures with desired properties, this study hence provides some guiding principles about the phase behavior of the binary mixtures derived from the properties of the constituent shapes. While all systems studied here are relatively asymmetric in terms of size (and ODP) values, we are currently exploring more symmetric binary systems where our preliminary results have already revealed significant differences with some of the trends observed here. Also, while the systems studied here involved convex particles only, the use of concave particles, especially when paired with complementary-shaped convex partners, would open the door to much more complex phase behaviors.
Acknowledgements
Work on mixtures of two polyhedral particles was supported by the U.S. National Science Foundation Grant No. CBET 1033349. Work associated with mixture containing hard spheres was supported by the U.S. Department of Energy, Office of Basic Energy Sciences, Division of Materials Sciences and Engineering under award Grant No. ER46517.
References
- Buining et al. 1991 P. A. Buining, C. Pathmamanoharan, J. B. H. Jansen and H. N. W. Lekkerkerker, Journal of the American Ceramic Society, 1991, 74, 1303–1307.
- Adams et al. 1998 M. Adams, Z. Dogic, S. Keller and S. Fraden, NATURE, 1998, 393, 349–352.
- Sun and Xia 2002 Y. Sun and Y. Xia, Science, 2002, 298, 2176–2179.
- van der Kooij et al. 2000 F. van der Kooij, K. Kassapidou and H. Lekkerkerker, NATURE, 2000, 406, 868–871.
- Personick et al. 2011 M. L. Personick, M. R. Langille, J. Zhang and C. A. Mirkin, Nano Letters, 2011, 11, 3394–3398.
- Chiu et al. 2011 C.-Y. Chiu, Y. Li, L. Ruan, X. Ye, C. B. Murray and Y. Huang, NATURE CHEMISTRY, 2011, 3, 393–399.
- Quan and Fang 2010 Z. Quan and J. Fang, Nano Today, 2010, 5, 390–411.
- Li et al. 2011 F. Li, D. P. Josephson and A. Stein, Angew. Chem.-Int. Edit., 2011, 50, 360–388.
- Agarwal and Escobedo 2011 U. Agarwal and F. A. Escobedo, Nature materials, 2011, 10, 230–5.
- Damasceno et al. 2012 P. F. Damasceno, M. Engel and S. C. Glotzer, ACS Nano, 2012, 6, 609–614.
- Haji-Akbari et al. 2011 A. Haji-Akbari, M. Engel and S. C. Glotzer, The Journal of Chemical Physics, 2011, 135, 194101.
- John et al. 2008 B. S. John, C. Juhlin and F. A. Escobedo, J. Chem Phys., 2008, 128, 044909.
- Seo et al. 2006 D. Seo, J. C. Park and H. Song, Journal of the American Chemical Society, 2006, 128, 14863–14870.
- Compton and Osterloh 2007 O. C. Compton and F. E. Osterloh, Journal of the American Chemical Society, 2007, 129, 7793–7798.
- Niu et al. 2010 W. Niu, L. Zhang and G. Xu, ACS Nano, 2010, 4, 1987–1996.
- Long et al. 2011 N. V. Long, M. Ohtaki, M. Uchida, R. Jalem, H. Hirata, N. D. Chien and M. Nogami, Journal of Colloid and Interface Science, 2011, 359, 339 – 350.
- Khadilkar and Escobedo 2012 M. R. Khadilkar and F. A. Escobedo, J. Chem. Phys., 2012, 137, 194907.
- Escobedo 2003 F. A. Escobedo, The Journal of Chemical Physics, 2003, 118, 10262–10275.
- Agarwal and Escobedo 2012 U. Agarwal and F. A. Escobedo, J. Chem. Phys., 2012, 137, 024905.
- Henzie et al. 2012 J. Henzie, M. Grünwald, A. Widmer-Cooper, P. L. Geissler and P. Yang, Nature Materials, 2012, 11, 131–7.
- Vega and Noya 2007 C. Vega and E. G. Noya, The Journal of Chemical Physics, 2007, 127, 154113.
- Metropolis et al. 1953 N. Metropolis, A. Rosenbluth, M. Rosenbluth, A. Teller and E. Teller, J. Chem. Phys., 1953, 21, 1087–1092.
- Golshtein and Tretyakov 1996 E. G. Golshtein and N. V. Tretyakov, Modified Lagrangians and monotone maps in optimization, New York- Wiley, 1996.
- Arvo 1990 J. Arvo, Graphics gems, Academic Press Professional, Inc., San Diego, CA, USA, 1990, pp. 335–339.
- Frenkel 2013 D. Frenkel, The European Physical Journal Plus, 2013, 128, 1–21.
- Steinhardt et al. 1983 P. J. Steinhardt, D. R. Nelson and M. Ronchetti, Phys. Rev. B, 1983, 28, 784–805.
- John and Escobedo 2005 B. John and F. Escobedo, Journal of Physical Chemistry B, 2005, 109, 23008–23015.
- Smallenburg et al. 2012 F. Smallenburg, L. Filion, M. Marechal and M. Dijkstra, Proceedings of the National Academy of Sciences of the United States of America, 2012, 109, 17886–17890.
- Frenkel 2012 D. Frenkel, Proceedings of the National Academy of Sciences of the United States of America, 2012, 109, 17728–17729.
- Kranendonk and Frenkel 1991 W. Kranendonk and D. Frenkel, Molecular Physics, 1991, 72, 679–697.
- Punnathanam and Monson 2006 S. Punnathanam and P. A. Monson, The Journal of Chemical Physics, 2006, 125, 024508.
- Lekkerkerker et al. 1984 H. N. W. Lekkerkerker, P. Coulon, R. V. D. Haegen and R. Deblieck, The Journal of Chemical Physics, 1984, 80, 3427–3433.
- Purdy et al. 2005 K. R. Purdy, S. Varga, A. Galindo, G. Jackson and S. Fraden, Phys. Rev. Lett., 2005, 94, 057801.
- Vliegenthart and Lekkerkerker 1999 G. A. Vliegenthart and H. N. W. Lekkerkerker, The Journal of Chemical Physics, 1999, 111, 4153–4157.
- Filion and Dijkstra 2009 L. Filion and M. Dijkstra, Phys. Rev. E, 2009, 79, 046714.
- Hynninen et al. 2007 A.-P. Hynninen, J. H. J. Thijssen, E. C. M. Vermolen, M. Dijkstra and A. Van Blaaderen, Nature Materials, 2007, 6, 202–205.