Discovery of a Quadruple Lens in CANDELS with a Record Lens Redshift
Abstract
Using spectroscopy from the Large Binocular Telescope and imaging from the Hubble Space Telescope we discovered the first strong galaxy lens at . The lens has a secure photometric redshift of and the source is spectroscopically confirmed at . The Einstein radius (”; 3.0 kpc) encloses , with an upper limit on the dark matter fraction of 60%. The highly magnified (40) source galaxy has a very small stellar mass () and shows an extremely strong [OIII]5007Å emission line () bolstering the evidence that intense starbursts among very low-mass galaxies are common at high redshift.
1. Introduction
Strongly lensing galaxies provide a range of important applications, from the measurement of cosmological parameters through time delays between lensed images (Refsdal, 1964), to the direct measurement of total galaxy masses (e.g., Kochanek, 1995), to the evolution and ages of elliptical galaxies (e.g., Rusin et al., 2003; van de Ven et al., 2003), to the radial profile of the dark matter distribution (e.g., Treu & Koopmans, 2004).
Since the discovery of the first strong lens almost 30 years ago (Lawrence et al., 1984; Schneider et al., 1986), no strong lenses at higher redshifts have been found, despite the large number of lenses discovered since then (e.g., Bolton et al., 2006; Faure et al., 2008; More et al., 2012), and a handful of tentative candidates (More et al., 2012) for which the lens nature is unfortunately doubtful.
The paucity of lenses has four causes: first, lensing probabilities decrease for lenses at higher redshifts due to the small relative distances between lenses and sources – for example, the Einstein radius for a galaxy at is only ” for a source. Second, the reduced volume and number density of sources behind potential lenses is greatly reduced. Third, massive galaxies are increasingly rare at higher redshifts, and those with the highest lensing probability – the most concentrated, bulge-dominated galaxies – are usually red and faint in the rest-frame ultraviolet and hence in optical surveys. Fourth, the measurement of lens and source redshifts and the confirmation of the lens nature require near-infrared spectroscopy, which has been much more challenging than optical spectroscopy.
Based on the number counts of potential high-redshift () sources (e.g., Bouwens et al., 2007) and the mass function of potential lenses (e.g., Ilbert et al., 2010; Brammer et al., 2011) we estimate one galaxy-galaxy lens to occur per square arcminutes. Thus, large-area, near-infrared surveys are needed to have any chance to find lenses: the largest current survey of this kind, CANDELS (Grogin et al., 2011; Koekemoer et al., 2011), covers 800 square arcminutes with Hubble Space Telescope near-infrared imaging, such that it should contain a handful of lenses with background sources intrinsically brighter than 28th magnitude (AB) in the near-infrared.
Here we present the discovery of the quadruple galaxy-galaxy lens J100018.47+022138.74 (J1000+0221) using imaging data from CANDELS and near-infrared spectroscopy from the Large Binocular Telescope (LBT). We report a spectroscopically confirmed source redshift of and a record lens galaxy redshift of .
The lens is a flattened, quiescent galaxy with a stellar mass of and appears to be located in a previously unknown overdense region populated with at least a half a dozen of galaxies at the same redshift. Its Einstein radius of ” (3.0 kpc at ) presents us with the first opportunity for a direct mass measurement in this redshift range through lensing, providing an important confirmation of previous results based on stellar absorption line kinematics (see, e.g., van de Sande et al., 2013, and references therein), which has been technically challenging.
2. Data
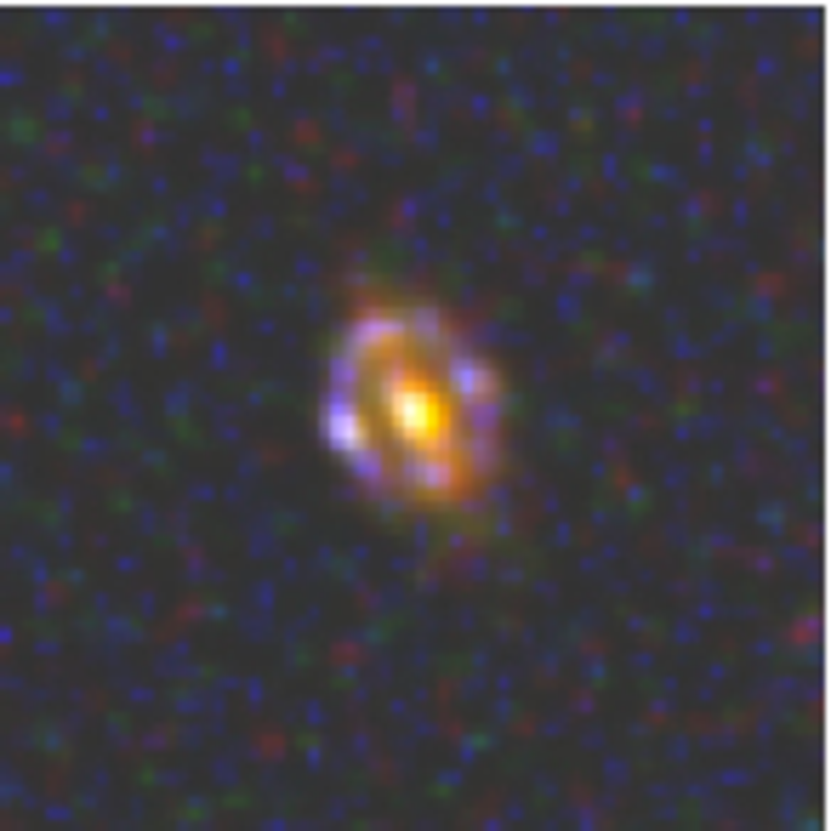
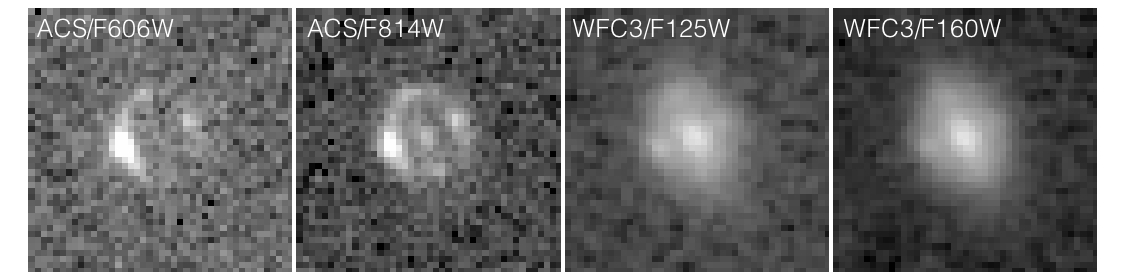
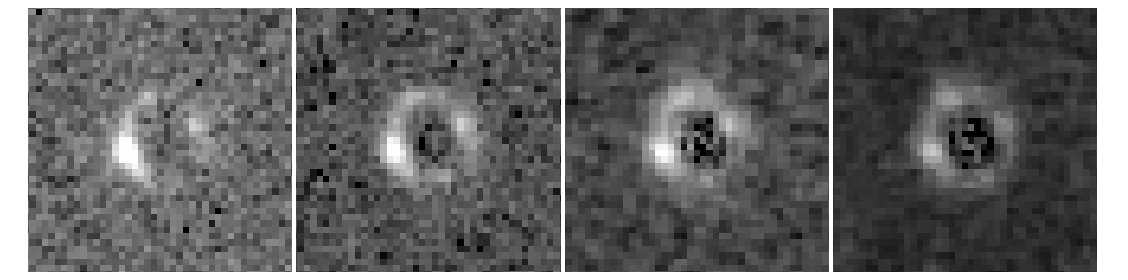
CANDELS HST/Wide Field Camera 3 (WFC3, Kimble et al., 2008) (F125W+F160W) and HST/Advanced Camera for Surveys (ACS, Ford et al., 2003) (F606W+F814W) imaging of the lens+source system is shown Figure 1. The false-color image shows the unambiguous lens nature of J1000+0221: the four blue images at a sub-arcsecond scale surrounding a red galaxy are a tell-tale sign. Before generating the color map each individual image was deconvolved with the Lucy-Robertson algorithm, using appropriate point spread functions (PSFs) for each filter (§3). Images in the individual filters are shown in Figure 1. Especially after subtraction of the lens (see §3 for details) the almost continuous Einstein ring with a radius of ” is clearly seen in all filters.
The source redshift is measured from LBT/LUCI (Seifert et al., 2003) near-infrared spectroscopy originally aimed at obtaining continuum spectroscopy of massive galaxies at . A 3-hour observing sequence of individual, dithered 120s exposures with the H+K grism in a 1” wide slit and seeing 0.6” produced significant detections of three emission lines in the K band, identified as and [OIII] (see Figure 2). These fortuitously lensed emission lines allowed us to identify the lens nature of the system, which we were able to confirm upon visual inspection of the HST imaging described above. No spectroscopic redshift for the lens could be determined from the H- or K-band spectrum. The multi-slit capability of LUCI allowed us to target several of the galaxies in the immediate vicinity of J1000+0221, one of which we spectroscopically confirmed at through the detection H and [NeIII] in the H band. The LUCI data reduction procedure is described in detail by M. Maseda et al. (in prep.).
Finally, we include ground-based photometry in our analysis. We use the Newfirm Medium Band Survey (NMBS) multi-wavelength catalog and derived data products from Whitaker et al. (2011), as well as LBT photometry from the Large Binocular Cameras (LBC, Boutsia et al. in prep.). These datasets provide us with combined photometry for the lens and source, which we will jointly analyze with the spatially separated photometry from the HST data described in §3 in order to obtain accurate redshift and stellar mass estimates.
| F606W | F814W | F125W | F160W | IRAC3.6 | IRAC4.5 | z | |
|---|---|---|---|---|---|---|---|
| AB mag | |||||||
| lens | 26.40.4 | 25.30.2 | 22.430.05 | 21.850.05 | 20.90.1 | 20.80.1 | 1.530.09 |
| source | 24.30.1 | 23.80.1 | 23.90.2 | 23.90.3 | 3.4170.001 | ||
| R.A. | Dec. | F160W flux ratio | |
|---|---|---|---|
| J2000 | J2000 | Arb. units | |
| lens | 150.0769694 | +2.3607623 | |
| image A | 150.0770240 | +2.3608697 | 0.370.03 |
| B | 150.0768853 | +2.3607955 | 0.300.03 |
| C | 150.0770630 | +2.3607356 | 0.690.04 |
| D | 150.0769501 | +2.3606752 | 0.140.03 |

3. Lens-Source Image Decomposition
We use GALFIT (Peng et al., 2010) and the PSF from van der Wel et al. (2012) to produce a Sérsic model for the F160W image of the lens. An annulus with an inner radius of 0.18” and an outer radius of 0.66” containing the source images is masked in the fitting process. The half-light radius measured along the major axis is ” or kpc. The Sérsic index is , the projected axis ratio , and the position angle ( degrees from North to East). The results do not significantly change if the masked region is made narrower. This size and shape are rather typical for early-type galaxies at (e.g., van der Wel et al., 2011; Chang et al., 2013).
Then, for each of the ACS and WFC3 images, we convolve this Sérsic model with the appropriate PSF model111The F125W PSF is taken from van der Wel et al. (2012); a bright, non-saturated star in the mosaic serves as the PSF model for the ACS images. and scale the total flux to minimize the residual flux within a radius of 0.18”. The scaled models provide us with PSF-matched photometry of the lens. The lens-subtracted images are shown in the bottom row of Figure 1. Total source fluxes are then measured within 1” diameter apertures.
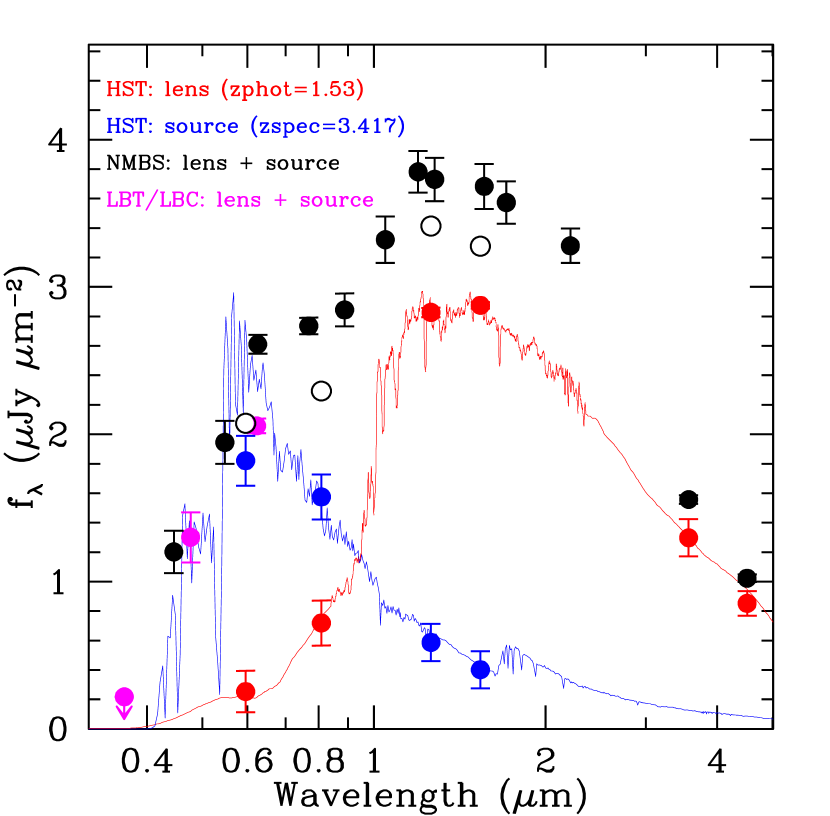
In order to increase the wavelength coverage, we take the IRAC 3.6m and 4.5m photometry from the NMBS catalog and include a small correction for the source flux, estimated to be 10% based on the spectral energy distribution of the source (see §6). Hence we have obtained separate photometry for the lens and the source, which we show in Figure 3 and list in Table 1.
4. Lens Redshift and Stellar Mass
Spectroscopic confirmation of the lens redshift has remained elusive due to its faintness (; ) and apparent lack of emission lines. However, the red color implies the presence of the Balmer and/or 4000 break straddled by these two filters, suggesting a redshift in the range . Using EAZY (Brammer et al., 2008) we construct the redshift probability distribution based on the photometry given in Table 1, and find that the peak lies at . We find the same result if we include the LBC -band photometry.
The lens-source system is unresolved in the ground-based imaging, which thus produces the sum of the fluxes of the source and the lens. The source has an accurately known redshift and a very simple spectral energy distribution (SED), given that it is young and dust-poor as indicated by the blue colors (see Figure 3 and §6). The EAZY redshift probability distribution for the lens based on the NMBS photometry after subtracting the source SED peaks at . The combined probability distribution from the two independent redshift estimates give () as the 68% (95%) confidence interval, with no secondary redshift solutions.
Further credence to our redshift estimate of the lens, and the precise value of in particular, is lent by the four galaxies with in the NMBS catalog within a projected distance of 250 kpc, one of which could be spectroscopically confirmed at with our LUCI spectroscopy. This is the only such overdensity in the COSMOS field, and suggests that the lens is a member.
We use FAST (Kriek et al., 2009) to estimate the lens stellar mass, star-formation history and attenuation based on the ACS+WFC3+IRAC photometry given in Table 1. The best-fitting, solar metallicity model, shown in red in Figure 3, has an age of 1 Gyr, with an exponentially declining star formation rate ( Gyr), and moderate extinction (AV=0.8). Dustier models with some residual star formation cannot be ruled out. The star formation rate is at most a few / yr-1 given that we see no H in the LUCI spectrum and only have a marginally significant Spitzer 24m flux (from the NMBS catalog). The stellar mass is , assuming a Chabrier (2003) stellar initial mass function. Although the results of the SED fit suffer from the usual age-metallicity degeneracy, the mass estimate is not sensitive to departures from the adopted (solar) metallicity.
5. Lens Model
We use the method described by van de Ven et al. (2010) to produce an analytical lens model that allows for a non-spherical underlying mass distribution. In Table 2 we provide the coordinates of the lens center and the four source images, as well as flux ratios for the images measured in F160W. The flux ratios vary with wavelength, as is immediately apparent from the the lens-subtracted images shown in Figure 1: the brightest image is also the bluest. We rule out a supernova by examining the ACS images at two different epochs, such that the color variations suggest that the source has intrinsic, spatial color variations, or that there is dust in the lens, the distribution of which is patchy. Because of the color variations we do not use the flux ratios of the images in our lensing model. Our best-fitting lens model has an Einstein radius of ” (or 3.0 kpc) with an enclosed mass of . The total magnification of the source, which is aligned almost perfectly (to within 0.01”) with the lens, is .
Given that 66% of the F160W light from the lens falls within the Einstein radius we derive a stellar mass within the Einstein radius of , which implies that stars likely account for the majority, but not necessarily all, of the mass within . This is also the case if we increase the stellar mass by adopting the Salpeter IMF (which cannot be ruled out) rather than the Chabrier IMF. An indication that light does not precisely trace mass is that the (tangential) critical curve for a mass distribution that is as flattened as the observed light distribution should also be somewhat elongated (in the direction perpendicular to that of the light distribution). The image configuration, however, implies that critical curve is very close to circulur. Furthermore, if mass follows light, then the implied mass profile at is unusually steep: with little scatter, the typical slope is known to be close to isothermal (, Koopmans et al., 2009), whereas the implied slope here is . Given our stellar mass estimate, the roundness of the critical curve, and the extremely steep mass profile slope inferred under the assumption that mass follows light, we conclude that there likely is a significant contribution from dark matter within of the lens, with an 1- upper limit of 60%.
As described above, the lens is situated in an overdense environment, which likely contributes to the projected, enclosed mass. A crude estimate of this effect can be inferred by assuming that the most massive galaxy in the overdensity, which lies at a projected distance of 110 kpc, is situated at the center of a spherical Navarro et al. (1996) dark matter halo with concentration parameter . Based on the stellar mass of this central galaxy () we estiamte the halo to have a total mass of (Moster et al., 2013), such that the projected mass within the Einstein radius of the lens is . This does not significantly affect our conclusions regarding the dark matter and stellar mass fractions.
Finally, we note that the velocity dispersion implied by the lens model ( km s-1) is consistent with stellar velocity dispersions of galaxies at similar redshifts as measured from absorption line spectra (e.g., van de Sande et al., 2013, and references therein): the velocity dispersion is higher by compared to present-day galaxies with a similar mass. Our accurate and precise measurement of the velocity dispersion provides important support to the results based on stellar kinematics given the practical difficulties associated with continuum spectroscopy for galaxies.
6. Nature of the Source
The HST photometry of the source (blue points in Figure 3) shows a very blue continuum, indicative of a young, dust-free galaxy. Using the method described by Finkelstein et al. (2012) we fit the spectral energy distribution given by the four photometric data points (F606W, F814W, F125W, and F160W) given in Table 1. We confirm the young age ( Myr), dust-free nature (), and blue continuum slope () of the source. The (de-magnified) stellar mass of the galaxy is . The best-fitting model spectral energy distribution is shown in Figure 3.
As we mentioned above and showed in Figure 2, three emission lines are detected with high significance: H and [OIII] at 4959 and 5007. We detect a low-level (1-2 per pixel) continuum in the spectrum, and we use the average continuum flux over the entire K-band wavelength range to estimate the equivalent width of the brightest [OIII] line at in the observed frame, or in the rest-frame of the source222The lens+source system is smaller than the slit width, as is the seeing disk for our observations, such that slit losses are negligible.. Adopting the K band flux ratio predicted by the SED models for the source and the lens we arrive at an estimated rest-frame for the source alone.
This high is consistent with the stellar population properties estimates above, although we note that this is not necessarily the of the unlensed source, as a spatially varying could lead to a boosted, lensed . The fact that the brightest image is also the bluest may indicate that this may be the case here, but it is beyond the scope of our analysis to attempt to correct for this effect.
The [OIII]H line ratio from the spectrum shown in Figure 2 is , indicative of a high excitation, and likely a low metallicity. Additional emission lines such as [OII] or [NeIII], needed to confirm the low metallicity, are not detected.
An abundant population of objects at with very high [OIII] was identified by van der Wel et al. (2011), and the properties of those extreme emission line galaxies are very similar to those of the source described here (also see Atek et al., 2011). Remarkably, this is the second such emission-line dominated object that is found to be strongly lensed in CANDELS: using data from the 3D-HST survey (Brammer et al., 2012a), Brammer et al. (2012b) found a galaxy at with very similar mass and age. Given the abundance of unlensed emission-line galaxies it was seemingly unlikely that even one strongly lensed version exists within a CANDELS-sized survey. The existence of two strong lensed galaxies of this kind suggests that such galaxies are likely even more common than is currently assumed, and that objects near or below the detection limits of current surveys – the unlensed magnitude of the source is – very commonly display such strong emission lines (cf., Smit et al., 2013). This would have profound consequences for our understanding of galaxy formation: a presumably brief burst of intense star formation may signal the initial formation stage of any galaxy.
Euclid will reveal tens of thousands lens candidates, which will give us unprecendented insight into the variety in properties among faint, high-redshift galaxies, as well as the galaxy mass function at all redshifts with perfectly calibrated mass measurements in an absolute sense.
References
- Atek et al. (2011) Atek, H., Siana, B., Scarlata, C., et al. 2011, ApJ, 743, 121
- Bolton et al. (2006) Bolton, A. S., Burles, S., Koopmans, L. V. E., Treu, T., & Moustakas, L. A. 2006, ApJ, 638, 703
- Bouwens et al. (2007) Bouwens, R. J., Illingworth, G. D., Franx, M., & Ford, H. 2007, ApJ, 670, 928
- Brammer et al. (2008) Brammer, G. B., van Dokkum, P. G., & Coppi, P. 2008, ApJ, 686, 1503
- Brammer et al. (2011) Brammer, G. B. et al. 2011, ApJ, 739, 24
- Brammer et al. (2012b) Brammer, G. B. et al. 2012b, ApJ, 758, L17
- Brammer et al. (2012a) Brammer, G. B. et al. 2012a, ApJS, 200, 13
- Chabrier (2003) Chabrier, G. 2003, PASP, 115, 763
- Chang et al. (2013) Chang, Y.-Y. et al. 2013, ApJ, in press, arXiv:1305.6931
- Faure et al. (2008) Faure, C. et al. 2008, ApJS, 176, 19
- Finkelstein et al. (2012) Finkelstein, S. L., Papovich, C., Salmon, B., et al. 2012, ApJ, 756, 164
- Ford et al. (2003) Ford, H. C. et al. 2003, Proc. SPIE, 4854, 81
- Grogin et al. (2011) Grogin, N. A. et al. 2011, ApJS, 197, 35
- Ilbert et al. (2010) Ilbert, O. et al. 2010, ApJ, 709, 644
- Kimble et al. (2008) Kimble, R. A., MacKenty, J. W., O’Connell, R. W., & Townsend, J. A. 2008, Proc. SPIE, 7010,
- Kriek et al. (2009) Kriek, M. et al. 2009, ApJ, 700, 221
- Kochanek (1995) Kochanek, C. S. 1995, ApJ, 445, 559
- Koekemoer et al. (2011) Koekemoer, A. M. et al. 2011, ApJS, 197, 36
- Koopmans et al. (2009) Koopmans, L. V. E. et al. 2009, ApJ, 703, L51
- Lawrence et al. (1984) Lawrence, C. R., Schneider, D. P., Schmidt, M., et al. 1984, Science, 223, 46
- Leitherer et al. (1999) Leitherer, C. et al. 1999, ApJS, 123, 3
- More et al. (2012) More, A. et al. 2012, ApJ, 749, 38
- Moster et al. (2013) Moster, B. P., Naab, T., & White, S. D. M. 2013, MNRAS, 428, 3121
- Navarro et al. (1996) Navarro, J. F., Frenk, C. S., & White, S. D. M. 1996, ApJ, 462, 563
- Peng et al. (2010) Peng, C. Y., Ho, L. C., Impey, C. D., & Rix, H.-W. 2010, AJ, 139, 2097
- Refsdal (1964) Refsdal, S. 1964, MNRAS, 128, 307
- Rusin et al. (2003) Rusin, D. et al. 2003, ApJ, 587, 143
- Schneider et al. (1986) Schneider, D. P. et al. 1986, AJ, 91, 991
- Seifert et al. (2003) Seifert, W. et al. 2003, Proc. SPIE, 4841, 962
- Smit et al. (2013) Smit, R., Bouwens, R. J., Labbe, I., et al. 2013, arXiv:1307.5847
- Treu & Koopmans (2004) Treu, T., & Koopmans, L. V. E. 2004, ApJ, 611, 739
- van de Sande et al. (2013) van de Sande, J. et al. 2013, ApJ, 771, 85
- van der Wel et al. (2011) van der Wel, A. et al. 2011, ApJ, 730, 38
- van der Wel et al. (2011) van der Wel, A. et al. 2011, ApJ, 742, 111
- van der Wel et al. (2012) van der Wel, A. et al. 2012, ApJS, 203, 24
- van de Ven et al. (2003) van de Ven, G., van Dokkum, P. G., & Franx, M. 2003, MNRAS, 344, 924
- van de Ven et al. (2010) van de Ven, G. et al. 2010, ApJ, 719, 1481
- Whitaker et al. (2011) Whitaker, K. E. et al. 2011, ApJ, 735, 86