Accepted for publication in
The Astrophysical Journal
The Carriers of the Interstellar Unidentified Infrared Emission Features:
Constraints from the Interstellar C–H Stretching Features at 3.2–3.5
Abstract
The unidentified infrared emission (UIE) features at 3.3, 6.2, 7.7, 8.6, and 11.3, commonly attributed to polycyclic aromatic hydrocarbon (PAH) molecules, have been recently ascribed to mixed aromatic/aliphatic organic nanoparticles. More recently, an upper limit of 9% was placed on the aliphatic fraction (i.e., the fraction of carbon atoms in aliphatic form) of the UIE carriers based on the observed intensities of the 3.4 and 3.3 emission features by attributing them to aliphatic and aromatic C–H stretching modes, respectively, and assuming derived from a small set of aliphatic and aromatic compounds, where and are respectively the band strengths of the 3.4 aliphatic and 3.3 aromatic C–H bonds. To improve the estimate of the aliphatic fraction of the UIE carriers, here we analyze 35 UIE sources which exhibit both the 3.3 and 3.4 C–H features and determine , the ratio of the power emitted from the 3.4 feature to that from the 3.3 feature. We derive the median ratio to be . We employ density functional theory to compute for a range of methyl-substituted PAHs. The resulting ratio well exceeds 1.4, with an average ratio of . By attributing the 3.4 feature exclusively to aliphatic C–H stretch (i.e., neglecting anharmonicity and superhydrogenation), we derive the fraction of C atoms in aliphatic form from and to be 2%. We therefore conclude that the UIE emitters are predominantly aromatic.
1 Introduction
Many astronomical objects show a distinctive set of emission features in the infrared (IR), collectively known as the “unidentified infrared emission” (UIE) bands. The strongest bands fall at 3.3, 6.2, 7.7, 8.6 and 11.3. They are ubiquitously seen in a wide variety of astrophysical environments, including galaxies at redshifts 2. They account for 10–20% of the total IR power of the Milky Way and star-forming galaxies (Tielens 2008).
Since their first detection four decades ago (Gillett et al. 1973), the carriers of the UIE bands remain unidentified. A popular hypothesis is that the UIE bands arise from the vibrational modes of gas-phase, free-flying polycyclic aromatic hydrocarbon (PAH) molecules which are predominantly aromatic (Léger & Puget 1984, Allamandola et al. 1985, 1989, 1999). Alternatively, amorphous solids with a mixed aromatic/aliphatic structure, such as hydrogenated amorphous carbon (HAC; Jones et al. 1990), quenched carbonaceous composite (QCC; Sakata et al. 1987), and coal (Papoular et al. 1993) have also been proposed.
The HAC, QCC, and coal hypotheses assume that the UIE bands arise following photon absorption in small thermally-isolated aromatic units within or attached to these bulk materials (Duley & Williams 1981). However, it does not appear possible to confine the absorbed stellar photon energy within these aromatic “islands” for the time required for the thermal emission process (see Li & Draine 2002). Bulk materials like HAC, QCC and coal have a huge number of vibrational degrees of freedom and therefore their heat capacities are so large that they will attain an equilibrium temperature of 20 in the diffuse interstellar medium (ISM). With 20, they will not emit efficiently in the UIE bands at 3–12 (see Li 2004).
Recognizing the challenge of bulk materials like HAC, QCC and coal in being heated to emit the UIE bands, Kwok & Zhang (2011, 2013) recently proposed the so-called MAON model: they argued that the UIE bands arise from coal- or kerogen-like organic nanoparticles, consisting of chain-like aliphatic hydrocarbon material linking small units of aromatic rings, where MAON stands for “mixed aromatic/aliphatic organic nanoparticle”. The major improvement of the MAON model over the earlier HAC, QCC and coal hypotheses is that the MAON model hypothesizes that the coal-like UIE carriers are nanometer in size so that their heat capacities are smaller than or comparable to the energy of the starlight photons that excite them. Upon absorption of a single stellar photon, they will be stochastically heated to high temperatures to emit the UIE bands (see Draine & Li 2001).
In brief, the current views about the UIE carriers generally agree that (1) the UIE features arise from the aromatic C–C and C–H vibrational modes, and (2) the carriers must be nanometer in size or smaller (e.g., large molecules). The dispute is mainly on the structure of the UIE carriers: are they predominantly aromatic (like PAHs), or largely aliphatic but mixed with small aromatic units (like MAONs)?
Are the UIE carriers aromatic or aliphatic? A straightforward way to address this question is to examine the aliphatic fraction of the UIE carriers (i.e., the fraction of carbon atoms in aliphatic chains). Aliphatic hydrocarbons have a vibrational band at 3.4 due to the C–H stretching mode (Pendleton & Allamandola 2002). In some HII regions, reflection nebulae and planetary nebulae the UIE band near 3 exhibits a rich spectrum: the dominant 3.3 feature is usually accompanied by a weaker feature at 3.4 along with an underlying plateau extending out to 3.6. In some objects, a series of weaker features at 3.46, 3.51, and 3.56 are also seen superimposed on the plateau, showing a tendency to decrease in strength with increasing wavelength (see Geballe et al. 1985, Jourdain de Muizon et al. 1986, Joblin et al. 1996). While the assignment of the 3.3 emission feature to the aromatic C–H stretch is widely accepted, the precise identification of the 3.4 feature (and the accompanying weak features at 3.46, 3.51, and 3.56 and the broad plateau) remains somewhat controversial. By assigning the 3.4 emission exclusively to aliphatic C–H, one can place an upper limit on the aliphatic fraction of the emitters of the UIE features. This is indeed an upper limit as the 3.4 emission feature could also be due to anharmonicity of the aromatic C–H stretch (Barker et al. 1987) and “superhydrogenated” PAHs whose edges contain excess H atoms (Bernstein et al. 1996, Sandford et al. 2013).
Let and respectively be the observed intensities of the 3.4 and 3.3 emission features. Let and respectively be the band strengths (on a per unit C–H bond basis) of the aliphatic and aromatic C–H bonds. Let and respectively be the numbers of aliphatic and aromatic C–H bonds in the emitters of the 3.3 UIE feature. We obtain . We assume that one aliphatic C atom corresponds to 2.5 aliphatic C–H bonds (intermediate between methylene –CH2 and methyl –CH3) and one aromatic C atom corresponds to 0.75 aromatic C–H bond (intermediate between benzene C6H6 and coronene C24H12). Therefore, in the UIE carriers the ratio of the number of C atoms in aliphatic units to that in aromatic rings is .
In §2 we compile the UIE spectra of a wide variety of objects and determine , the ratio of the power emitted from the 3.4 aliphatic C–H feature to that from the 3.3 aromatic C–H feature. In §3 we use density functional theory (DFT) to calculate the band strengths of the 3.4 feature () and the 3.3 feature () for a range of PAH molecules with a methyl side chain. We estimate in §4 the aliphatic fraction of the UIE carriers from and . We summarize our major results in §5.
2 : Flux Ratio of the 3.4 Aliphatic C–H Feature to the 3.3 Aromatic C–H Feature
We compile all the UIE spectra available in the literature which exhibit both the 3.3 aromatic C–H feature and the 3.4 aliphatic C–H feature. We fit the observed spectra in terms of Drude profiles combined with an underlying continuum. The Drude profile, expected for classical damped harmonic oscillators, is characterized by – the peak wavelength, – the band width, and – the integrated flux of the emission feature: , where , and is the flux at wavelength in unit of . The ratio of the power emitted from the 3.4 feature to that from the 3.3 feature is .
We note that in the literature the band ratios have been reported for some sources. Nevertheless, we prefer to derive the band ratios by ourselves because the previous analyses used different methods to calculate the strengths of the features and the definitions of the underlying continuum of the features were somewhat arbitrary. These differences are not negligible in comparison with data reported in different papers. We therefore decide to derive in a consistent way for all sources.
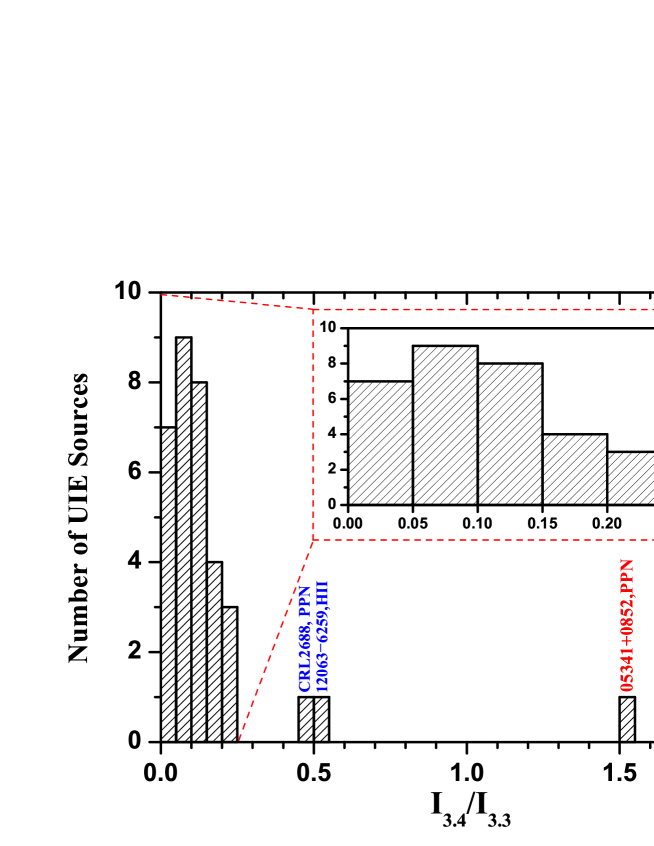
The above-described Drude fitting has been performed for 35 UIE sources, spanning a wide range of environments: reflection nebulae, HII regions, molecular clouds, photodissociated regions, planetary nebulae and protoplanetary nebulae. In Figure 1 we show the flux ratio () distribution of these sources. It can be seen that the majority (31/35) of these sources has . The median of the ratio is . Two protoplanetary nebulae (IRAS 04296+3429, IRAS 05341+0852) have an unusually high ratio and will be discussed elsewhere.
3 : Band-Strength Ratio of the 3.4 Aliphatic C–H Feature to the 3.3 Aromatic C–H Feature
The 3.4 feature may result from aliphatic side chains attached as functional groups to PAHs (Duley & Williams 1981, Pauzat et al. 1999, Wagner et al. 2000). The C–H stretch of methyl (–CH3), methylene (–CH2–), and ethyl (–CH2CH3) side chains on PAHs falls near the weaker satellite features associated with the 3.3 band.
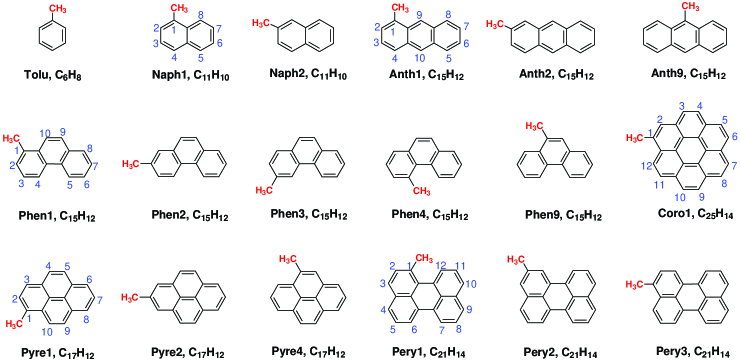
We use the Gaussian09 software (Frisch et al. 2009) to calculate the band strengths of the 3.4 feature () and the 3.3 feature () for a range of aromatic molecules with a methyl side chain (Figure 2). We have considered seven molecules: benzene (C6H6), naphthalene (C10H8), anthracene (C14H10), phenanthrene (C14H10), pyrene (C16H10), perylene (C20H12), and coronene (C24H12). Depending on the position of the methyl attachment, a specific aromatic molecule can have several structural isomers (e.g., the three isomers of methyl-pyrene have the group attached to the edge position 1, 2, or 4, respectively; see Figure 2).
The methyl group is taken to represent the aliphatic component of the UIE carriers. We will focus on methyl-substituted PAHs as PAHs with larger side chains are not as stable against photolytic dissociation as methyl-PAHs and are therefore not expected to present in a large abundance.111If a large aliphatic chain (e.g., –CH2–CH3) is attached to an aromatic structure, the most likely photodissociation product is a benzyl radical PAH-H2 (i.e., an –CH2 group attached to a PAH molecule), which, when subjected to the reaction PAH-H2 + H PAH–CH3 will rapidly lead to the product of a CH3 side group at the periphery of an aromatic molecule (Joblin et al. 1996; Hwang et al. 2002).
The relative abundance of isomers of a given methyl-substituted PAH will depend on the chemical pathways for their formation (e.g., through the photodegradation of larger PAHs). We also do not have any knowledge of the relative abundance of the various PAHs. In the absence of this information, the band-strength ratio will be derived by averaging over all the isomers of the selected PAHs.
The computations can be performed at various theoretical levels (Koch et al. 2001; Cramer et al. 2004; Sholl et al. 2009). A theoretical level denotes a combination of a quantum-mechanical method and a basis set describing the atomic orbitals. In the present study, we primarily employ the hybrid density functional theoretical method B3LYP. Direct comparisons are made to experimental gas phase IR spectra of benzene, toluene, Naph, Naph1, Naph2, Anth, Anth1, Anth2, Anth9, Phen, Phen1, Phen2, Phen3, Pyre, Pyre1 and Coro (see Figure 2), where the molecule is labeled by the first four letters (e.g., Naph refers to naphthalene) and the number refers to the position where the methyl side chain attaches (e.g., Anth2 refers to 2-methylanthracene, i.e., anthracene with a methyl side chain attached to position 2). In this paper, we report the band strength ratios obtained with the B3LYP method since the ratios are all we really need for estimating the aliphatic fractions of the UIR carriers.222In order not to distract from the major astro-message, the extensive details on computational aspects and results will be reported in a separate paper (see X.J. Yang et al. 2013, in preparation), including the frequency and intensity scaling, line assignment and interpretation, comparison with experimental data, and detailed (comparative) analysis of the line intensities (and their uncertainties) computed with different methods and with different basis sets.
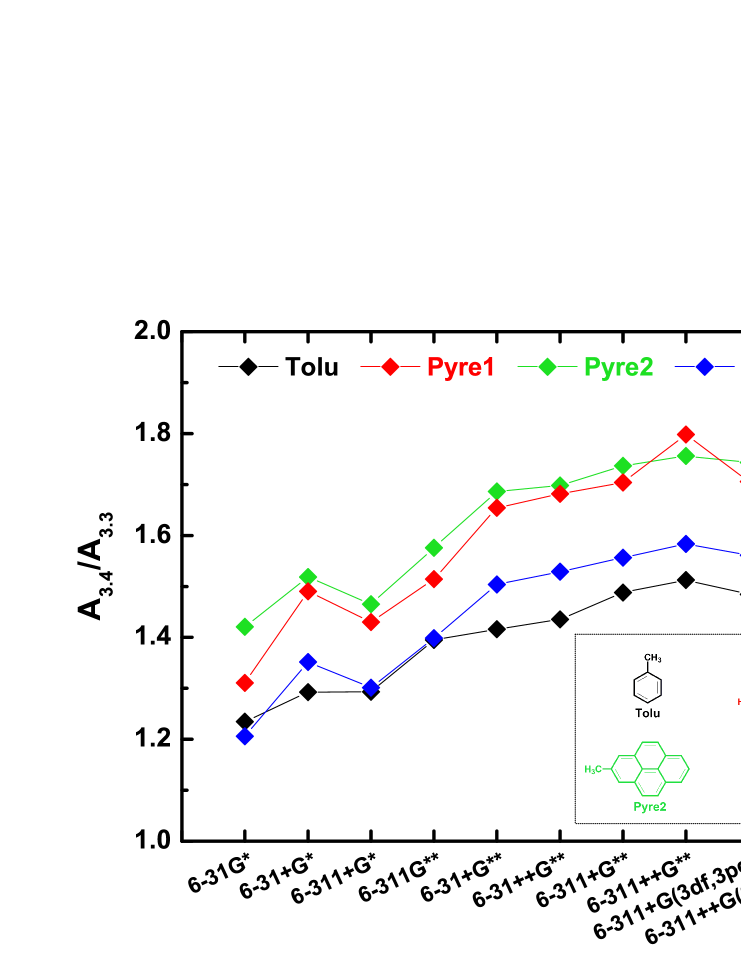
The B3LYP calculations are performed with a variety of basis sets starting with 6-31G∗ and all the way up to 6-311++G(3df,3pd). As shown in Figure 3 the band-strength ratios computed with the basis sets 6-311+G∗∗, 6-311++G∗∗, 6-311+G(3df,3pd), and 6-311++G(3df,3pd) have essentially reached the convergence limit. The B3LYP/6-311+G∗∗ method presents an excellent compromise between accuracy and computational demand, and we adopt this theoretical level to compute all of the molecules shown in Figure 2.
To examine the accuracy of the B3LYP method, we have also employed second-order Mller-Plesset perturbation theory (MP2) to compute the band strength ratios for toluene, Naph1 and Naph2. The MP2 method is thought to be more accurate in computing band intensities than B3LYP (see Cramer et al. 2004). As shown in Table 1, the ratios of toluene, Naph1 and Naph2 computed from B3LYP/6-311++G(3df,3pd) closely agree with that from MP2/6-311++G(3df,3pd) within 4%. With the same basis set, the MP2 method is computationally much more expensive than B3LYP and it is therefore not practical to use MP2 to compute the ratios for all the considered molecules. Also shown in Table 1 are the ratios given by the experimental gas-phase spectra of toluene, Naph1 and Naph2 of the National Institute of Standards and Technology (NIST). The agreement between the ratios computed from B3LYP/6-311+G∗∗ and that from the NIST experimental spectra is reasonably close: the largest difference is for toluene (which is only 13%).
Method Toluene Naph1 Naph2 B3LYP/6-311+G∗∗ 1.49 1.59 1.71 MP2/6-311+G∗∗ 1.52 1.50 1.57 B3LYP/6-311+G(3df,3pd) 1.48 1.59 1.70 MP2/6-311+G(3df,3pd) 1.56 1.52 1.66 NIST Experimental 1.32 1.66 1.89
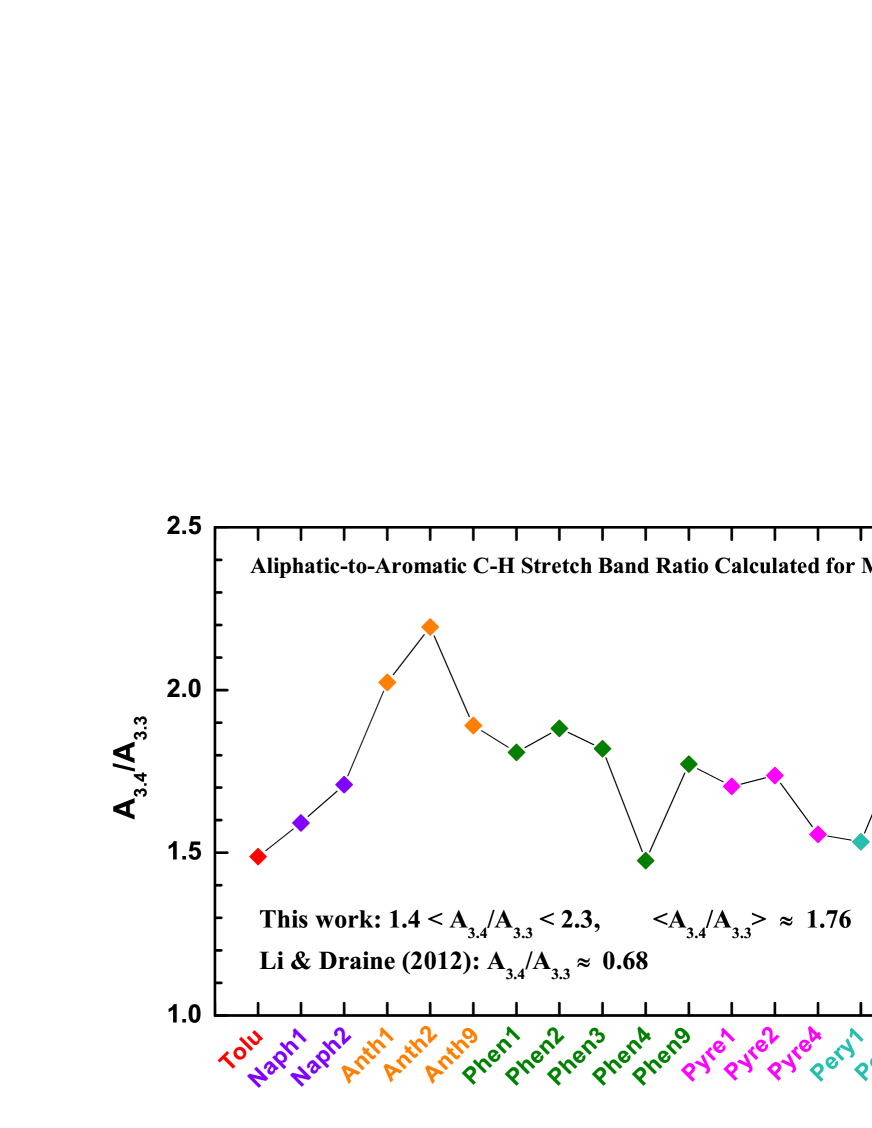
The absolute intensity of an aromatic C–H stretch depends relatively little on the size and nature of the PAH, this intensity is about (i.e., 2.3 per C–H bond). In sharp contrast, the intensity of a methyl C–H stretch depends greatly on the nature of the PAH and also on the specific isomer. For example, the methyl group of the five phenanthrene isomers give rise to between 1.4 and 1.9. A similar isomer dependency is observed for perylene with between 1.5 and 2.2. The average ratio determined for our set of molecules is 1.76, and the individual ratios fall within the broad range between 1.4 and 2.3 (Figure 4). It is important to fully realize this high structure-dependency of the ratio and this finding stresses the need to study the formation processes for methyl-substituted PAHs.
4 Results and Discussion
Taking = 0.12 (§2) and 1.76 (§3), we estimate in the UIE carriers the ratio of the number of C atoms in aliphatic units to that in aromatic rings to be . Clearly, these results show in a compelling fashion that the aliphatic component is only a very minor part of the UIE emitters.
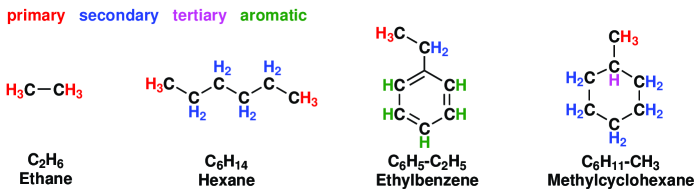
Li & Draine (2012) examined the aliphatic fraction of the UIE carriers in NGC 7027 (a planetary nebula with ) and the Orion bar (a photodissociated region with ). They adopted a band-strength ratio of , with per aromatic C–H bond for small neutral PAHs (Draine & Li 2007), and per aliphatic C–H bond, averaged over ethane, hexane, ethyl-benzene, and methyl-cyclo-hexane (d’Hendecourt & Allamandola 1986; see Figure 5). They placed an upper limit of 9% on the aliphatic fraction of the UIE carriers.333Li & Draine (2012) derived an upper limit of 15% for the aliphatic fraction of the UIE emitters based on the C–H deformation band at 6.85. We argue that the band-strength ratios computed in §3 are better suited for studying the aliphatic fraction of the UIE carriers as ethane, hexane, and methyl-cyclo-hexane are pure aliphatic molecules. It is known that the band strength of the 3.4 aliphatic C–H stretch of pure aliphatics differs appreciably from that of aromatics with aliphatic side chains (see Wexler 1967).
We have studied mono-methyl derivatives of selected, relatively small PAHs. In reality, one would assume that the PAH molecules in space cover a much larger range of sizes, from a few tens of C atoms up to several thousands, with a mean size of 100 C atoms (see Li & Draine 2001). They could include larger alkyl side chains (ethyl, propyl, butyl, …), and several alkyl side chains might be present in one PAH molecule. Moreover, the alkyl side chains might be unsaturated (i.e., –CH=CH2, –CH=CH–, C=CH2, C=C–H; see Kwok & Zhang 2013). We have already argued that methyl side chains are more likely than larger alkyl side chains because of the photodissociation of the latter (also see Footnote 1).
In preliminary studies, we have examined all possible isomers of di-methyl-substituted pyrene and found that the methyl groups are essentially independent of each other. Noticeable effects on frequency and intensity only occur when several alkyl groups are placed in direct proximity. The study of larger PAHs obviously will be a target in future. However, the finding of the strong isomer dependency suggests that it will be more important to first learn about the probabilities of the formations of the various isomers. The effects of unsaturated side chains on the IR spectra remains to be examined. While the positions of the C–H stretches of simple alkenes and dienes coincide with the methyl signals of methyl-substituted PAHs, the aliphatic C–H stretches of styrene-type molecules (PAH–CH=CH2) and of their derivatives fall in the wavelength range shortward of the aromatic C–H stretch at 3.3 which are not seen in the ISM.
Kwok & Zhang (2013) argued that the 3.4 feature may not be the only manifestation of the aliphatic structures of the UIE emitters. They hypothesized that the clustering of aromatic rings may break up the simple methyl- or methylene-like side groups and hence the aliphatic components may take many other forms. They speculated that the in-plane and out-of-plane bending modes of these side groups may combine to emit the broad “plateau” emission around 8 and 12. We note that the PAH model naturally accounts for the so-called “plateau” emission through the combined wings of the C–C and C–H bands. Wagner et al. (2000) have experimentally shown that the plateau emission underlying the 3.3 feature is a general spectral feature of vibrationally excited PAHs containing aliphatic hydrogens, especially those containing methyl groups. The plateau emission may merely be an artificial result of decomposing the 3–20 UIE spectra into three components: the UIE bands, broad plateaus, and a thermal continuum. We also note that the clustering of aromatic rings and aliphatic chains would be accompanied by forming new C–C bonds and losing H atoms. Laboratory measurements of coals (similar to MAONs in structure) have shown that lowering the H content leads to aromatization (see Papoular 2001).
Finally, we note that in comparison with the median ratio of , some protoplanetary nebulae have a much larger ratio (see Figure 1), with the 3.4 feature exceeding the 3.3 feature (i.e., 1; Hrivnak et al. 2007). These are atypical UIE sources: their UIE spectra have most of the power emitted from two broad bands peaking at 8 and 11.8, while typical UIE spectra have distinctive peaks at 7.7, 8.6, and 11.3 (see Tokunaga 1997, Peeters et al. 2004). This is probably related to the fact these protoplanetary nebulae do not emit much UV starlight. Indeed, the 3.4 feature (relative to the 3.3 feature) appears stronger in regions illuminated by stars with a lower effective temperature (X.J. Yang et al. 2013, in preparation). It is likely that in the more benign, UV-poor environment of protoplanetary nebulae, fragile species such as aliphatic hydrocarbon chains produced in the outflow could attach to an aromatic skeleton. When evolving from the protoplanetary nebula phase to the more hostile, UV-rich planetary nebula phase, the aliphatic side chains are knocked off from the aromatic rings as the aliphatic bonds are not as stable against photodissociation as are aromatic bonds of normal PAHs. As a result, PAHs with aliphatic chains would not be expected to be numerous in UV-rich regions such as planetary nebulae and the ISM. In contrast, they could be present, perhaps even abundant, in more benign environments (e.g., protoplanetary nebulae).
5 Conclusion
We have examined the nature of the UIE emitters based on the 3.3 aromatic C–H emission feature and its associated satellite features at 3.4 and beyond, with special attention paid to the structure of the UIE carriers: are they mainly aromatic or largely aliphatic with a mixed aromatic/aliphatic structure? The major results are:
-
1.
We have compiled and analyzed the UIE spectra of 35 sources available in the literature which exhibit both the 3.3 and 3.4 C–H features. We have derived , the ratio of the power emitted from the 3.4 feature to that from the 3.3 feature for all these sources. With a median ratio of , the majority (31/35) of these sources has .
-
2.
We have computed , the band-strength ratio of the 3.4 aliphatic C–H feature to that of the 3.3 aromatic C–H feature, for a range of methyl-substituted PAHs, based on density functional theory. For these molecules, the ratios all exceed 1.4, with an average ratio of .
-
3.
By attributing the 3.4 feature exclusively to aliphatic C–H stretch (i.e., neglecting anharmonicity and superhydrogenation), we derive the fraction of C atoms in aliphatic form from and to be 2%. We conclude that the UIE emitters are predominantly aromatic.
References
- (1) Allamandola, L.J., Tielens, A.G.G.M., & Barker, J.R. 1985, ApJ, 290, L25
- (2) Allamandola, L.J., Tielens, A.G.G.M., & Barker, J.R. 1989, ApJS, 71, 733
- (3) Allamandola, L.J., Hudgins, D.M., & Sandford, S.A. 1999, ApJ, 511, 115
- (4) Barker, J.R., Allamandola, L.J., & Tielens, A.G.G.M. 1987, ApJ, 315, L61
- (5) Bernstein, M.P., Sandford, S.A., & Allamandola, L.J. 1996, ApJ, 472, L127
- (6) Cataldo, F., García-Hernández, D. A., & Manchado, A. 2013, MNRAS, 429, 3025
- (7) Cramer, C. J. 2004, Essentials of Computational Chemistry: Theories and Models, 2nd ed. (Wiley: New York)
- (8) d’Hendecourt, L.B., & Allamandola, L.J. 1986, A&AS, 64, 453
- (9) Draine, B.T., & Li, A. 2001, ApJ, 551, 807
- (10) Draine, B.T., & Li, A. 2007, ApJ, 657, 810
- (11) Duley, W.W., & Williams, D.A. 1981, MNRAS, 196, 269
- (12) Frisch, M. J., Trucks, G. W., Schlegel, H. B., et al. 2009, Gaussian 09, Revision B01, Gaussian, Inc., Wallingford CT
- (13) Geballe, T.R., Lacy, J.H., Persson, S.E., McGregor, P.J., & Soifer, B.T. 1985, ApJ, 292, 500
- (14) Geballe, T. R., Tielens, A. G. G. M., Allamandola, L. J., Moorhouse, A., & Brand, P. W. J. L. 1989, ApJ, 341, 278
- (15) Gillett, F.C., Forrest, W.J., & Merrill, K.M. 1973, ApJ, 183, 87
- (16) Goto, M., Usuda, T., Takato, N., et al. 2003, ApJ, 589, 419
- (17) Hwang, C.L., Jiang, J.C., Lee, Y.T., & Ni, C.K. 2002, J. Chem. Phys., 117, 15
- (18) Joblin, C., Tielens, A.G.G.M., Allamandola, L.J., & Geballe, T.R. 1996, ApJ, 458, 610
- (19) Jones, A. P., Duley, W. W., & Williams, D. A. 1990, QJRAS, 31, 567
- (20) Jourdain de Muizon, M., Geballe, T.R., d’Hendecourt, L.B., & Baas, F. 1986, ApJ, 306, L105
- (21) Hrivnak, B.J., Geballe, T.R., & Kwok, S. 2007, ApJ, 662, 1059
- (22) Koch, W., & Holthausen, M.C. 2001, A Chemist’s Guide to Density Functional Theory, 2nd ed. (Wiley-VCH: Weinheim)
- (23) Kwok, S., & Zhang, Y. 2011, Nature, 479, 80
- (24) Kwok, S., & Zhang, Y. 2013, ApJ, 771, 5
- (25) Léger, A., & Puget, J. 1984, A&A, 137, L5
- (26) Li, A., 2004, in Astrophysics of Dust, Witt, A.N., Clayton, G.C., & Draine, B.T. (eds.), ASP Conf. Ser., 309, 417
- (27) Li, A., & Draine, B.T. 2001, ApJ, 554, 778
- (28) Li, A., & Draine, B.T. 2002, ApJ, 572, 232
- (29) Li, A., & Draine, B.T. 2012, ApJ, 760, L35
- (30) Papoular, R. 2001, A&A, 378, 597
- (31) Papoular, R., Ellis, K., Guillois, O., Reynaud, C., & Nenner, I. 1993, J. Chem. Soc. Faraday Trans., 89, 2289
- (32) Pauzat, F., Talbi, D., & Ellinger, Y. 1999, MNRAS, 304, 241
- (33) Peeters, E., Allamandola, L.J., Hudgins, D.M., Hony, S., & Tielens, A.G.G.M. 2004, in Astrophysics of Dust (ASP Conf. Ser. 309), ed. A.N. Witt, G.C. Clayton, & B.T. Draine (San Francisco, CA: ASP), 141
- (34) Pendleton, Y.J., & Allamandola, L.J. 2002, ApJS, 138, 75
- (35) Sakata, A., Wada, S., Onaka, T., & Tokunaga, A.T. 1987, ApJ, 320. L63
- (36) Sandford, S.A. 1991, ApJ, 376, 599
- (37) Sandford, S. A., Bernstein, M. P., & Materese, C. K. 2013, ApJS, 205, 8
- (38) Schutte, W.A., Tielens, A.G.G.M., & Allamandola, L.J. 1993, ApJ, 415, 397
- (39) Sellgren, K., Luan, L., & Werner, M.W. 1990, ApJ, 359, 384
- (40) Sholl, D., & Steckel, J. A. 2009, Density Functional Theory: A Practical Introduction, Wiley-Interscience: New York
- (41) Sloan, G.C., Bregman, J.D., Geballe, T.R., Allamandola, L.J., & Woodward, C.E. 1997, ApJ, 474, 735
- (42) Sloan, C., Jura, M., & Duley, W.W., et al. 2007, ApJ, 664, 1144
- (43) Tielens, A. G. G. M. 2008, ARA&A, 46, 289
- (44) Tokunaga, A.T. 1997, in ASP Conf. Ser. 124, Diffuse Infrared Radiation and the IRTS, ed. H. Okuda, T. Matsumoto, & T. Roellig (San Francisco, CA: ASP), 149
- (45) Wagner, D.R., Kim, H., & Saykally, R.J. 2000, ApJ, 545, 854
- (46) Wexler, A.S. 1967, Appl. Spec. Rev., 1, 29