Episodic radio galaxies J01164722 and J1158+2621: can we constrain the quiescent phase of nuclear activity?
Abstract
We present multifrequency radio observations of two well known episodic FR II radio galaxies (J01164722 and J11582621) and a detailed investigation of the life-cycle of episodic radio galaxies from their spectral and radiative properties. Combining our previous work with the present results, we either constrain or place very good limits on the active and quiescent phases of a small sample of episodic FR II radio galaxies. The duration of the quiescent phase can be as small as the hotspot fading time of the previous episode, and as high as a few tens of Myr; however, for none of the sources in our sample is it close to the duration of the active phase of the previous episode. We also find that for many episodic radio galaxies, the nucleus is variable at radio wavelengths. For our small sample of 7 episodic radio galaxies, we find 4 to have strongly variable cores, a much larger proportion than is generally found in samples of normal FR II radio galaxies. Studies with larger samples will be required to establish a statistical association between core variability and episodic radio activity.
keywords:
galaxies: active – galaxies: nuclei – galaxies: individual: J01164722, J11582621 radio continuum: galaxies1 Introduction
The Jet Formation Activity (JFA) in radio galaxies is known to be episodic in nature. After the cessation of a given episode of JFA of a radio galaxy, when another episode starts with the formation of a new pair of jets propagating through the cocoon material left behind by the previous activity, the radio galaxy is known as an Episodic Radio Galaxy (ERG). Both Fanaroff-Railey type I (FR I) and type II (FR II) radio galaxies (Fanaroff & Railey 1974) show episodic JFA. Some of the most conspicuous FR II ERGs have been extensively studied in the radio (e.g. by Schoenmakers et al. 2000a, Schoenmakers et al. 2000b; Konar et al. 2006; Saikia et al. 2006; Jamrozy et al. 2007; Saikia et al. 2007; Konar et al. 2012). Among the prominent FR I ERGs are Cen A (Burns, Feigelson & Schreier 1983; Clarke, Burns & Norman 1992), Her A (Gizani & Leahy 2003) and 3C 388 (Burns, Schwendeman & White 1983; Roettiger et al. 1994). In each episode, a pair of jets produces a pair of lobes. If we observe a single pair of lobes in a radio galaxy, it may be called a Single-Double Radio Galaxy (SDRG); if we observe two pairs of lobes in a radio galaxy, it is customarily called a Double-Double Radio Galaxy (DDRG: Schoenmakers et al. 2000b); similarly, if three pairs of lobes are observed, it is christened a Triple-Double Radio Galaxy (TDRG, Brocksopp et al. 2007; Hota et al. 2011). We confine ourselves to the episodic behaviour of FR II radio galaxies (where compact hotspots are seen) in this paper.
Although episodic jet formation has been unanimously accepted as the model for the origin of the inner double(s) of DDRGs and TDRGs, there are two plausible models in the literature to explain how the inner doubles assume the structure they have. In the first of these models (hereafter the ‘classical FR II model’), the inner lobes are formed in the same way as the SDRGs and outer doubles of DDRGs are formed, i.e., by the back-flowing relativistic plasma injected at the hotspots; in the second model, (hereafter the ‘bow shock model’) the inner doubles are created by the re-acceleration of the outer cocoon particles at the bow shocks created by the almost ballistically moving jet heads (Brocksopp et al. 2007, 2011; Safouris et al. 2008).
The inner doubles often seem to have very elongated lobes inflated on the two opposite sides with backflow-like structure present in the contour maps (Konar et al. 2006; Safouris et al. 2008). In many cases, it is quite clear that the structure of the inner lobes has quite different aspect ratio to that of the outer doubles (e.g., J14533308: Konar et al., 2006; J15483216: Safouris et al. 2008; J01164722: Saripalli et al. 2002). Other details in detailed structure are also seen; for example, in some of the inner lobes, e.g., the inner northern lobe of J14533308 (Konar et al. 2006), no compact hotspot is observed in sub-arcsec resolution, with the jet head showing a wedge-shaped structure instead. Using multi-frequency data, Safouris et al. (2008) found that there is not much variation of the two-point spectral index along the lobe axis of the inner double of J15483216. The strong variation of two-point spectral index along the lobe axis (i.e., the steepening of spectral index from the hotspots towards the tails of the lobes) is taken in normal FRII sources to be strong evidence for backflowing jet material. Does the absence of variation of spectral index along the lobe axis imply that the hotspots in the inner lobes are moving faster than they would in SDRG? This faster hotspot motion would mean that all the lobe plasma has been deposited in a shorter time (say in a few yr) along the lobe axis by the backflow process, thus explaining the absence of strong variation of spectral index along the lobe axis of the inner lobes.
A faster hotspot speed for the inner doubles is qualitatively quite consistent in the ‘classical FRII model’ with the tenuous outer cocoon material through which the inner doubles must propagate. However, problems arise when we think of the momentum balance equation at the hotspot and try to connect that with the backflow formation. The faster the hotspot speed, the weaker should be the backflow. This can be seen qualitatively by comparing two extreme cases. When the hotspot velocity is zero, all the jet material coming out of the jet will impinge on the ambient medium and flow backward with very high backflow velocity, provided it is confined in the lateral direction within a certain radius around the jet axis. On the other hand, when the hotspot velocity is the same as the jet bulk velocity, then the jet is ballistic and essentially no jet matter is injected into the cocoon, hence there is no backflow. So, it can be seen that the greater the hotspot velocity, the less is the amount of jet matter injected into the cocoon for a given jet power, and hence the backflow velocity will be lower. In fact, though, we see that the inner lobes extend all the way back to the core in some cases, e.g. for the southern inner lobes of J1453+3308 (Konar et al. 2006), presenting a problem for this simple model. To solve this problem Kaiser et al. (2000) have proposed that thermal material is ingested into the outer lobes of DDRGs during their growth and quiescent phases, and that the inner lobes actually propagate through a denser medium than would be expected purely from a consideration of the synchrotron-emitting plasma. However, there is as yet no direct evidence of this thermal material in the lobes.
If, on the other hand, the jet is ballistic, then the jet head will drive a bow shock in the ambient medium, and this motivates the ‘bow shock model’, in which the bow shock driven by the ballistic or almost ballistic jets of an inner double propagating through the cocoon material of the outer lobes gives rise to the structure of the inner double by re-accelerating the relativistic particles of outer cocoon (Brocksopp et al., 2007; 2011). This bow-shock model is consistent with the simulation done by Clarke & Burns (1991) who showed that the jets propagate almost ballistically through the old lobe and do not form any significant lobes embedded in the material of the outer lobes. Though for B0925+420 (Brocksopp et al. 2007), J1453+3308 and J1835+6204 (Brocksopp et al. 2011) the inner doubles were found to be consistent with the bow-shock model, Safouris et al. (2008) ruled out any detection of bow shocks exterior to the inner double of PKS B1545-321. It is quite plausible that either of the two models, namely classical FR II model and bow shock model, of the inner double may be required to explain the dynamics and structure of the inner doubles, depending upon the inner jet power and the matter density of the outer cocoon (this will be discussed in detail by Konar & Hardcastle, in preparation). When compact hotspots are observed, the classical FR II model should be valid, while the absence of hotspots in both sides of the inner double can be explained by the absence of jet termination shock and the presence of bow shock. However, Konar & Hardcastle (in preparation) recently found that the injection index of inner and outer doubles for most of the aligned DDRGs are similar. This result cannot be explained in terms of the bow-shock model. So we would expect that both the classical FR II model and the bow-shock model may need to be employed simultaneously to fully describe the dynamics and the structure of the inner doubles. Brocksopp et al. (2011) showed, through their work on J1453+3308 and J1835+6204, that if the bow-shock model is to be valid for the inner double, then there is no compelling need for the thermal gas ingestion, as proposed by Kaiser et al. (2000), from the ambient medium into the outer lobes for the confinement of the inner lobes.
It is clear from the above discussion that the study of DDRGs is very important to understand the dynamics of FR II jets, FR II lobes, the interaction between jet and ambient medium and the interaction between the thermal matter (in ambient medium) and non-thermal matter (in outer lobes). In this paper we present a detailed radio study with the Giant Meterwave Radio Telescope (GMRT) and Very Large Array (VLA) of two well known DDRGs, J01164722 and J1158+2621. All the results obtained in this paper will be employed in our forthcoming paper that will present the XMM-Newton X-ray observational results and a detail study on the dynamics of these two sources (Konar et al., in prep). We present observations and data reduction in Section 2, our observational results in Section 3, our spectral ageing analysis in Section 4, discussion in Section 5 and concluding remarks in Section 6.
The cosmological parameters that we uses are km s-1 Mpc-1, and (Spergel et al. 2003). The redshifts are 0.146101 (Danziger & Goss 1983) for J01164722 and 0.112075 (SDSS DR6, as provided by NED) for J1158+2621 respectively. In this cosmology, 1 arcsec corresponds to 2.530 kpc for the source J01164722, situated at a luminosity distance, Mpc. The physical sizes (from peak to peak) of the inner and outer doubles of this source are and kpc respectively. For J1158+2621, 1 arcsec corresponds to 2.015 kpc and its luminosity distance is Mpc. The physical sizes of the inner and outer doubles of this source are and kpc respectively.
2 Observations and data reduction
The GMRT data with the project code (10CKa01) are our own observations and the remainder are public data from the GMRT and VLA archives. The observing log of both GMRT and VLA data is given in Table 1.
2.1 GMRT observations and data reduction
All our GMRT observations were done in the continuum mode at 150, 325, 610 and 1280-MHz band in the standard manner. Flux density calibrators were observed for about 10-15 min in each scan either in the beginning, or at the end, or in both the beginning and end, depending upon the situation. Phase calibrators were observed by min in each scan. The scans of observations of a target-source were interspersed with the phase calibrator scans. One of 3C48, 3C147 and 3C286 was observed as a flux density calibrator. Observations of each target source were done in a full-synthesis run of approximately 9 hours including calibration overheads at a given frequency. The on-source observing time varies from 80 to 360 min (see observing log in Table 1). The GMRT data were calibrated and
| Source | Teles- | Array | Obs. | Bandwidth | On source | Obs. Date | Project |
| cope | Conf. | Freq. | used for | observing | code | ||
| mapping | time | ||||||
| (MHz) | (MHz) | (min) | |||||
| (1) | (2) | (3) | (4) | (5) | (6) | (7) | (8) |
| J01164722 | GMRT† | 333.75 (P) | 12.50 | 242 | 13-MAR-2008 | 13JMa01 | |
| GMRT† | 618.75 | 12.50 | 253 | 06-MAR-2008 | 13JMa01 | ||
| GMRT† | 1287.88 (L) | 12.50 | 249 | 26-NOV-2009 | 17074 | ||
| J1158+2621 | GMRT | 153.28 | 5.06 | 360 | 11-AUG-2006 | 10CKa01 | |
| GMRT | 240.25 | 5.00 | 307 | 17-JUL-2006 | 10CKa01 | ||
| GMRT | 331.88 (P) | 12.50 | 270 | 15-JUN-2006 | 10CKa01 | ||
| GMRT | 150.25 | 6.25 | 160 | 31-MAY-2006 | 10CKa01 | ||
| GMRT | 332.50 (P) | 12.50 | 300 | 16-JUN-2006 | 10CKa01 | ||
| GMRT | 617.50 | 12.50 | 80 | 13-MAY-2006 | 10CKa01 | ||
| GMRT | 1287.50 (L) | 12.50 | 340 | 22-JUN-2006 | 10CKa01 | ||
| VLA | D | 4860.10 (C) | 100.00 | 14 | 27-JUN-2008 | AM954 | |
| VLA | DnC | 4860.10 (C) | 100.00 | 7 | 19-JUN-2008 | AS943 | |
| VLA | DnC | 4860.10 (C) | 100.00 | 1.5 | 24-OCT-2005 | AL663 | |
| VLA | A | 8439.90 (X) | 100.00 | 2 | 03-MAY-1990 | AB568 | |
| VLA | DnC | 8460.10 (X) | 100.00 | 0.8 | 24-OCT-2005 | AL663 | |
| VLA | A | 8460.10 (X) | 100.00 | 0.7 | 05-APR-1998 | AM593 | |
| VLA | DnC | 8460.10 (X) | 100.00 | 4.5 | 19-JUN-2008 | AS943 | |
| VLA | DnC | 22460.1 (K) | 100.00 | 2 | 24-OCT-2005 | AL663 | |
| VLA | D | 22460.1 (K) | 100.00 | 3 | 06-SEP-2008 | AS943 | |
| VLA | DnC | 43339.9 (Q) | 100.00 | 4.6 | 30-OCT-2005 | AL663 |
†: GMRT archival data. The rest of the GMRT data are from our own observations.
imaged using the NRAO software package, AIPS in the standard way. The flux density calibration are according to the scale of Baars et al. (1977) in all frequencies. A few rounds of phase-only self-calibration were carried out on each data set to correct the visibility phase. No amplitude self-calibration was used.
2.2 VLA data and their reduction
All the VLA data we have analysed for this paper are the archival VLA data for the source J1158+2621. The other source has no high frequency (2 GHz) data. We have analysed the VLA data at various frequency bands (4.8, 8.4, 22.5 and 43.3 GHz) to image J1158+2621. All VLA observations are in snapshot mode. The on-source observing time varies from 114 min (see Table 1). The calibrator selections and observing procedures and imaging are quite similar to what were done for GMRT data (see Section 2.1). All flux densities are on the Baars et al. (1977) scale. A few rounds of phase-only self-calibration were carried out on each data set to correct the visibility phase.
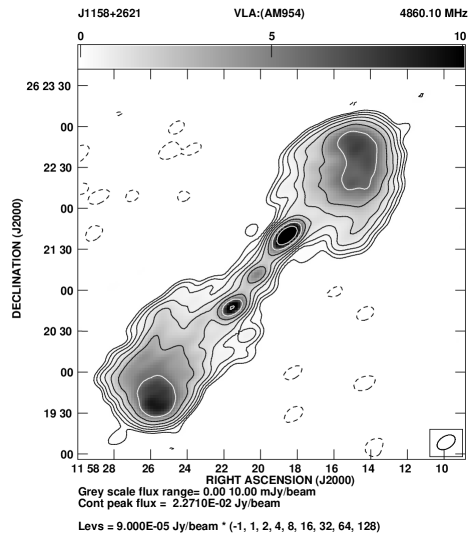
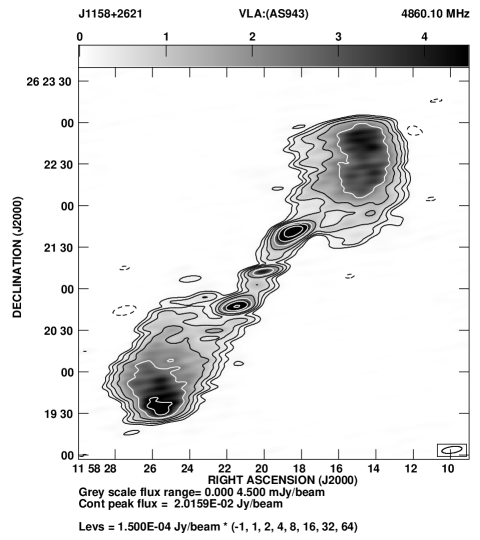
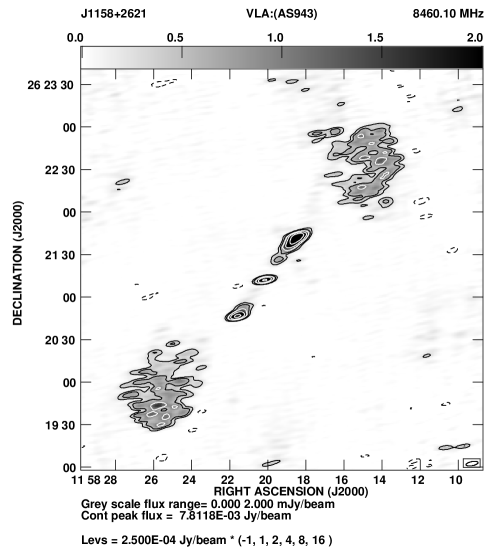
2.3 Short spacings and flux reliability
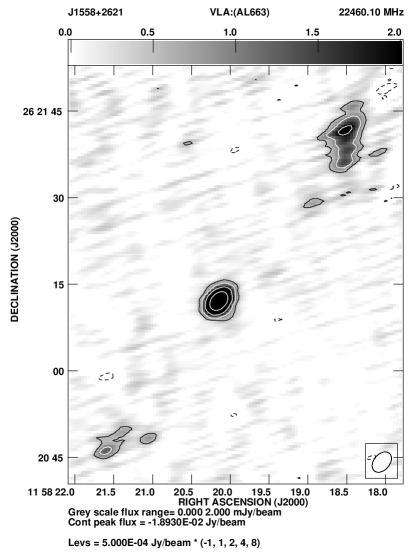
Our target sources, J01164722 and J1158+2621 have sizes of and 4 arcmin respectively. The shortest baseline for the C and D configurations of the VLA is 35 m. Even though most of the images of J1158+2621 (Figure 2) seem to show the largest size of a single emission region to be the entire 4 arcmin source, mostly this is due to the effects of poor resolution at lower frequencies. Measuring the flux densities of different regions of this source, we realised that the total flux density of the outer cocoon plasma in the region of the inner double is a small fraction of both the integrated flux density as well as the outer double flux density of J1158+2621. Moreover, that particular region, being at the middle of the entire source must contain the oldest plasma of the outer cocoon and is very likely to have a very steep spectral index (1), which means that the total flux density of that region will be an even lower fraction of the integrated flux density and outer double flux density at VLA higher frequencies. Therefore, the largest emission region of dominant flux density for J1158+2621 is only 2 arcmin in size, i.e., half of the total source size. All of the VLA maps that were used for the diffuse emission measurements of J1158+2621 were made from either D-array or DnC-array data which can map structures of 3 arcmin in size at X band without loss of flux. We conclude that the VLA flux densities of J1158+2621 at L, C and X band that we present in the following section should not be significantly affected by loss of flux due to lack of low spacings in the uv-coverage in the data. However, at frequencies higher than 8.4 GHz, the VLA images will necessarily miss some flux on large scales. The shortest baseline of the GMRT is 100 m; we can safely map single emission regions of dimension arcmin at 1280 MHz without loss of flux, and even larger structures at lower frequencies, and so all GMRT observations of J1158+2621 should fully sample the source.
Given that J01164722 has a size ( arcmin) greater than 7 arcmin which is the largest dimension of a single emission region that GMRT can map at L band, the question arises whether our L-band GMRT image has lost flux density due to low spacings. Since the bright portion of the emission regions that contribute most of the total flux has sizes not more than the half of the largest angular size of the source, the GMRT L band image might be expected not to lose an appreciable amount of flux in L band image due to lack of low spacings. However, because of the low declination of the source GMRT could only observe it at a very low elevation angle; the coverage is therefore extremely skewed and, in addition, the GMRT was susceptible to unwanted terrestrial signals. As a result the quality of the GMRT data for J01164722 were bad in general, but the L band data were worse than any other band for J01164722, and a good deal of flagging was necessary, particularly on short baselines. Conservatively, we assume that there is likely to be missing flux in the GMRT L-band image of J01164722, and so we have not used this image for the detailed spectral ageing analysis.
3 Observational results
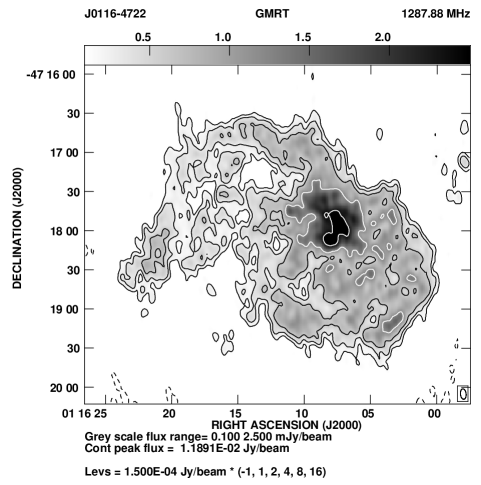
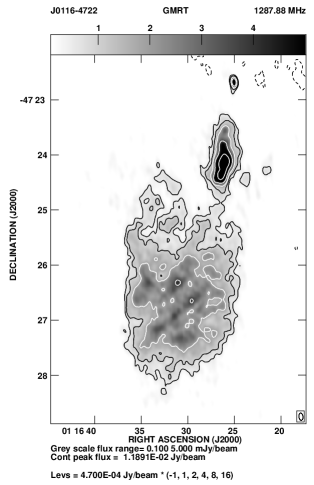
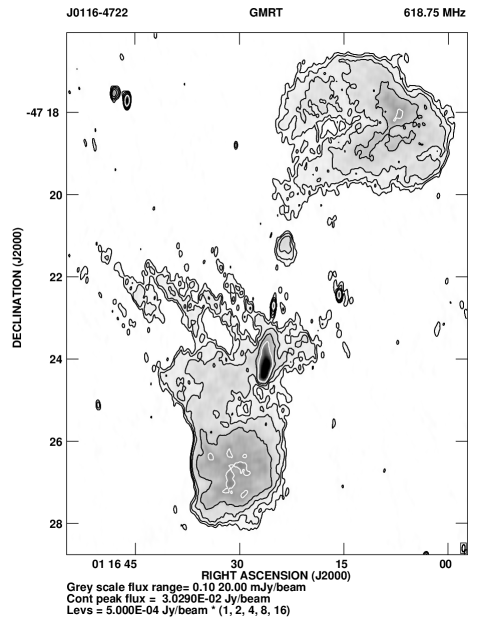
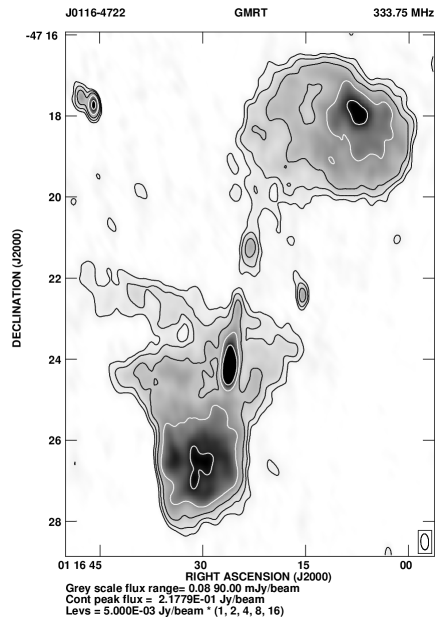
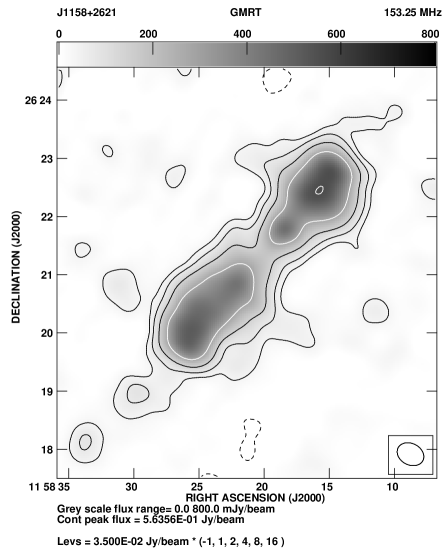
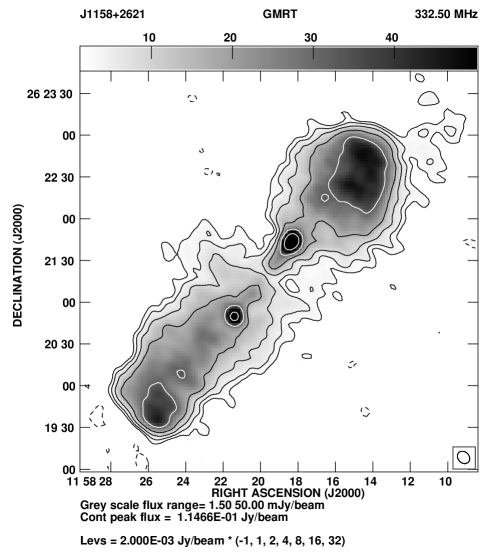
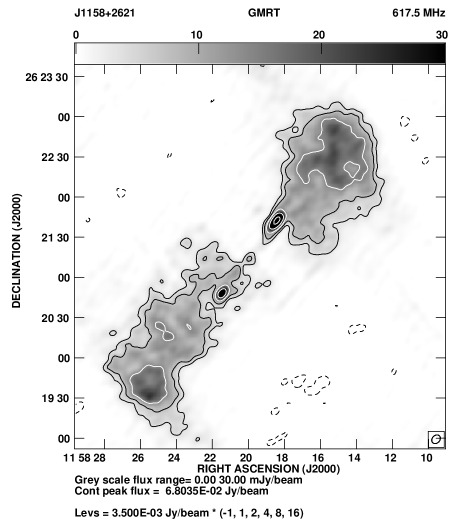
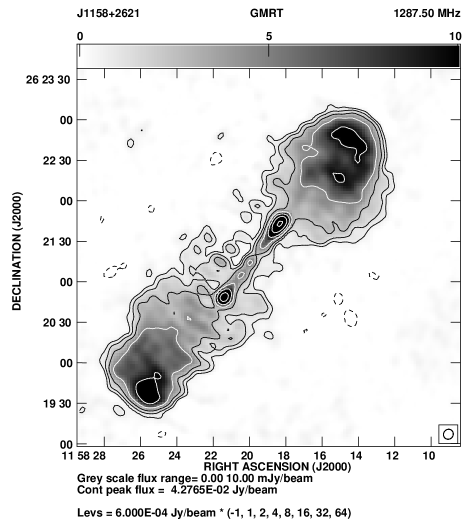
The radio images are presented in Figures 1 and 2, and the measurements of flux densities and observational parameters at various frequencies are presented in Tables 2 and 3. For convenience we have followed the following component designations. The outer north-western and south-eastern lobes of J1158+2621 are designated NW1 and SE1 lobes respectively; and for the inner north-western and south-eastern lobes of the same source are designated NW2 and SE2 lobes respectively. NW1&2 indicates NW1+NW2 and SE1&2 indicates SE1+SE2. For J01164722, we designate the outer northern and southern lobes as N1 and S1 lobes respectively. Similarly, inner northern and southern lobes are the N2 and S2 lobes respectively.
In the 150-MHz image of J1158+2621 the inner and the outer doubles are not resolved. The inner lobes of both the sources in high-resolution images seem to have edge-brightened structures, resembling normal FR II radio lobes in morphology. However, the outer lobes have plateaux of surface brightness towards their far ends in higher-resolution images. We see a peak of emission at the outer end of each outer lobe in low-resolution images. These were presumably the locations of the hotspots when the outer sources were active, and we refer to these locations, which do not now meet morphological criteria for being hotspots, as ‘warm spots’.
Flux densities that were measured directly by us from the FITS maps (either made by us or from the survey) with the AIPS task TVSTAT are assumed to have absolute flux calibration errors of 5 per cent at 1400, 4860 and 8460 MHz (VLA), 7 per cent at 1287 and 610 MHz (GMRT) and 15 per cent at 332, 240 and 153 MHz (GMRT). Flux densities collected from the literature are assumed to have the errors quoted in the literature. Other flux density values, which were not directly measured from the FITS maps but estimated by various means, have been assigned errors determined by propagating errors from the errors of directly measured flux densities.
| Freq. | Beam size | rms | SI | Cp | Sp | St | Cp | Sp | St | Cp | Sp | St | ||
|---|---|---|---|---|---|---|---|---|---|---|---|---|---|---|
| MHz | ′′ | ′′ | ∘ | mJy | mJy | mJy | mJy | mJy | mJy | mJy | mJy | |||
| /b | /b | /b | /b | |||||||||||
| (1) | (2) | (3) | (4) | (5) | (6) | (7) | (8) | (9) | (10) | (11) | (12) | (13) | (14) | (15) |
| G333.75 | 23.63 | 11.71 | 2.5 | 1.05 | 10080 | N1 | 98.8 | 4058 | N2 | 29 | 86 | S1+S2+C | 218 | 5961 |
| G618.75 | 10.42 | 4.30 | 356 | 0.17 | 5022 | N1 | 9.44 | 1915 | N2 | 3.35 | 41 | S1+S2+C | 30 | 3060 |
| G1287.50† | 8.01 | 4.34 | 6.4 | 0.05 | 1520 | N1 | 2.96 | 464 | N2 | S1+S2+C | 12 | 1021 | ||
a: three sigma limit.
| Freq. | Beam size | rms | SI | Cp | Sp | St | Cp | Sp | St | Cp | Sp | St | Cp | Sp | St | ||
|---|---|---|---|---|---|---|---|---|---|---|---|---|---|---|---|---|---|
| MHz | ′′ | ′′ | ∘ | mJy | mJy | mJy | mJy | mJy | mJy | mJy | mJy | mJy | mJy | ||||
| /b | /b | /b | /b | /b | |||||||||||||
| (1) | (2) | (3) | (4) | (5) | (6) | (7) | (8) | (9) | (10) | (11) | (12) | (13) | (14) | (15) | (16) | (17) | (18 ) |
| G153.25 | 28.80 | 22.07 | 63 | 10.10 | 9869 | NW1&2 | 564 | 4360 | NW2 | SE1&2 | 514 | 5081 | S2 | ||||
| G332.50 | 9.74 | 7.91 | 44 | 0.54 | 4197 | NW1&2 | 115 | 2208 | NW2 | SE1&2 | 78 | 1978 | S2 | ||||
| G617.50 | 7.14 | 5.66 | 315 | 0.79 | 3309 | NW1&2 | 68 | 1770 | NW2 | SE1&2 | 45 | 1532 | S2 | ||||
| G1287.50 | 2.94 | 2.59 | 75 | 0.080 | 1238 | NW1&2 | 17 | 669 | NW2 | SE1&2 | 16 | 571 | S2 | ||||
| V4860.10a | 14.55 | 9.01 | 301 | 0.024 | 293 | NW1&2 | 23 | 154 | NW2 | SE1&2 | 12 | 132 | S2 | ||||
| V4860.10b | 14.62 | 4.68 | 278 | 0.043 | 296 | NW1&2 | 16 | 156 | NW2 | SE1&2 | 10 | 133 | S2 | ||||
| V8460.10b | 8.60 | 2.85 | 281 | 0.060 | 126 | NW1 | 1.32 | 49 | NW2 | 7.81 | 22 | SE1 | 1.65 | 44 | S2 | 4.94 | 8.65 |
| V8460.10c | 9.55 | 8.37 | 17 | 0.23 | 157 | NW1 | 4.55 | 61 | NW2 | 12.62 | 20 | SE1 | 4.98 | 60 | S2 | 5.94 | 8.44 |
| V22460.10c | 4.00 | 2.75 | 319 | 0.24 | 21 | NW2 | 2.37 | 9.37 | S2 | 1.23 | 3.18 | ||||||
a: The project code of the data is AM954. b: The project code of the data is AS943. c: The project code of the data is AL663.
| Freq. | Beam size | Err | Err | Err | Project | |||||
| (MHz) | ∘ | (mJy) | (mJy) | (mJy) | (mJy) | (mJy) | (mJy) | code | ||
| (1) | (2) | (3) | (4) | (5) | (6) | (7) | (8) | (9) | (10) | (11) |
| 617.5 | 4.89 | 3.90 | 311 | 195 | 10 | 72 | 5.0 | 123 | 8.6 | c |
| 1287.5∗ | 2.85 | 2.45 | 72 | 124 | 6.5 | 41 | 3.0 | 83 | 6.0 | c |
| 4860.1∗ | 12.81 | 6.01 | 287 | 45 | 1.7 | 13 | 0.7 | 32 | 1.6 | d |
| 8460.1∗ | 7.51 | 2.49 | 280 | 29.5 | 1.1 | 9 | 0.4 | 20.5 | 1.0 | e |
| 22460.1 | 5.09 | 4.58 | 332 | 12.5 | 0.5 | 3.5 | 0.2 | 9 | 0.5 | f |
∗: The spectra have been constrained with these data points only, as the quality of the 617- and 22460-MHz data is not good enough (see Figure 2). However, the inner double flux densities at those two frequencies are consistent with the extrapolation of the spectra constrained from the three data points indicated by asterisks.
c: 10CKa01, d: AS943+AM954+AL663, e: AS943+AM593+AL663+AB568, f: AL663+AS943
| Frequency | Component | Error | Component | Error | Component | err. | Reference | |||
|---|---|---|---|---|---|---|---|---|---|---|
| MHz | mJy | mJy | mJy | mJy | mJy | mJy | ||||
| (1) | (2) | (3) | (4) | (5) | (6) | (7) | (8) | (9) | (10) | (11) |
| 80.00 | Int | 34986a | 3400 | N1+S1 | 33081 | 3542 | 1 | |||
| 151.50 | Int | 22238 | 2224 | N1+S1 | 21020 | 2241 | 2 | |||
| 333.75 | Int | 10080 | 1512 | N1+S1 | 9379 | 1516 | 3 | |||
| 408.00 | Int | 11742b | 1174 | N1+S1 | 11133 | 1177 | 1, 4 | |||
| 618.75 | Int | 5022 | 351 | N1+S1 | 4565 | 354 | 3 | |||
| 843.00 | Int | 4485 | 224 | N1+S1 | 4119 | 226 | 5 | |||
| 1287.50 | Int | 1520†† | 106 | N1+S1 | 3 | |||||
| 1376.00 | Int | 2900 | 145 | N2+S2 | 260 | 13 | 2640 | 146 | 6 | |
| 1410.00 | Int | 2308c | 231 | N1+S1 | 2052 | 231 | 1, 4 | |||
| 2496.00 | Int | 1600 | 80 | N2+S2 | 170 | 8.5 | N1+S1 | 1429 | 81 | 6 |
| 2700.00 | Int | 706d | 29 | N1+S1 | 544 | 32 | 7, 4 | |||
| 5000.00 | Int | 280d | 22 | N1+S1 | 175 | 26 | 7, 4 | |||
| 8400.00 | Int | 71†e | 30 | N1+S1 | 8, 4 |
: The power law spectrum of the total inner double (without the core) has been constrained from these two flux densities (with 5 per cent error) from Saripalli et al. (2002). We assume that the inner double is a power law between 80 and 8400 MHz (with ), since we observe the same trend in the inner doubles of other DDRGs. The flux density of the total inner double at any other frequency between 80 and 8400 MHz has been estimated from the extrapolation of this power law (see Section 3.1).
†: There seems to be loss of flux density in the diffuse outer lobes in this measurements, as this flux density falls on the extrapolation of the power law spectrum of total inner double. So, this point has not been used in the outer double spectrum.
††: While compared with the flux densities of all other frequencies, we noticed that there is indeed loss of flux density in the diffuse outer lobes. Besides, because of the severe effects of RFI on the data the N2-lobe has not been detected. So, this point has not been used in determining the inner and outer double spectra, as discussed in the text (Section 2.3).
a: The original flux density value was on the CKL scale (see Conway, Kellermann & Long, 1963). Baars et al. (1977) give a scaling factor of 1.029 in their Table 7 to convert into the scale of Baars et al. We have multiplied the original flux density by this scaling factor to get this value.
b: The original flux density was on the CKL scale. So, we have multiplied the original flux density with 1.129 as given in Baars et al. (1977) to get this value.
c: The original flux density was on the CKL scale. So, we have multiplied the original flux density with 1.099 as given in Baars et al. (1977).
d: The original measurements were made using the Parkes single-dish telescope at 2.7 and 5.0 GHz (Wright, Savage & Bolton 1977). However, Wall, Wright & Bolton (1976), stated that ‘The scale factor for flux density’ was determined by comparing the apparent flux density for Hydra A with the adopted values of 23.5 and 13.0 Jy at 2700 and 5009 MHz respectively. Table 6 of Baars et al. (1977) quoted that the flux densities for Hydra A (3C218) are 23.7 Jy at 2700 MHz and 13.5 Jy at 5000 MHz. So, we have multiplied the 2700-MHz flux densities by 1.0085 and 5000-MHz flux density by 1.0385 to convert them into the scale of Baars et al.
e: This measurement was made using the Parkes single-dish telescope at 8.4 GHz. As flux calibrators Virgo A and Hydra A were used with flux density of 45.0 and 8.4 Jy respectively at 8.4 GHz. According to the polynomial equations given by Baars et al. (1977) the flux densities of Virgo A and Hydra A at 8400 MHz are 46.33 and 8.43 Jy respectively. So the conversion factors to Baars et al.’s scale at 8.4 GHz are 1.0296 and 1.0036 as obtained from Virgo A and Hydra A respectively. So, we have multiplied the original flux density by the mean factor of 1.0166 to convert the 8.4-GHz flux density to the scale of Baars et al.
References: The references are to the total flux densities.
1: Bolton, Gardner & Mackey (1964) 2: Udaya-Shankar et al. (2002) (This flux density measurement is with the Mauritius Radio Telescope). 3: This paper. 4: Wright, Otrupcek (1990): Parkes Catalogue. 5: Bock, Large & Sadler (1999): Sydney University Molonglo Sky Survey. 6: Saripalli, Subrahmanyan, Udaya-Shankar (2002). 7: Wright, Savage & Bolton (1977). 8: Wright et al. (1991).
| Frequency | Component | Error | Component | Error | Component | err. | Reference | |||
|---|---|---|---|---|---|---|---|---|---|---|
| MHz | mJy | mJy | mJy | mJy | mJy | mJy | and | |||
| comment | ||||||||||
| (1) | (2) | (3) | (4) | (5) | (6) | (7) | (8) | (9) | (10) | (11) |
| 22.00 | Int | 38000 | 4000 | NW1+SE1 | 35304 | 4050 | 1 | |||
| 26.30 | Int | 37555 | 8120 | NW1+SE1 | 35205 | 8139 | 2 | |||
| 80.00 | Int | 13962 | 2290 | NW1+SE1 | 12964 | 2304 | 3 | |||
| 153.25 | Int | 9869 | 1480 | NW1+SE1 | 9264 | 1488 | 4 | |||
| 160.00 | Int | 6438 | 773 | NW1+SE1 | 5853 | 788 | 5 | |||
| 332.50 | Int | 4197 | 630 | NW1+SE1 | 3864 | 637 | 4 | |||
| 617.50 | Int | 3309 | 232 | NW2+SE2 | 195† | 10 | NW1+SE1 | 3114 | 232 | 4 |
| 635.00 | Int | 3105 | 159 | NW1+SE1 | 2902 | 169 | 6 | |||
| 1287.50 | Int | 1238 | 87 | NW2+SE2 | 124 | 6.5 | NW1+SE1 | 1114 | 87 | 4 |
| 1400.00 | Int | 1027 | 51 | NVSS | ||||||
| 1400.00 | Int | 1098 | 100 | 7 | ||||||
| 1400.00 | Int | 1047 | 59 | 8 | ||||||
| 1400.00 | Int(avg) | 1057 | 42 | NW1+SE1 | 947 | 54 | 9 | |||
| 1410.00 | Int | 900 | 128 | NW1+SE1 | 790 | 132 | 10 | |||
| 2700.00 | Int | 550 | 26 | NW1+SE1 | 484 | 34 | 11 | |||
| 4830.00 | Int | 296 | 41 | NW1+SE1 | 254 | 43 | 12 | |||
| 4850.00 | Int | 311 | 32 | NW1+SE1 | 269 | 35 | 13 | |||
| 4860.10a | Int-c | 289 | 15 | NW2+SE2 | 45 | 1.7 | NW1+SE1 | 244 | 15 | 4 |
| 8460.10b | Int-c | 147 | 7.4 | NW2+SE2 | 29.5 | 1.1 | NW1+SE1 | 118 | 7.5 | 4 |
| 22460.10c | NW2+SE2 | 12.5† | 0.5 | 4 |
: The power-law spectrum of the total inner double (without the core) has been constrained by a least-squares fit to these data, and extrapolated to the lowest frequency. The flux density of the total inner double at any other frequency has been estimated from the fitted power law (see Section 3.1).
†: These two flux density values for the total inner double fall on the extrapolation of the best-fitting power-law spectrum constrained from the three data points marked by asterisks. So, even if we were to use these two data points along with those three in constraining the power law spectrum of the inner double, the free parameters have similar best fit values.
a: The flux measurements are from the map made with multiple VLA archival data sets with project codes AS943, AM954 and AL663.
b: The flux measurements are from the map made with multiple VLA archival data sets with project codes AS943, AM593, AL663 and AB568.
c: The flux measurements are from the map made with multiple VLA archival data sets with project codes AL663 and AS943.
References and comments: The references are to the total flux densities.
NVSS: NRAO VLA Sky Survey. 5 per cent error in integrated flux has been assumed.
1: Both flux density and error values are from Roger, Costain & Stewart (1986). 2: A factor of 1.015 (from Kühr et al., 1981) has been multiplied by the original flux density (and error as well) as quoted by Viner & Ericson (1975) to bring it to the scale of Baars et al. (1977). 3: The original flux density has been multiplied by a factor of 1.074 (from Kühr et al., 1981) to bring it to the scale of Baars et al. (1977). The flux density value is quoted in the Culgoora-2 catalogue (Slee & Higgins, 1975) and Culgoora-3 (Slee, 1977). The error is estimated to be 16.4 per cent from the recipe given by Slee (1977) and Slee & Higgins (1975). 4: We have made radio images and measured the fluxes from the FITS images. The data are either from our observations or from the archive. 5: The original flux density was multiplied by a factor of 1.11 (from Kühr et al., 1981) to bring it to the scale of Baars et al. (1977). The flux density value is quoted in the Culgoora-3 catalogue (Slee, 1977). The error has been estimated to be 12 per cent from the recipe given by Slee (1977). 6: The original flux density has been multiplied by a factor of 1.035 (from Kühr et al., 1981) to bring it to the scale of Baars et al. (1977). Flux density value is available in PKS90 catalogue (Wright & Otrupcek, 1990) has been estimated from the recipe given by Willis (1975). 7: The flux density is from White & Becker (1992). The error is the flux density limit of the survey. 8: The flux density and error is from Condon & Broderick (1985). 9: The integrated flux is the average of the above 3 1400-MHz fluxes. 10: The flux is available in PKS90 catalogue (Wright & Otrupcek, 1990). The error has been estimated to be 128 mJy from the recipe given by Ekers (1969). density value is available in PKS90 catalogue (Wright & Otrupcek, 1990). from the recipe given by Savage et al. (1977). 12: The flux density value is from Langston et al., (1990). The error is the flux density limit of the survey. 13: The flux density value is from Becker et al. (1991). The error has been estimated to be mJy from the recipe given by Becker et al. (1991).
3.1 Constraining radio spectra
Our flux density measurements are supplemented by flux densities from the literature to constrain the radio spectra of different components of these sources. The flux densities (with errors) of various components (integrated, inner double and outer double) of J01164722 and J1158+2621 are listed in Tables 5 and 6 respectively. The detail procedure that we have followed to constrain the radio spectra are described in detail by Konar et al. (2012). For correctly determining the flux densities of the inner double of J1158+2621 (see Table 4), we re-mapped the field at higher frequencies (namely 1287, 4860 and 8460 MHz) with a common lower uv-cutoff of 2.8 k, so that we can get rid of the outer diffuse emission as far as possible. No appreciable curvature is visible in the spectra of the individual inner lobes and the entire inner double within our observed frequency range. Therefore, we have fitted power laws to the inner double component flux densities of J1158+2621 listed in Table 4. The best-fitting power law for the total inner double of this source is . The same for the NW2 and SE2 lobes of this source are and respectively. In these expressions is in mJy and is in MHz. The inner double spectrum has been extrapolated down to our lowest observed frequency. The total flux densities of the inner double at all other frequencies are calculated from this fitted power law by extrapolation, and the errors by propagating the errors of the best-fitting parameters according to the equation below (see Section 4.1 of Konar et al. 2012).
| (1) |
where is the flux density in mJy at a given frequency, in MHz. is the normalisation of the power law. and and are 1 error of the normalisation, and spectral index, respectively. The unit of is also mJy.
For the source J01164722, our GMRT L-band data are affected by Radio Frequency Interference (RFI) and have a skewed uv coverage because of its low declination, as noted above (Section 2.3). Lower-frequency GMRT data have too poor resolution for the inner double to be mapped without any contamination from the diffuse emission of the outer lobes. There are no data at high frequencies except at 1376 and 2496 MHz, which are Australia Telescope National Facility (ATNF) data published by Saripalli et al. (2002). Therefore, for the inner double of J01164722, we have assumed that the spectrum of the total inner double is a power law with (Saripalli et al. 2002) and normalization of mJy at 1376 MHz (Saripalli et al. 2002). The flux densities of the total inner double at all other frequencies have been calculated from this power law and the errors have been calculated from Equation 1.
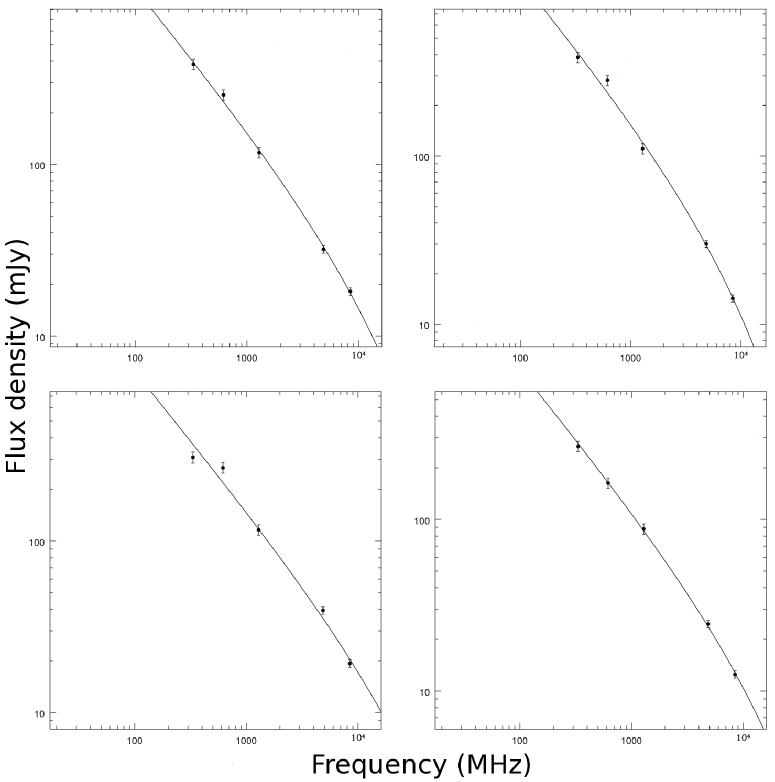
In order to estimate the flux densities of the total outer doubles, we subtracted the flux densities of the total inner doubles and the cores from the integrated flux densities. The spectral ageing JP model (Jaffe & Perola 1973) has been fitted to the flux densities of the outer doubles. The fitted spectra of inner and outer doubles are shown in Figures 4. All the flux density measurements (literature values as well as our measurements) of integrated, outer double and inner double are listed in Tables 5 and 6.
The spectra of different components of the sources are presented in Figures 4. The clearly visible steepening in the spectra of both the integrated source and the outer doubles at the higher-frequency end is interpreted as due to radiative losses which we discuss in Section 4.


3.2 The radio cores
The core positions are RA: 01 16 2500, DEC: 47 22′ 4150 and RA: 11 58 1998, DEC: 26 21′ 1409 for J01164722 and J1158+2621 respectively. Our measurements of radio core positions match within 2 arcsec with those given by Jones & McAdam (1992) and Healey et al. (2007) for J01164722 and J1158+2621 respectively. The core flux densities of our sources are presented in Table 7 for both the sources. The values of the core flux have been estimated from two-dimensional Gaussian fits by AIPS task JMFIT. The core flux densities are all peak values in order to reduce any possible contamination from diffuse emission. Errors are calculated by quadratically adding the flux measurement errors and the JMFIT errors . The fiducial values of flux measurement errors are assumed to be 5 per cent for VLA data and 7 per cent for GMRT data.
Given that the core variability of DDRGs has been reported in the literature by Konar et al. (2006), Jamrozy et al. (2007) and Konar et al. (2012), it is worth inspecting the core variability for these DDRGs also. The core variability of J1158+2621 is prominently seen at C, X and K band (bottom panel of Figure 5). At X and K band, the core flux densities vary up to a factor of . For the source J0116-4722, the L band data from ATNF and GMRT (shown in filled circle in the top panel of Figure 5) clearly shows the variability of the core over a 10 yr time scale. The 334 and 610-MHz core flux densities of J01164722 are poor resolution measurements; hence, these are contaminated by diffuse flux, and we cannot judge the strength of the variability at these frequencies from our present observations. Konar et al. (2006) and Jamrozy et al. (2007) also have shown that the restarting radio galaxies J1453+3308 and 4C 29.30 have prominent core variability. In case of J1453+3308, the core at X band varies up to a factor of 2 and the core of 4C 29.30 at C band varies up to a factor of 8. Liuzzo et al. (2009) detected a 15 yr old VLBI/milliarcsec scale knot near the core of 4C 29.30 and suggested that the large amplitude radio-core variability between 1990 and 2005, as reported by Jamrozy et al. (2007), is associated with the ejection of this knot from the central engine. This suggests that jet power can vary by ejection of such blobs from the central engine, leading to core variability in arcsec scale measurements. In a recent study by Konar et al. (2012), no appreciable variability has been observed in the DDRG J1835+6204 over 2 yr time scale. So, many, but not all, of the DDRGs that we have studied (see Table 8) have variable cores. We have defined a fractional change of a quantity as a ratio of core flux densities between two epochs. The ratio has been taken such that the ratio is always . If multiple epochs of observations exists, then the frequency band and the two epochs have been chosen such that is maximum (see Table 8). In our definition, corresponds to non variable core for any source. We have also defined time scale of variability () as the shortest time over which the variability has been detected with the available observations of the variable core (In principle could have been smaller than what we have estimated here, had there been observations at even smaller time intervals.) and the time scale of non-variability () as the longest time span over which multiple observations have been done and no variability has been detected for non-variable cores (to be borne in mind that the non-variable cores may be variable on much longer timescales). We have tabulated , , in Table 8.
Is this degree of variability telling us something about the nature of the DDRG phenomenon? We begin by noting that our target sources are not radio loud quasars, but radio galaxies. According to the unification scheme (and assuming that they are narrow-line radio galaxies) we are likely to observe them at relatively large () angles to the line of sight. Therefore the intrinsic timescale of variability of the cores should not be greatly shortened in our observations by the effects of relativistic beaming. Systematic studies of core variability in radio galaxies are relatively rare. A high-resolution radio study of 17 3CRR radio galaxies by Hardcastle et al. (1997) found only two objects (3C 79 and 4C 14.11) to have cores which varied detectably in radio flux at 8.4 GHz over 23 yrs, and of these one is a broad-line radio galaxy (low-luminosity quasar) and the other a low-excitation radio galaxy that could be viewed at any angle to the line of sight. Similarly, Gilbert et al. (2004) and Mullin, Hardcastle & Riley (2006) report, respectively, at most 4/27 and 3/32 of their higher- 3CRR sources, some of which are quasars or broad-line objects, to have significantly variable cores on timescales of years, although as the main focus of these papers was the correction of variability to allow imaging from multi-epoch data they may have missed lower-level variability. Turning to objects perhaps more similar to our DDRGs, in the radio study of giant radio galaxies by Konar et al. (2006, 2008), only one giant radio galaxy (J0819+756) has been detected with a variable core, and Ishwara-Chandra & Saikia (1999) also reported that the core of the giant radio galaxies, namely NGC 315 and NGC 6251, did not show variability on timescales of about 12 and 2 yr respectively. Thus the detection of variability in 4/7 of the DDRG in Table 8 is qualitatively noteworthy, and indeed statistically significant on a binomial test at around the level if we take the rate of variability seen in the 3CRR objects (at most per cent) as the null hypothesis level. We tentatively suggest that the variability is related to relatively large changes in the jet power (and therefore presumably the accretion rate) at the base of the jets, which might be connected to the larger-amplitude variability on longer timescales that drives the episodic nature of our sources. If this is connected to accretion rate, increased variability for DDRG should be seen in other wavebands, e.g. the X-ray. Further investigations of larger samples are required to investigate this issue in more detail.
While interpreting the core variability from our data, we should bear in mind that the samples from Hardcastle et al. (1997), Gilbert et al. (2004) and Mullin et al. (2006) were all at 8 GHz and were observed typically 4 times over 2-3 years. Our DDRGs have more total observations over a wider frequency range and in some cases a longer time baseline. Whether this makes the higher fraction of DDRGs to be observed with variable core is not clear.
| Source | Telescope | Project | Date of obs. | Freq. | Resolution | Flux | Error |
|---|---|---|---|---|---|---|---|
| code | " ", deg | density | |||||
| MHz | mJy | mJy | |||||
| (1) | (2) | (3) | (4) | (5) | (6) | (7) | (8) |
| J01164722 | GMRT | 17074 | 26-NOV-2009 | 1287.9 | 08.004.3, 6.4 | 7.2 | 0.5 |
| GMRT | 13JMa01 | 06-MAR-2008 | 618.8 | 09.604.0, 356 | 10.8 | 0.8 | |
| GMRT | 13JMa01 | 13-MAR-2008 | 333.8 | 17.207.8, 2.8 | 18.5 | 2.8 | |
| ATNF | SSU2002† | Jan-Apr-1999 | 1376.0 | 10.209.1, 11 | 11.0 | 0.6 | |
| ATNF | SSU2002† | Jan-Apr-1999 | 2496.0 | 04.404.1, 15 | 11.7 | 0.6 | |
| J1158+2621 | GMRT | 10CKa01 | 22-JUN-2006 | 1287.5 | 01.401.4, 45 | 3.3 | 0.2 |
| VLA | AS943 | 19-JUN-2008 | 4860.1 | 18.002.6, 279 | 3.8 | 0.2 | |
| VLA | AM954 | 27-JUN-2008 | 4860.1 | 11.705.2, 302 | 3.8 | 0.2 | |
| VLA | AL663 | 24-OCT-2005 | 4860.1 | 15.104.1, 291 | 3.5 | 0.2 | |
| VLA | AB568 | 03-MAY-1990 | 8439.9 | 00.300.2, 41 | 5.0 | 0.2 | |
| VLA | AL663 | 24-OCT-2005 | 8460.1 | 09.608.4, 17 | 4.5 | 0.4 | |
| VLA | AM593 | 05-APR-1998 | 8460.1 | 00.700.7, 45 | 2.8 | 0.2 | |
| VLA | AS943 | 19-JUN-2008 | 8460.1 | 08.602.8, 281 | 4.6 | 0.2 | |
| VLA | AL663 | 24-OCT-2005 | 22460.1 | 04.002.8, 319 | 7.1 | 0.4 | |
| VLA | AS943 | 06-SEP-2008 | 22460.1 | 03.002.9, 345 | 4.2 | 0.2 | |
| VLA | AL663 | 30-OCT-2005 | 43339.9 | 01.901.3, 300 | 7.0 | 0.4 |
†: These are the observations made by Saripalli, Subrahmanyan & Udaya-Shankara (2002).
| Source (Alt. name) | Detection | Variability | () | (band, time) | Reference |
|---|---|---|---|---|---|
| (Yes/No) | (Yes/No) | (yr) | |||
| (1) | (2) | (3) | (4) | (5) | (6) |
| J0041+3224 (B2 0039+32) | No | 1 | |||
| J01164722 (PKS 0114-47) | Yes | Yes | 10 (L) | (L,10) | p |
| J0840+2949 (4C 29.30) | Yes | Yes | 0.5 (L) | (C,20) | 2 |
| J1158+2621 (4C +26.35) | Yes | Yes | 3 (X) | (K,3) | p |
| J1453+3308 (4C +33.33) | Yes | Yes | 0.5 (X) | (X,0.5) | 3 |
| J1548-3216 (PKS 1545-321) | Yes | No | 6 (C) | (C,6) | 4 |
| J1835+6204 (B 1834+620) | Yes | No† | 2 (X) | (X,2) | 1 |
†: The core of this source can be called mildly variable provided there is no systematic error in the data. In our previous paper Konar et al. (2012), this core has been stated to be non variable.
Reference: 1: Konar et al. (2012). p: this paper. 2: Jamrozy et al. (2008). 3: Konar et al. (2006). 4: Machalski et al. (2010).


4 Spectral ageing analysis
According to the standard dynamical model of FR II radio galaxies, the relativistic plasma, after being accelerated at the hotspots flows backwards towards the core. As we know, the leptons (e-/) in the lobes of radio galaxies radiate by the synchrotron process and by inverse-Compton scattering against the CMB photons. Therefore, those particles lose energy; this phenomenon is called radiative ageing or spectral ageing. The spectral age is defined as the time elapsed since the radiating particles were last accelerated. In order to determine the spectral age in different parts of the lobes, we apply the Jaffe-Perola model (hereafter JP model, see Jaffe & Perola 1973) which describes the time-evolution of the emission spectrum from particles with an initial power-law energy distribution characterised by injection spectral index (). In applying this model, our assumptions are that (i) the radiating particles after entering the lobes are not re-accelerated, but radiate via the synchrotron process and inverse-Compton scattering against the CMB photons, (ii) the blob of plasma in each strip (limited by our common resolution) is injected in a small time interval compared to the age of the radio galaxy, so that the entire plasma of a strip can be assumed to have been injected in a single shot, (iii) there is no mixing of back-flowing plasma between two adjacent strips of lobes, (iv) the magnetic field lines are completely tangled and the field strength at each part of the lobe is at equipartition value, which remains constant in time, (v) the particles injected into the lobe have a constant power-law energy spectrum with an index (, where is the power law index of the synchrotron spectrum) over the entire active phase of the source and (vi) the particles get isotropized in pitch angle with the time-scale of isotropization much smaller than the radiative lifetime. From our assumption (v), the initial spectrum of any blob of lobe plasma (any strip, in our case) has a power law spectrum. After sufficient amount of time is elapsed, the synchrotron spectra develop a curvature at higher frequency part. This curvature is characterised by a spectral break frequency. The spectral break frequency () above which the radio spectrum steepens from the injected power law, is related to the spectral age and the magnetic field strength through
| (2) |
where is the magnetic field strength equivalent to the CMB energy density; and are expressed in units of nT, while is in GHz.
We have carried out a detailed spectral ageing analysis of J1158+2621 using our multifrequency radio data. Due to the lack of good quality data we could not perform such a detailed spectral ageing analysis for J01164722; however, for this source, we have made a crude estimate of the spectral age. The results are discussed in the following two subsections.
4.1 Spectral age of J11582621
We have followed exactly the same procedure as described in Konar et al. (2012) to constrain and , and estimate the magnetic field. We first fitted the JP model to the integrated flux densities of the lobes, obtaining a best-fitting value of for the entire outer double fitted to the data from Table 6. We then convolved the total-intensity maps made by us at multiple frequencies to a common angular resolution of 14.5614.56 arcsec, before splitting into a number of strips separated approximately by the common resolution element (with which all the maps were convolved) along the axis of the source, and the spectrum of each strip has been determined. The best fit spectra of some of the strips of the outer lobes are shown in Figure 6. We have used the maps at 332, 617, 1287, 4860 and 8460 MHz to constrain the spectra of the strips with the fixed value of . Then using ‘SYNAGE’ (a spectral-ageing model fitting package, Murgia 1996), we have constrained , hence the spectral age from the Equation 2. While interpreting the spectral ageing results, we are fully aware of the caveats related to the spectral ageing analysis which are outlined in Konar et al. (2012) in detail.
The value of and spectral age of each strip of J1158+2621 are listed in Table 10. These spectral ages of different strips as a function of distance from the hotspots are plotted in Figure 7. As expected, the synchrotron age for both the outer lobes increases with distance from the edges (warm spots) of the lobes. We have fitted a polynomial to every age-distance plot to extrapolate the curve to the position of the core. The value of the polynomial at the position of the core gives the expected spectral age of the outer lobes. Since in this DDRG, there is diffuse relativistic plasma of the outer lobes all the way back to the core, it makes sense to determine the spectral age by this extrapolation method. We could not constrain the spectral age of the plasma near the core region of the outer lobes due to (i) the presence of the inner lobes and (ii) low signal to noise ratio at low frequencies and non detection of diffuse plasma at higher frequency images due to limited sensitivity. The spectral ages of the strips of the two lobes of J1158+2621 are given in Table 10. The extrapolated spectral ages, which we will consider hereafter as true spectral ages, of the outer lobes of J1158+2621 are 135 and 92 Myr for NW1 and SE1 lobes respectively. For the inner double of this source, the spectrum has no curvature up to 22.46 GHz. Since the radio spectrum of the inner double is practically straight (see Figure 4), we cannot determine the synchrotron break frequency and the spectral age for the inner double. However, we have determined the upper limit of spectral age of the inner double with the assumption that the break frequencies are greater than the highest observed frequency which is 22.46 GHz in this case. Our estimation of minimum energy field yields nT. So, the spectral age of inner double of J1158+2621 is given by Myr. We also have determined the lower limit of age by assuming that the jet-head will advance with no faster speed than (Konar et al. 2006; Schoenmakers et al. 2000a; Safouris et al. 2008). Therefore, the limits of the age of the inner double of J1158+2621 can be written as Myr.
4.2 Spectral age of J01164722
Complete spectral ageing analysis was not possible for this source due to the lack of good data. We have images at only 3 frequencies, out of which, we have found that the GMRT L-band image has loss of diffuse flux (Section 2.3) so that we were unable to use the L-band data. We were thus left with images only at two frequencies, which is insufficient for a detailed spectral ageing analysis of the lobes. However, we could still constrain the spectra of the total outer double and the total inner double with the data from the literature supplemented by our new observations. We could also estimate both upper and lower limits of the ages of both inner and outer doubles. The observed spectra of the outer double fitted with spectral ageing model are presented in Figure 4. The best fit value of of the outer lobes, which have been constrained from the total spectrum of the outer double, is 0.618. The as obtained from the spectral ageing fit to the observed spectrum of total outer double is 2.42 GHz. This break frequency will give an estimation of spectral age of the outer double, which will definitely be an underestimation of the source age due to the fact that the injection of fresh plasma had been accumulated in the outer lobes for a long time; and thereby the age corresponding to 2.42 GHz will serve as a lower limit of the age of the outer double of J01164722. We have used the averaged magnetic field determined from the spectrum of the entire outer double, which is 0.270.03 nT. So, the spectral age corresponding to GHz is 64 Myr. Therefore, the lower limit of the age of the outer double can be given by Myr Myr, as Myr (here is the time taken by the last ejected jet material to travel from the central engine to the hotspot). However, this is not a very good constraint on the age of the outer double. To get a reasonable age of the outer double we have assumed a nominal average speed of the hotspots to be 0.01c. So, Myr. So, the age of the outer double is given by Myr. The warm-spots have relatively fresher plasma than the rest of the parts of the lobes, so the age estimated from the spectrum of the total outer double can be treated as an upper limit of the ages of the warm-spots of the outer lobes. Thus we get Myr. For the inner double of this DDRG, we have reliable flux densities only at two frequencies (Saripalli et al., 2002). The images at those frequencies were mapped with same uv cutoff and similar uv coverage. In GMRT low frequency images, inner doubles are quite contaminated with the diffuse emission because of more diffuse emission and low resolution at frequencies. Moreover, the GMRT data have skewed uv-coverage and the data are RFI affected. The inner northern lobe has not been detected in our GMRT L band image because of the bad data. There is no high resolution image or flux values for the inner double in the literature at frequencies higher than 2496 MHz. Therefore, we have constrained the power law spectrum of the inner double of J01164722 with only two data points. Given the results related to the inner doubles of other DDRGs published in our previous work (Konar et al., 2006; Jamrozy et al., 2007; and Konar et al., 2012), we can assume that the spectrum of the inner double of J01164722 is a power law from very low frequency to at least 8.4 GHz, as we have never observed break frequency below 8.4 GHz for any inner double (see Konar et al. 2012 for J0041+3224 and J1835+6204, and this paper for J1158+2621). So, we can assume that the break frequency of the inner double of J01164722 is GHz. Our estimated magnetic field for the inner double is 0.480.05 nT which yield an upper limit of the spectral age of the inner double of J01164722 to be 28 Myr corresponding to a lower limit of of 8.46 GHz. As in the case of J1158+2621, we assumed the upper limit of the hotspot speed of J01164722 to be , that gives us the kinematic age of 0.91 Myr which is the lower limit of the age of the inner double of J01164722. Therefore, the age of the inner double of J01164722 can be given by Myr, which is not a very good constraint; nevertheless, we can use this to constrain the duration of the active phase of the previous episode and the quiescent phase (see Section 5).
5 Discussion
The outer lobes of both the DDRGs do not have any compact hotspots, but the inner lobes do have compact hotspots at the outer ends of the lobes. From the widely accepted dynamical models of FR II radio galaxies, the lack of hotspots in outer lobes suggests that the lobes are no longer fed by the jets. Therefore, these lobes are the relics of the previous episode of JFA. Since the inner lobes do have compact hotspots, they are still fed by the newly formed jets in the current episode of JFA. The different values of the spectral ages (135 and 92 Myr for NW and SE lobes respectively) of two outer lobes of J1158+2621 are most probably due to the different energy loss/gain processes other than synchrotron and inverse-Compton losses (e.g., adiabatic expansion loss and particle re-acceleration), that are/were at work in the outer lobes. This essentially suggests the asymmetry on two different sides of a source. Similarly asymmetric ages in other DDRGs have been reported by Konar et al. (2012). Assuming that both the jets started and stopped simultaneously, the meaningful spectral age of a RG should therefore be an average of the spectral ages of two lobes. The average spectral age of J1158+2621 is 113 Myr, which we consider to be the age of the outer double of J1158+2621. In the age-distance plot of J1158+2621, we observe a curvature when smooth curves were drawn through the points. This curvature in the age distance plot can be produced by the increasing adiabatic loss with the age of any strip of the lobe plasma. In such a scenario, the closer the strip to the core, the older it is, hence the more adiabatic loss due to expansion it might have suffered. Alternatively, if the hotspot advance speed was accelerating (because of the decreasing ambient medium density) then such a curvature is possible. The concave curvature may also indicate that the back-flow speed of the cocoon plasma is slowing down as the plasma approaches the core. In practice, all these factors are likely to play a role to various extents in producing curvature such as we observe.
We have also tried to make an estimation of the timescale for the quiescent phase of the jet activity in both the DDRGs. The hotspots created during the active phase of the two outer lobes have now faded and lost their compactness, so that they can now appropriately be called warm spots. These warm spots are the regions of lobes where the jet material was most recently injected, hence these regions contain plasma which is younger than that in other parts of the lobes. So, we expect to find the lowest spectral age in these portions of the outer lobes, as indeed is observed. The quiescent phase is then the time interval between the last jet material being injected into the outer lobes in the previous episode and the first jet material injected in the inner lobes of the current episode. The first jet material injected into the inner lobes is what is now at the tails (near the core) of the inner lobes. Since there is not enough resolution in our data, for the inner double, we have determined the total spectrum (instead of the spectrum of the tail portions of two inner lobes). Since the spectra of the inner doubles are straight, we have been able to constrain two limits on their spectral ages. In this work, we have been able to estimate the following temporal parameters which are listed with the definitions.
-
1.
: the age of the inner double, i.e., the time taken by the inner jet-head to traverse the distance between the core and the present position of the jet head.
-
2.
: the age of the outer double, i.e., the time taken by the outer jet-head to traverse the distance between the core and the present position of the jet head.
-
3.
: the age of the warm spot, i.e., the time elapsed between the moment when the last jet material was dumped at the outer warm spot and the moment of observations.
-
4.
: the time taken by a given blob of jet material to travel from the core to the outer hotspot. Since we have assumed that the speed of the jet material is close to the speed of light (), it is essentially the light travel time between the core and the outer warm spot.
-
5.
: the duration of the active phase of the previous episode, i.e., the duration over which the central engine was supplying the relativistic jet fluid in the previous episode.
-
6.
: the duration of the quiescent phase between the two episodes, i.e., the time between the stopping of the jet fluid suppy in the previous episode and the restarting of the new jet.
All the above quantities are averaged over two jets. The quantities and can be given by the relations
| (3) |
and
| (4) |
The ages of the two warm spots of the outer lobes of J1158+2621 are not very different (see Table 10) and their average is 10.7 Myr, which we assume to be the ages of both the warm-spots. The limits of the spectral ages of inner double of J1158+2621 are given by Myr and Myr. Assuming that the jet material moves at a speed close to that of light, we estimate Myr (the total size of the outer double is 483 kpc) for J1158+2621. So, from Equation 3, we get Myr. Now, keeping in mind that we have limits for the , we get (from Equation 4) the limits of the of J1158+2621, which is given by Myr. From this study we conclude that the quiescent phase of the AGN-jet activity of J1158+2621 is between 6.5 per cent and 10.8 per cent of the duration of active phase of the previous episode of JFA. The case of J01164722 is different, as we do not know definite values for the ages of either the inner double or outer double, nor do we know definite values of the ages of the outer warm spots. We have limits for ages of all components of J01164722. However, we know Myr (total size of the outer double 1447 kpc) for this source. From Section 4.2, we already know Myr and Myr and Myr. So, Myr, and the duration of quiescent phase of J01164722 can be given by Myr. From our present data, we cannot get better constraints on and .
| Source | Alt. name | z | Size | Ref | |||||||
| J2000 name | (kpc) | (Myr) | (Myr) | (Myr) | (Myr) | (Myr) | (Myr) | ||||
| (1) | (2) | (3) | (4) | (5) | (6) | (7) | (8) | (9) | (10) | (11) | (12) |
| J0041+3224 | B2 0039+32 | 0.45 | 969 | 26 | 0.345.30 | 1.58 | 4.44 | 20 | 0.75.7 | 3.528.5 | 1 |
| J0116-4722 | PKS 0114-47 | 0.146101 | 1447 | 66236 | 1.0028.00 | 2.40 | 1.465.4 | p | |||
| J0840+2949 | 4C 29.30 | 0.064715 | 639 | 0.1233.00 | 2.08 | 2.0102.0 | 2 | ||||
| J1158+2621 | 4C +26.35 | 0.112075 | 483 | 113 | 0.504.90 | 0.79 | 10.70 | 101.5 | 6.611.0 | 6.510.8 | p |
| J1453+3308 | 4C +33.33 | 0.248174 | 1297 | 60 | 0.529.26 | 2.12 | 19.50 | 38.4 | 12.421.1 | 32.355.0 | 3 |
| J1548-3216 | PKS 1545-321 | 0.1082 | 961 | 74 | 0.5734.67 | 1.57 | 29.20 | 43.1 | 0.05†29.2 | 0.0167.7 | 4 |
| J1835+6204 | B 1834+620 | 0.5194 | 1379 | 22 | 1.342.25 | 2.25 | 1.00 | 17.5 (1421)* | 1.06.6 | 5.737.7 | 1 |
| J1211+7419 | 4CT 74.17.01 | 0.1070 | 845 | 0.010.83ξ | 5 |
†: If the lower limit of the duration of quiescent phase is less than the jet quenching time yr, then we have replaced the lower limit by yr; because the new jet has to start at least after the jet quenching time to be observationally classified as a new episode.
: There are limits of the active phase which are different by much less than an order of magnitude. So, we have taken the average of those limits as the duration of active phase.
ξ: This is not determined by spectral ageing method but by assuming the fiducial values of the parameters and using the light travel time arguement. See Marecki (2012) for detail. So, the value of determined by other method is well within the range of what we have obtained for our sample. References are as follows: 1: Konar et al. 2012, p: this paper, 2: Jamrozy et al. 2007, 3: Konar et al. 2006, 4: Machalski et al. 2010, 5: Marecki 2012.
5.1 Active phase and quiescent phase
We have tabulated various quantities for well-studied DDRGs in Table 9. From the best studied sources from our previous work as well as from the present paper, it seems that the duration of quiescent phase is always smaller than the duration of the active phase (see Table 9). Moreover, the duration of quiescent phase is never much more than 50 per cent of that of active phase of those sources for which we have good estimation (or limits) of the duration of active and quiescent phases. Because of the pure power-law spectra of the inner doubles within our observed frequency range, we could place only limits to the ages of the inner doubles. Therefore, we have been able to place only limits on the duration of the quiescent phase. Further work related to modelling of the inner double dynamics is required to constrain reliable ages (rather than limits on ages) which would improve the estimates of these ages. However, it is already clear that the quiescent phase can be short with respect to the active phase. While there is a clear selection effect operating in this sample (we do not observe sources with very long quiescent phases as DDRG, because their outer lobes fade to the point where they are not detectable) this observation nevertheless puts constraints on models of the duty cycle and on the nature of JFA in radio galaxies.
| Strip | Dist. | ||||
|---|---|---|---|---|---|
| kpc | GHz | nT | Myr | ||
| NW1-lobe | |||||
| NW1-01 | 237.8 | 0.89 | 0.500.05 | ||
| NW1-02 | 209.6 | 2.53 | 0.530.05 | ||
| NW1-03 | 177.3 | 2.32 | 0.510.05 | ||
| NW1-04 | 145.1 | 12.52 | 0.490.05 | ||
| NW1-05 | 120.9 | 20.16 | 0.460.05 | ||
| SE1-lobe | |||||
| SE1-01 | 229.7 | 6.16 | 0.510.05 | ||
| SE1-02 | 197.5 | 0.39 | 0.490.05 | ||
| SE1-03 | 165.2 | 1.15 | 0.490.05 | ||
| SE1-04 | 133.0 | 3.19 | 0.490.05 | ||
| SE1-05 | 108.8 | 4.10 | 0.490.05 |

6 Summary and concluding remarks
The main results of this paper can be summarized as follows.
-
1.
The average spectral age of the outer lobes of J1158+2621 is 113 Myr. The limits of the spectral ages of the inner double of J1158+2621 are given by Myr. The estimated duration of the quiescent phase of J1158+2621 is given by Myr. The duration of active phase 101.5 Myr. From this study we can see that the quiescent phase of an AGN-jet activity of J1158+2621 lies between per cent and per cent of the active phase of the first episode of JFA. For J01164722 we have not been able to do a detailed spectral ageing analysis. However, we have the limits Myr, Myr, Myr and Myr. A statistical study with a large sample is required for such sources to know the range of the quiescent phase of JFA.
-
2.
When we compare the results of this work and our previous work, we found that for a small sample of 7 ERGs the duration of quiescent phase can be as small as the hotspot fading time of the previous episode, and as high as a few tens of Myr (i.e., yr). More interestingly, for none of the sources of our sample, it is close to the duration of active phase of previous episode. This may be a selection bias, but even so, it shows that the duration of the quiescent phase can be comparatively short, putting constraints on the mechanism by which the jet/accretion power is modulated.
-
3.
We also found that for many episodic radio galaxies, the nucleus is variable in the radio wavelength. For our small sample of 7 episodic radio galaxies, 4 have been detected with variable core, which is a significantly larger fraction than is seen in normal FRII radio galaxies. The variability in the core of ERGs may be due to instabilities in the accretion rate which may be connected to the episodic nature of these objects. A statistical study with a bigger sample will be important to test the generality of these conclusions.
Acknowledgments
We thank the reviewer Geoffrey Bicknell, assistant editor Keith T. Smith, and the anonymous scientific editor for their useful comments and suggestions. We thank the staff of the Giant Metrewave Radio Telescope that made these observations possible. The Giant Meterwave Radio Telescope is a national facility operated by the National Centre for Radio Astrophysics of the Tata Institute of Fundamental Research. The National Radio Astronomy Observatory is a facility of the National Science Foundation operated under co-operative agreement by Associated Universities Inc. This research has made use of the NASA/IPAC extragalactic database which is operated by the Jet Propulsion Laboratory, Caltech, under contract with the National Aeronautics and Space Administration. CK and MJ acknowledge the access to the SYNAGE software provided by M. Murgia. CK acknowledges the grant (No. NSC99-2112-M-001-012-MY3) from the National Science Council, Taiwan. MJ acknowledges the Polish MNiSW funds for scientific research in years 2009-2012 under the contract no. 3812/B/H03/2009/36.
References
- [] Baars J.W.M., Genzel R., Pauliny-Toth I.I.K., Witzel A., 1977, A&A, 61, 99
- [] Becker R.H., White R.L., Edwards A.l., 1991, ApJS, 75, 1
- [] Belsole E., Worrall D.M., Hardcastle M.J., Croston J.H., 2007, MNRAS, 381, 1109
- [] Blundell K.M., Rawlings S., 2000, AJ, 119, 1111
- [] Bock D., Large M.I., Sadler E.M., 1999, AJ, 117, 1578
- [] Bolton J.G., Gardner F.F., Mackey M.B., 1964, AuJPh, 17, 340
- [] Brocksopp, C., Kaiser, C.R., Schoenmakers, A.P., de Bruyn, A.G., 2007, MNRAS, 382, 1019
- [] Brocksopp, C., Kaiser, C.R., Schoenmakers, A.P., de Bruyn, A.G., 2011, MNRAS, 410, 484
- [] Burns J. O., Feigelson E. D., Schreier E. J., 1983, ApJ, 273, 128
- [] Burns J. O., Schwendeman E., White R. A., 1983, ApJ, 271, 575
- [] Clarke D.A., Burns J.O., 1991, ApJ, 369, 308
- [] Clarke D. A., Burns J. O., Norman M. L., 1992, ApJ, 395, 444
- [] Condon J.J., Broderick J.J., 1985, AJ, 90, 2540
- [] Conway R.G., Kellermann K.I., Long R.J., 1963, MNRAS, 125, 261
- [] Danziger I.J., Goss W.M., 1983, MNRAS, 202, 703
- [] Ekers J.A., 1969, AuJPA, 7, 3
- [] Fanaroff, B.L., Railey, J.M., 1974, MNRAS, 167, 31
- [] Gilbert G.M., Riley J.M., Hardcastle M.J., Croston J.H., Pooley G.G., Alexander P., 2004, MNRAS, 351, 845
- [] Gizani N. A. B., Leahy J. P., 2003, MNRAS, 342, 399
- [] Hardcastle M. J., Alexander P., Pooley G.G., Riley J.M., 1997, MNRAS, 288, 859
- [] Healey S.E., Romani R.W., Taylor G.B., Sadler E.M., Ricci R., Murphy T. Ulvestad J.S., Winn J.N., 2007, ApJS, 171, 61
- [] Hota A., Sirothia S.K., Ohyama Y., Konar C., Kim S., Rey S.-C., Saikia D.J., Croston J.H., Matsushita S., 2011, MNRAS, 417, L36
- [] Ishwara-Chandra C.H., Saikia D.J., 1999, MNRAS, 309, 100
- [] Jaffe W.J., Perola G.C., 1973, A&A, 26, 423
- [] Jamrozy M., Konar C., Machalski J., Saikia D.J., 2008, MNRAS, 385, 1286
- [] Jamrozy M., Konar C., Saikia D.J., Stawarz Ł., Mack K.-H., Siemiginowska A., 2007, MNRAS, 378, 581
- [] Jones P.A., McAdam W.B., 1992, ApJS, 80, 137
- [] Kaiser C.R., Schoenmakers A.P., Röttgering, H.J.A., 2000, MNRAS, 315, 381
- [] Konar C., Hardcastle M.J., Jamrozy M., Croston J.H., Nandi S., 2012, MNRAS, 424, 1061
- [] Konar C., Jamrozy M., Saikia D.J., Machalski J., 2008, MNRAS, 383, 525
- [] Konar, C., Saikia, D.J., Jamrozy, M., Machalski, J., 2006, MNRAS, 372, 693
- [] Kühr H., Witzel A., Pauliny-Toth I.I.K., Nauber U., 1981, A&AS, 45, 367
- [] Langston G.I., Heflin M.B., Conner S.R., Lehár J., Carrilli C.L., Burke B., 1990, ApJS, 72, 621
- [] Liuzzo E., Giovannini G., Giroletti M., Taylor G.B., 2009, A&A, 505, 509
- [] Machalski J., Jamrozy M., Konar C., 2010, A&A, 510, 84
- [] Marecki A., 2012, A&A, 544, 2L
- [] Mullin L.M., Hardcastle M.J., Riley J.M., 2006, MNRAS, 372, 113
- [] Murgia M., 1996, Laurea Thesis, University of Bologna
- [] Roettiger K., Bums J.O., Clarke D.A., Christiansen W.A., 1994, ApJ, 421, 23L
- [] Roger R.S., Costain C.H., Stewart D.I., 1986, A&AS, 65, 485
- [] Safouris V., Subrahmanyan R., Bicknell G.V., Saripalli L., 2008, MNRAS, 385, 2117
- [] Saikia D.J., Konar C., Kulkarni V.K., 2006, MNRAS, 366, 1391
- [] Saikia D.J., Gupta N., Konar C., 2007, MNRAS, 375, L31
- [] Saripalli L., Subrahmanyan R., Udaya-Shankar N., 2002, ApJ, 565, 256
- [] Savage A., Wright A.E., Bolton J.G., 1977, AuJPA, 44, 1
- [] Schoenmakers A.P., de Bruyn A.G., Röttgering H.J.A., van der Laan H., 2000a, MNRAS, 315, 395
- [] Schoenmakers A.P., de Bruyn A.G., Röttgering H.J.A., van der Laan H., Kaiser C.R., 2000b, MNRAS, 315, 371
- [] Slee O.B., Higgins C.S., 1975, AuJPA, 36, 1 (Culgoora-2 catalogue)
- [] Slee O.B., 1977, AuJPA, 43, 1 (Culgoora-3 catalogue)
- [] Spergel D.N. et al., 2003, ApJS, 148, 175
- [] Udaya-Shankar N., Golap K., Sachdev S., Dodson R., Katwaroo M., Sastry C.V., 2002, Ap&SS, 282, 15
- [] Viner M.R., Ericson W.C., 1975, AJ, 80, 931
- [] Wall J.V., Wright A.E., Bolton J.G., 1976, AuJPA, 39, 1
- [] White R.L., Becker R.H., 1992, ApJS, 79, 331
- [] Willis B.J., 1975, AuJPA, 38, 1
- [] Wright A.E., Otrupcek R., 1990, PKS90 catalogue
- [] Wright A.E., Savage A, Bolton J.G., 1977, AuJPA, 41, 1
- [] Wright A.E., Wark R.M., Troup E., Otrupcek R., Jennings D., Hunt A., 1991, MNRAS, 251 330