Rejuvenated radio galaxies J0041+3224 and J1835+6204: how long can the quiescent phase of nuclear activity last?
Abstract
We present radio observations of two well-known double-double radio galaxies, J0041+3224 and J1835+6204, at frequencies ranging from 150 to 8460 MHz, using both the Giant Metrewave Radio Telescope and the Very Large Array. These observations, over a large radio frequency range, enable us to determine the spectra of the inner and outer lobes. Our detailed spectral ageing analysis of their inner and outer lobes demonstrates that the outer doubles of double-double radio galaxies are created by the previous cycle of activity, while the inner doubles are due to the present cycle of activity. The (core subtracted) spectra of the inner doubles of both sources are power laws over a large frequency range. We found that the duration of the quiescent phase of J0041+3224 is between 4 and 28 per cent of the active phase of the previous activity. The outer north-western lobe of J1835+6204 has a compact hotspot and the regions of both the outer hotspots have close to power-law (rather than curved) spectra, which indicates that the outer lobes are still fed by jet material ejected in the previous episode just before the central engine stopped powering the jet. We estimate that the duration of the quiescent phase of J1835+6204 is 5 per cent of the duration of the active phase of the previous activity. Therefore, we conclude that the duration of the quiescent phase can be as short as a few per cent of the active phase in radio galaxies of this type.
keywords:
galaxies: active – galaxies: nuclei – galaxies: individual: J0041+3224, J1835+6204 – radio continuum: galaxies1 Introduction
It is established beyond doubt that jet forming activity in radio galaxies is episodic in nature. This episodic jet-forming activity often gives rise to Double-Double Radio Galaxies (DDRGs), which are defined to be those having a pair of double radio sources with a common centre, and are thought to occur when a new epoch of jet activity is triggered in a radio galaxy with older lobes still visible from the activity of the previous epoch (Schoenmakers et al. 2000a). At present, about two dozen DDRGs are known in the literature (see Saikia & Jamrozy 2009 for a review). Although the DDRGs are more common, in fact more than two episodes of jet forming activity are physically plausible: Brocksopp et al. (2007) reported the first example of three such episodes in a radio galaxy, and recently Hota et al. (2011) reported a possible case of a triple-double radio galaxy dubbed ‘SPECA’ (J14090302).
The very existence of well-shaped and well confined radio galaxy lobes suggests that there must be some medium confining the lobes either through ram pressure or thermal pressure. Even radio galaxies whose optical environments are known to be comparatively poor are found to possess X-ray-emitting hot gas environments, corresponding to group or cluster-scale X-ray luminosities, whose gas properties can now be modelled in detail (see Hardcastle & Worrall, 1999; Hardcastle & Worrall, 2000; Worrall & Birkinshaw, 2000; Croston et al., 2003; Croston et al., 2004; Evans et al., 2005; Belsole et al., 2007; Croston et al., 2008; Konar et al., 2009) This environment emits via thermal bremsstrahlung in the X-ray band, and can be classified as a poor-cluster to group scale environment. The magnetised relativistic plasma (MRP) of the radio lobes does not mix well with the external thermal gas in the environment, as can be inferred from limits on internal depolarization of lobes at low frequencies, nor does it diffuse out completely into the IntraCluster Medium (ICM) even long after the jet stops feeding the lobes. Kaiser, Schoenmakers & Röttgering (2000) argued against the entrainment of material from the surrounding hot-gas environment through the lobe periphery. However, the observed well-confined inner lobes of DDRGs are not capable of existing in such a tenuous cocoon of matter deposited in the previous cycle of jet activity (the typical number density of relativistic radiating particles is cm-3). Therefore, Kaiser et al. (2000) proposed that the ambient thermal medium is a two phase medium. One phase consists of dense warm clouds and the other phase is the hot-gas medium, which has the characteristics of the general ICM, with a temperature of K and a central particle number density of cm-3. The dense, warm cloud phase has a temperature of K and a particle number density of 100 cm-3, with a very low filling factor of , dependent on distance from the Active Galactic Nucleus (AGN). The hot-gas medium has a filling factor . Kaiser et al. (2000) discussed in detail, in Section 2 of their paper, the observational evidence for these warm clouds through optical emission line detections. The warm clouds are dynamically unimportant, as their filling factor is extremely small. When the radio lobes expand very rapidly, these clouds are not efficiently accelerated by the lobe expansion, being heavier than the hot-gas phase, and so are overtaken by the contact discontinuity. This means that the warm clouds become dispersed inside the lobe and provide the required matter density to prevent the inner jets from being ballistic. In this model, to understand the dynamics of these sources it is necessary to know the pressure and matter density internal and external to the lobes.
The condition for a radio galaxy to restart is not well understood. Schoenmakers et al. (2000a) explored the possibility of causing restarting jets in DDRGs by interaction and merger events, although there is no observational evidence for this model. Numerical simulations of colliding galaxies show that these usually do not merge completely in the first encounter (Barnes & Hernquist, 1996). According to this scenario, the in-falling galaxy loses a large fraction of its gas and stars to the main galaxy, while parts of it pass through the main galaxy. These parts will turn around and collide again with the main galaxy. If the first encounter triggers the AGN, then the subsequent encounters destabilise it and jet interruption occurs. However, a problem with this scenario is that, as argued by Schoenmakers et al. (2000a), it would lead to the expectation of finding many more restarting radio galaxies than we see today. The mechanism for triggering multiple episodes of jet activity could also be closely related to the feedback mechanism proposed for solving the cooling flow problem in clusters of galaxies (see McNamara & Nulsen, 2007). Recently, the study of Jetha et al. (2008) showed that the restarting phenomenon in B2 0838+32A is consistent with feedback-driven accretion by the AGN. Therefore, studying DDRGs is very important to understand the conditions for the phenomenon of restarting jets, their relation to feedback mechanisms, and the dynamics of radio galaxies in general.
To understand the dynamics of radio galaxies we need to know the injection spectral index (which is related to the particle acceleration process), the spectral age (which is a good approximation to dynamical age), the jet power (which is connected to the accretion rate at the central engine), the magnetic field strength based on the equipartition assumption (which we know is reasonably accurate in FR II radio galaxies: Croston et al. 2005), and the internal pressure of the lobes (which helps us determine the composition of the relativistic particles, by comparing with the external pressure obtained from X-ray observations); all these parameters can be estimated from radio observations. Therefore, comprehensive radio studies of such sources are essential to pave the way towards a complete understanding of the dynamics of radio galaxies. Our further work related to the time-scale of quiescent phase of episodic radio galaxies, injection index in different episodes and particle acceleration at hotspots, and the dynamics of DDRGs through radio and X-ray observations will be published soon by Konar et al. (in prep); Konar & Hardcastle (in prep) and Konar et al. (in prep) respectively.
In this paper, we have carried out a multifrequency radio study of two DDRGs, namely J0041+3224 and J1835+6204. We present the Giant Meterwave Radio Telescope (GMRT) and Very Large Array (VLA) observations in Section 2, our observational results in Section 3, our spectral ageing analysis in Section 4, a discussion in Section 5 and concluding remarks in Section 6.
The cosmological parameters that we have used are km s-1 Mpc-1, and (Spergel et al. 2003). In this cosmology, 1 arcsec corresponds to 5.733 kpc for the source J0041+3224 situated at an (estimated, see below) luminosity distance Mpc. For J1835+6204, 1 arcsec corresponds to 6.207 kpc based on its luminosity distance of Mpc.
2 Observations and data reduction
The images published in this paper are from the GMRT and the VLA. All GMRT data are from our observations with project code 10CKa01. All VLA data are public data from the VLA archive. The details of the observations with both telescopes are given in Table 1.
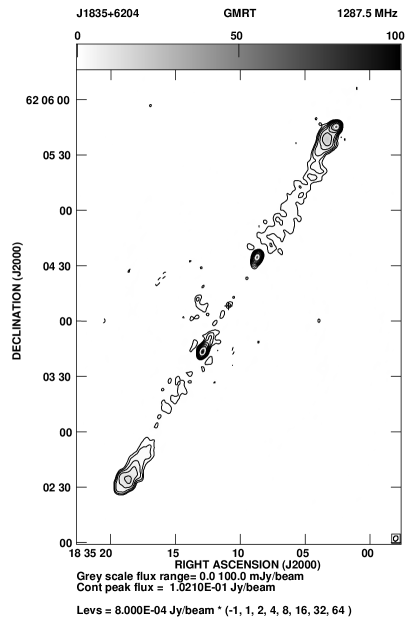
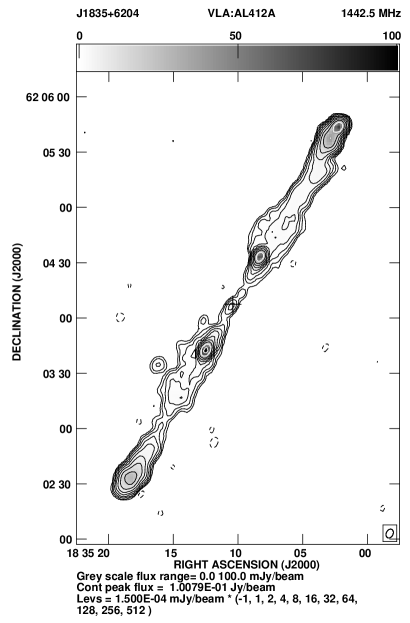
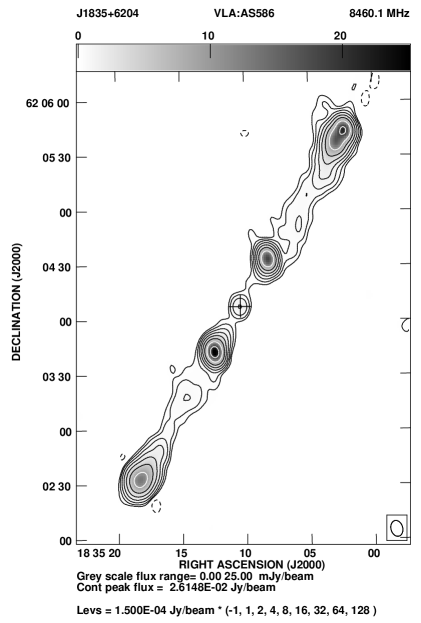
The shortest baseline for the C and D configuations of the VLA is 35 m. Our target sources, J0041+3224 and J1835+6204 have sizes arcmin and arcmin respectively; however, in both sources, at high frequencies, no single structure with dominant flux density is larger than 2 arcmin. As all the VLA maps (published by Saikia et al. 2006) used for flux density measurements of J0041+3224 were made from C-array data, where the largest angular size that can be mapped without loss of flux is 3 arcmin, our measurements for J0041+3224 should not be susceptible to loss of flux due to lack of short spacings in the uv-coverage. Alhough the 8.4 GHz map of J1835+6204 (Figure 2) looks continuous from hotspot to hotspot, this is (at least partially) due to the effects of comparatively poor resolution, which is why we do not see such continuity in the 4.8 GHz images at somewhat higher resolution. The 8.4-GHz image of J1835+6204 is made by us from a combination of observations made separately with the B and D configurations, which again can image 3 arcmin regions without loss of flux. So this source is also not susceptible to any major loss of flux due to the lack of short spacings in the uv coverage. The shortest baseline of the GMRT is 100 m, and so we can safely map emission regions of a size of 7 arcmin at 1280 MHz without loss of flux; therefore, the GMRT can map even larger structure at any frequencies below 1280 MHz without losing any flux. We conclude that neither the VLA nor the GMRT images suffer from any significant loss of flux due to the lack of short spacings. In addition, we see no observational signatures of such flux losses, and so conclude that our flux measurements and spectral analysis is reliable.
2.1 GMRT observations
The observations were made in the standard manner, with each observation of the target source interspersed with observations of calibrators. For an observing run of any target source, one of 3C48, 3C147 or 3C286 was observed as a flux density and bandpass calibrator at a given frequency. At each frequency the source was observed in a full-synthesis run of approximately 9 hours including calibration overheads. On-source durations vary from 240371 min. Full details of the GMRT array can be found at http://www.gmrt.ncra.tifr.res.in. The data collected were calibrated and reduced in the standard way using the NRAO AIPS software package. Flux density calibration of our GMRT data uses the scale of Baars et al. (1977). All of the GMRT data below L band were affected by Radio Frequency Interference (RFI) to various extents, and were extensively flagged by hand within AIPS to reduce the effects of RFI as much as possible.
2.2 VLA observations
The VLA data for the sources at various frequencies (1.4, 4.8, 8.4 GHz) were analysed to produce images. The data from our own observations and those from the archive are indicated in the observation log table (Table 1). All VLA observations were in snap-shot mode. The on-source observing time was between 7 to 251 min (see Table 1). One of the calibrators 3C48, 3C147 or 3C286 was observed as a flux density calibrator at each frequency of a given observing run. As in the case of the GMRT data, the VLA data were edited and reduced using the AIPS package. The use of VLA archival data to supplement our GMRT observations was essential to constrain the spectra of the DDRGs and to allow us to carry out the spectral ageing analysis. All flux densities are on the Baars et al. (1977) scale.
3 Observational results
3.1 Observed parameters and structures
The images of the entire source using the GMRT and the VLA are presented in Figures 1 and 2, while the observational parameters and some of the observed properties are presented in Table 2 and 3. The flux densities of different components were estimated by specifying an area around each component. All the flux density measurements have been done with the AIPS task ‘TVSTAT’ which requires selection of a shaded polygonal area in the region of interest. ‘TVSTAT’ adds up all the pixel values within the shaded area to give the total flux density of the shaded area. We measured the flux density of each component using several different areas around the radio emitting component, which gives an idea of the systematic errors due to our choice of region. The change in flux density of each component, when measured this way, is only a few per cent. Flux density values that have been measured directly by us from the FITS maps with the AIPS task ‘TVSTAT’ are assumed to have the following error values: 5 per cent for 1400, 4860 and 8460 MHz VLA measurements; 7 per cent for 1287 and 610 MHz GMRT measurements; and 15 per cent for 332, 240 and 153 MHz GMRT measurements. Other flux density values quoted in the paper have been assigned errors determined by propagating errors from the errors of directly measured flux densities.

| Source | Teles- | Array | Obs. | Bandwidth | On-source | Obs. Date | Project |
| cope | Conf. | Freq. | used for | observing | code | ||
| mapping | time | ||||||
| (MHz) | (MHz) | (min) | |||||
| (1) | (2) | (3) | (4) | (5) | (6) | (7) | (8) |
| J0041+3224 | GMRT | 153.28 | 5.00 | 360 | 11-AUG-2006 | 10CKa01 | |
| GMRT | 240.25 | 5.00 | 307 | 17-JUL-2006 | 10CKa01 | ||
| GMRT | 331.88 | 12.50 | 270 | 15-JUN-2006 | 10CKa01 | ||
| J1835+6204 | GMRT | 153.25 | 5.00 | 240 | 01-JUN-2006 | 10CKa01 | |
| GMRT | 240.25 | 5.00 | 280 | 14-MAY-2006 | 10CKa01 | ||
| GMRT | 332.50 | 12.50 | 371 | 16-JUN-2006 | 10CKa01 | ||
| GMRT | 605.81 | 12.50 | 280 | 14-MAY-2006 | 10CKa01 | ||
| GMRT | 1287.50 | 12.50 | 360 | 13-JUL-2006 | 10CKa01 | ||
| VLA | B | 1442.50 | 50.00 | 8.0 | 18-FEB-1997 | AL412A | |
| VLA | A | 1440.50 | 50.00 | 251 | 21-OCT-2000 | AS697 | |
| VLA | D | 4860.10 | 100.00 | 14 | 27-JUN-2008 | AM954 | |
| VLA | B | 4860.10 | 100.00 | 7.0 | 18-FEB-1997 | AL412A | |
| VLA | D | 8460.10 | 100.00 | 23 | 23-AUG-1996 | AS586 | |
| VLA | B | 8460.10 | 100.00 | 30 | 07-OCT-1998 | AL442 |
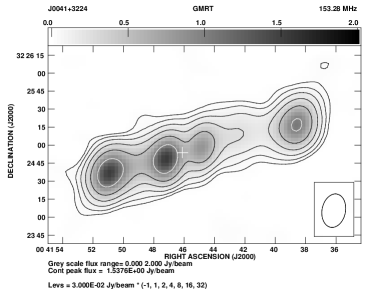
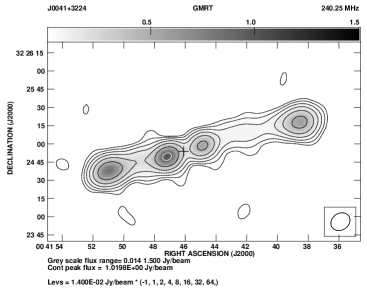
For both the sources the component designations are as follows. The outer north-western and south-eastern lobes are called NW1 and SE1, respectively. The inner north-western and south-eastern lobes are called NW2 and SE2, respectively. Since in low frequency images the inner doubles appear embedded in the diffuse plasma of the outer cocoons, we could not measure the flux densities of the inner and outer lobes separately on a particular side of the core. In these cases, we measured the total flux densities of the entire NW1 plus NW2 lobes and SE1 plus SE2 lobes, and designated those joint components as the NW1&2 and SE1&2 components respectively. All the inner lobes have edge-brightened structures called hotspots, and hence are of FRII type in morphology. The outer lobes of J0041+3224, as seen in high resolution images, do not have any compact hotspots, but neither do their structures resemble an FRI morphology. In the poor resolution images we see a peak of emission in the outer lobes at both ends of the source along the length. These are most probably the locations of the hotspots when the outer sources were active. These locations can be called warm-spots. Therefore, the outer structures are consistent with the idea that they are created in the previous episode of Jet Forming Activity (JFA).
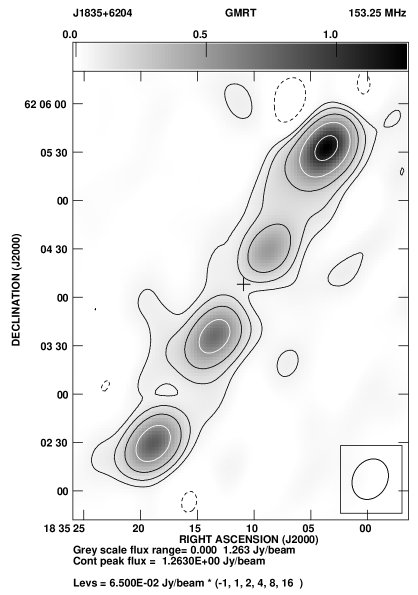
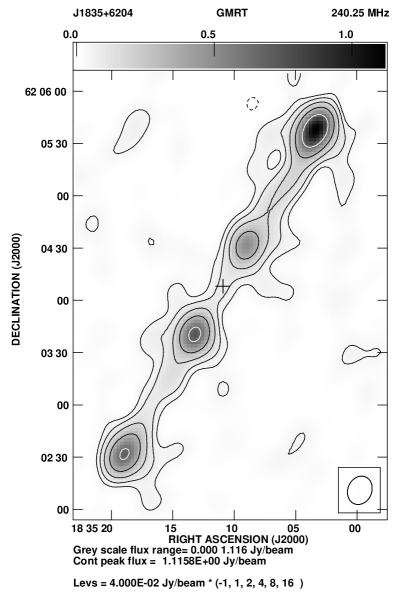
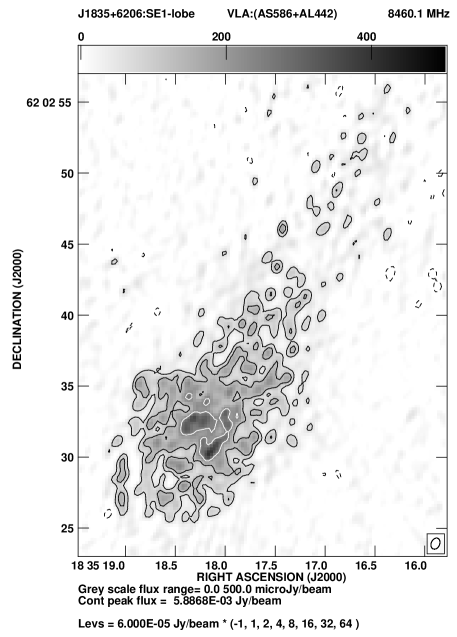
The case of J1835+6204 is different. At the outer end of the NW1 lobe of J1835+6204, we see a reasonably compact component (hotspot), though the SE1 lobe does not show such a component. However, the radio spectra at the position of the outer hotspots are well described by power laws (see Figure 7). This means that the outer lobes at the location of their hotspots are still fed by jet material (for NW1 lobe) or else the time elapsed since the last jet material reached the outer hotspot is short (for the SE1 lobe). In other words, the spectra have not yet suffered sufficient losses to develop curvature. Both inner and outer pairs of hotspots are more or less co-linear with the core, and both the doubles are also reasonably aligned with each other.
3.2 Notes on the sources
J0041+3224 (B2 0039+32): this DDRG has a very elongated and
cylindrical shape. The projected linear sizes of the inner and outer
doubles are 171 and 969 kpc respectively. This makes the outer
structure a giant radio galaxy. The host galaxy of this source is a
20th magnitude galaxy [NASA/IPAC Extragalactic Database (NED)]. This source does
not have a measured redshift; however, we adopt the estimated redshift
of 0.45 quoted by Saikia et al. (2006). In low frequency images we can
see that the inner double is ploughing its way through the cocoon
material of the outer lobes. The inner lobes have compact hotspots
(see Saikia et al. 2006) which are characteristic of FRII radio
galaxies. The outer doubles do not have any hotspots. Radio images at two
frequencies are shown in Figure 1
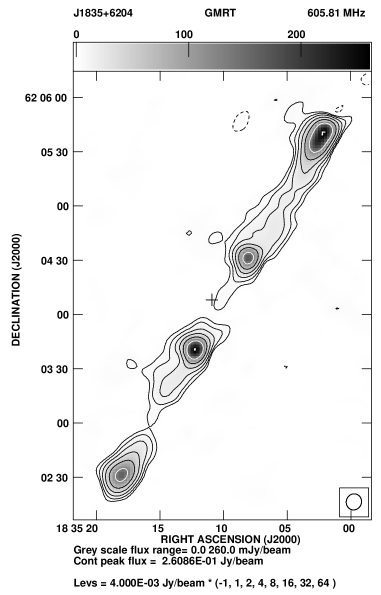
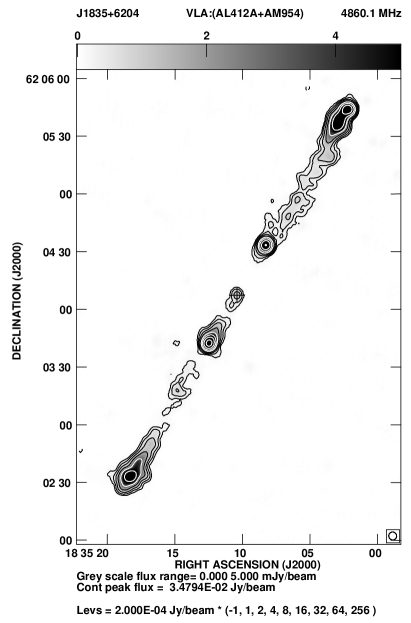
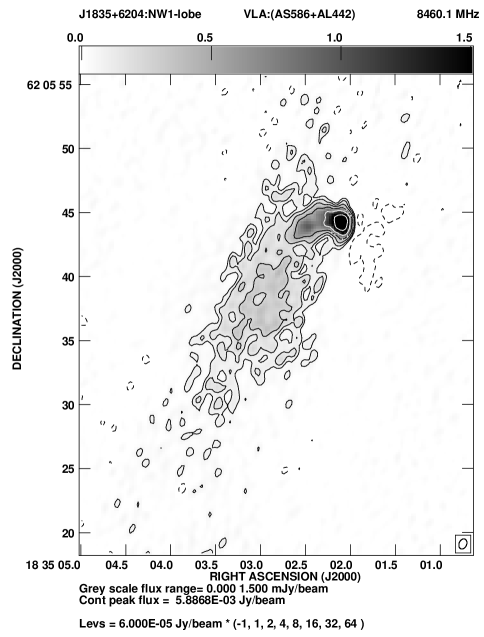
J1835+6204 (B1834+620): this DDRG also has a very elongated and cylindrical shape. The projected linear sizes of the inner and outer doubles are 369 and 1379 kpc, respectively. The outer structure of this radio galaxy is also of giant size. Its host galaxy is a 19.7th magnitude galaxy with a redshift of (Schoenmakers et al. 2000a). The inner double of this DDRG also appears to be ploughing through the cocoon plasma of previous JFA. Unlike J0041+3224, one of the outer lobes (NW1 lobe) of this sources has a compact hotspot-like feature. From Figure 4, it is clear that the jet of NW1 lobe in the previous episode had bent in the western direction by 90 degree with respect to the original jet axis. Figure 2 and 4 display the images of this source at various radio frequencies and resolutions.
| Freq. | Beam size | rms | SI | Cp | Sp | St | Cp | Sp | St | Cp | Sp | St | Cp | Sp | St | ||
|---|---|---|---|---|---|---|---|---|---|---|---|---|---|---|---|---|---|
| MHz | ∘ | mJy | mJy | mJy | mJy | mJy | mJy | mJy | mJy | mJy | |||||||
| /b | /b | /b | /b | /b | |||||||||||||
| (1) | (2) | (3) | (4) | (5) | (6) | (7) | (8) | (9) | (10) | (11) | (12) | (13) | (14) | (15) | (16) | (17) | (18 ) |
| G153.28 | 28.14 | 19.55 | 349 | 8.88 | 7095 | SE1&2 | 1538 | 4250 | NW1&2 | 1054 | 2927 | ||||||
| G240.25 | 16.58 | 13.66 | 304 | 4.11 | 4374 | SE1&2 | 1020 | 2615 | NW1&2 | 581 | 1752 | ||||||
| G331.88 | 09.46 | 08.41 | 61 | 4.87 | 4206 | SE1&2 | 960 | 2465 | NW1&2 | 493 | 1640 | ||||||
| G616.81 | 6.50 | 4.80 | 165 | 0.49 | 2211 | SE1&2 | 567 | 1289 | NW1&2 | 274 | 856 | ||||||
| G1287.44 | 2.61 | 2.33 | 25 | 0.20 | 1016 | SE1 | 13 | 232 | SE2 | 231 | 373 | NW1 | 12 | 262 | NW2 | 92 | 145 |
| V1400.00 | 14.65 | 12.64 | 11 | 0.13 | 940 | SE1&2 | 338 | 582 | NW1&2 | 139 | 360 | ||||||
| V4860.10 | 4.04 | 3.65 | 13 | 0.03 | 296 | SE1 | 6 | 36 | SE2 | 126 | 154 | NW1 | 7.4 | 49 | NW2 | 42 | 52 |
| V8460.10† | 2.41 | 2.26 | 19 | 0.02 | 160 | SE1 | 1 | 9.31 | SE2 | 75 | 100 | NW1 | 1.8 | 16 | NW2 | 21 | 32 |
†: the flux densities are measured after primary beam correction, which was not done in Saikia et al. 2006.
| Freq. | Beam size | rms | SI | Cp | Sp | St | Cp | Sp | St | Cp | Sp | St | Cp | Sp | St | ||
|---|---|---|---|---|---|---|---|---|---|---|---|---|---|---|---|---|---|
| MHz | ′′ | ′′ | ∘ | mJy | mJy | mJy | mJy | mJy | mJy | mJy | mJy | mJy | mJy | ||||
| /b | /b | /b | /b | /b | |||||||||||||
| (1) | (2) | (3) | (4) | (5) | (6) | (7) | (8) | (9) | (10) | (11) | (12) | (13) | (14) | (15) | (16) | (17) | (18 ) |
| G153.25 | 26.18 | 21.27 | 331 | 13.1 | 5510 | SE1&2 | 811 | 2539 | NW1&2 | 1263 | 2898 | ||||||
| G240.25 | 16.68 | 13.71 | 337 | 7.31 | 5762 | SE1&2 | 740 | 2653 | NW1&2 | 1116 | 3141 | ||||||
| G332.50 | 10.28 | 09.51 | 21.5 | 1.72 | 3375 | SE1&2 | 441 | 1555 | NW1&2 | 506 | 1813 | ||||||
| G605.81 | 8.94 | 8.40 | 341 | 1.25 | 1813 | SE1&2 | 261 | 800 | NW1&2 | 257 | 980 | ||||||
| G1287.50 | 2.99 | 2.40 | 338 | 0.17 | 862 | SE1&2 | 102 | 390 | NW1&2 | 70 | 462 | ||||||
| V1442.50a | 4.99 | 3.66 | 334 | 0.02 | 708 | SE1&2 | 101 | 318 | NW1&2 | 75 | 388 | ||||||
| V1440.50b | 1.35 | 1.00 | 357 | 0.04 | 657 | SE1 | 2.7 | 153 | SE2 | 47 | 135 | NW1 | 23 | 273 | NW2 | 30 | 83 |
| V4860.10a | 1.52 | 1.12 | 324 | 0.02 | 200 | SE1 | 1.1 | 37 | SE2 | 17 | 46 | NW1 | 11 | 76 | NW2 | 13 | 33 |
| V4860.10c | 15.31 | 10.03 | 46 | 0.03 | 245 | SE1&2 | 44 | 110 | NW1&2 | 48 | 133 | ||||||
| V4860.10d | 1.71 | 1.14 | 322 | 0.02 | 257 | SE1 | 2.1 | 70 | SE2 | 21 | 50 | NW1 | 12 | 96 | NW2 | 15 | 32 |
| V8460.10e | 0.79 | 0.57 | 336 | 0.02 | 75 | SE1 | 0.20 | 5.6 | SE2 | 5.5 | 26 | NW1 | 2.9 | 26 | NW2 | 3.4 | 18 |
| V8460.10f | 8.79 | 6.45 | 14.5 | 0.04 | 148 | SE1&2 | 26 | 68 | NW1&2 | 22 | 78 | ||||||
| V8460.10g | 0.82 | 0.59 | 336 | 0.02 | 141 | SE1 | 0.4 | 34 | SE2 | 5.9 | 30 | NW1 | 3.1 | 53 | NW2 | 3.7 | 18 |
: Comparing with the flux density values at all other frequencies, it is likely to have some systemic error. a: Project code- AL412A, b: Project code- AS697, c: Project code- AM954, d: Project code- (AL412A+AM954), map from combined data, e: Project code- AL442, f: Project code- AS586, g: Project code- (AS586+AL442A), map from combined data.
| Freq. | Beam size | Err | Err | Err | Project | |||||
| (MHz) | ∘ | (mJy) | (mJy) | (mJy) | (mJy) | (mJy) | (mJy) | code | ||
| (1) | (2) | (3) | (4) | (5) | (6) | (7) | (8) | (9) | (10) | (11) |
| J0041+3224 | ||||||||||
| 1287.5 | 2.61 | 2.33 | 25 | 518 | 28 | 373 | 26 | 145 | 10 | a |
| 4860.1 | 4.04 | 3.65 | 13 | 206 | 8 | 154 | 8 | 52 | 3 | b |
| 8460.1 | 2.41 | 2.26 | 19 | 132 | 5 | 100 | 5 | 32 | 2 | b |
| J1835+6204 | ||||||||||
| 1287.5 | 2.10 | 1.84 | 338 | 250 | 12.70 | 154 | 10.78 | 96 | 6.72 | g |
| 1440.5 | 1.35 | 1.00 | 357 | 218 | 7.94 | 136 | 6.80 | 82 | 4.10 | h |
| 4860.1 | 1.67 | 1.09 | 322 | 79 | 2.84 | 47 | 2.35 | 32 | 1.60 | i |
| 8460.1 | 0.82 | 0.59 | 336 | 48 | 1.73 | 29 | 1.45 | 19 | 0.95 | j |
a: Target of opportunity observation, b: AS741, g: 10CKa01, h: AS697, i: AL412A+AM954, j: AS586+AL442
| Freq. | Cp | Error | Cp | Error | Cp | Error | Reference | |||
|---|---|---|---|---|---|---|---|---|---|---|
| MHz | mJy | mJy | mJy | mJy | mJy | mJy | and | |||
| comment | ||||||||||
| (1) | (2) | (3) | (4) | (5) | (6) | (7) | (8) | (9) | (10) | (11) |
| 74.00 | Int | 10882 | 2176 | E1+W1 | 6727 | 2464 | VLSS | |||
| 153.28 | Int | 7095 | 1064 | E1+W1 | 4402 | 1279 | 1 | |||
| 240.25 | Int | 4374 | 656 | E1+W1 | 2603 | 840 | 1 | |||
| 331.88 | Int | 4206 | 631 | E1+W1 | 2804 | 760 | 1 | |||
| 408 | Int | 2200 | 200 | 2 | ||||||
| 616.81 | Int | 2184 | 153 | E1+W1 | 1289 | 319 | 1 | |||
| 1287.44 | Int | 1016 | 71 | E2+W2 | 518∗ | 28a | E1+W1 | 498 | 76 | 1 |
| 1400.00 | Int | 940 | 47 | 3 | ||||||
| 1400.00 | Int | 900 | 100 | 4 | ||||||
| 1400.00 | Int | 967 | 48 | NVSS | ||||||
| 1400.00 | Int (avg) | 936 | 40 | E1+W1 | 441 | 167 | 5 | |||
| 4830p | Int | 291 | 40 | E1+W1 | 89 | 82 | 6 | |||
| 4850 | Int | 269 | 15 | 7 | ||||||
| 4850 | Int | 273 | 35 | 8 | ||||||
| 4850q | Int (avg) | 271 | 19 | E1+W1 | 70 | 73 | 9 | |||
| 4840 (Avg) | E1+W1 (Avg) | 80 | 27 | 10 | ||||||
| 4860.10 | Int | 296 | 15 | E2+W2 | 206∗ | 08b | E1+W1 | 90 | 17 | 1 |
| 8460.10 | Int | 160 | 08 | E2+W2 | 132∗ | 05b | E1+W1 | 28 | 9.4 | 1 |
(avg): The average flux density of the values in the previous rows for the same frequency.
(Avg): The average of p and q
∗: The power law spectra of the total inner lobes (without the core) were constrained by a least-squares fit with these data, and extrapolated to the lowest frequency. The flux density of total inner double (core subtracted) at all other frequencies was estimated from the fitted power law.
a: Fluxes of E2 and W2 have been separately measured by us from the FITS image with the AIPS task ‘TVSTAT’. Errors for E2 and W2 were assumed to be 7 per cent in both cases; hence, the error of on E2+W2 is the quadratic sum of the errors on E2 and W2.
b: The same procedure was followed as in a; however, the errors for E2 and W2 were assumed to be 5 per cent.
References and comment: The references are to the total flux densities.
VLSS: VLA Low-frequency Sky Survey (Cohen et al. 2007). We have measured the flux from the FITS file of the map. 20 per cent error has been assumed for the 74 MHz integrated flux.
NVSS: NRAO VLA Sky Survey (Condon et al. 1998). 5 per cent error in integrated flux has been assumed.
1: This work. Integrated flux values have been measured by us directly from the maps with the AIPS task ‘TVSTAT’. 2: Colla et al., 1970. Error has been assumed to be equal to the completeness limit of the survey. 3: Saikia et al., 2006. Flux values are measured by us from the FITS maps . 4: White & Becker, 1992. Error has been assumed to be equal to the completeness limit of the survey. 5: The integrated flux at 1400 MHz has been averaged. The errors in three independent measurements have been propagated to calculate the error in average integrated flux. 6: Griffith et al., 1990. The error has been assumed to be equal to the completeness limit of the survey. 7: Becker, White & Edwards 1991. Error is 5.6 per cent as quoted by NED. 8: Gregory & Condon, 1991. Error is 12.8 per cent as quoted by NED. 9: The integrated flux at 4850 MHz has been averaged. The errors in two independent measurements have been propagated to calculate the error in average integrated flux. 10: Since the outer lobes have errors as large as the fluxes at 4850 and 4830 MHz, we averaged the total outer lobe fluxes at 4850 and 4830 MHz to get a better flux value with less error at some average frequency of 4840 MHz. The errors on the outer total fluxes at 4850 and 4830 MHz have been propagated to calculate the error at the averaged frequency of 4840 MHz. For the spectrum of total outer lobes this averaged point is considered instead of using the 4850 and 4830 MHz points separately.
| Freq. | Cp | Error | Cp | Error | Cp | Error | Reference | |||
|---|---|---|---|---|---|---|---|---|---|---|
| MHz | mJy | mJy | mJy | mJy | mJy | mJy | and | |||
| comment | ||||||||||
| (1) | (2) | (3) | (4) | (5) | (6) | (7) | (8) | (9) | (10) | (11) |
| 38.00 | Int | 19100 | 1910 | 1 | ||||||
| 38.00 | Int | 13700 | 1370 | 1 | ||||||
| 38.00 | Int(avg) | 16400 | 1175 | SE1+NW1 | 11371 | 1772 | 2 | |||
| 153.25 | Int | 5510 | 826 | SE1+NW1 | 3994 | 850 | 3 | |||
| 240.25 | Int | 5929 | 889 | SE1+NW1 | 4899 | 900 | 3 | |||
| 332.50 | Int | 3375 | 506 | SE1+NW1 | 2596 | 517 | 3 | |||
| 326.00 | Int | 2970 | 119 | 4 (WENSS) | ||||||
| 605.81 | Int | 1813 | 127 | SE1+NW1 | 1348 | 143 | 3 | |||
| 1287.50 | Int-c | 859 | 60 | SE2+NW2 | 250∗ | 13p | SE1+NW1 | 616 | 70 | 3 |
| 1400.00 | Int | 800 | 40 | SE1+NW1 | 574 | 52 | 5 (NVSS) | |||
| 1442.50a | Int-c | 708 | 35 | SE2+NW2 | 218∗ | 8q | SE1+NW1 | 488 | 48 | 6 |
| 4850.00 | Int | 200 | 19 | 7 | ||||||
| 4850.00 | Int | 195 | 29 | 8 | ||||||
| 4850.00 | Int(avg) | 198 | 17 | SE1+NW1 | 120 | 28 | 9 | |||
| 4860.10b | Int-c | 245 | 12 | SE2+NW2 | 79∗ | 3q | SE1+NW1 | 167 | 17 | 10 |
| 8460.10c | Int-c | 148 | 7 | SE2+NW2 | 48∗ | 1.7q | SE1+NW1 | 100 | 11 | 11 |
(avg): The average flux density of the previous rows at the same frequency.
: Power law spectra of total inner lobes (without the core) were constrained by least-squares fit with these data, and extrapolated to the lowest frequency. Flux density of total inner double (core subtracted) at all other frequencies was estimated from the fitted power law.
a: From the archival VLA data set with project code, AL412A.
b: From the archival VLA data set with project code, AM954.
c: From the archival VLA data set with project code, AS586.
p: Flux densities of SE2 and NW2 were separately measured by us from the FITS image with the AIPS task ‘TVSTAT’. Errors of SE2 and NW2 have been assumed to be 7 per cent apiece; hence, the error of SE2+NW2 is the quadratic sum of errors of E2 and W2.
q: Same procedure has been followed as in q; however, the errors for SE2 and NW2 were assumed to be 5 per cent apiece.
Reference and comment: The references are to the total flux densities.
WENSS: Westerbork Northern Sky Survey (Rengelink et al., 1997). 4 per cent error in total flux density has been assumed.
NVSS: NRAO VLA Sky Survey (Condon et al. 1998). 5 per cent error in integrated flux has been assumed.
1: Both Integrated flux density and error values are from 8C survey (Hales et al., 1995) as quoted by Nasa Extragalactic Database (NED). 2: This total flux density is the average of the two values of 38 MHz fluxes as quoted by NED. 3: The integrated flux densities are from our GMRT measurements (project code: 10CKa01). 4: Westerbork Northern Sky Survey (WENSS, Rengelink et al., 1997). 5: NRAO VLA Sky Survey (NVSS, Condon et al. 1998). 6: The integrated flux density is from the data with project code, AL412A and inner double flux density is from the data with project code, AS697. 7: The integrated flux density and error is from Gregory & Condon (1991). 8: The integrated flux density and error is from Becker, White & Edwards (1991). 9: The integrated flux density is the average of the above two rows. The error has been propagated from those in the above two rows. 10: The integrated flux density is from the data with project code, AM954. 11: The integrated flux density is from the data with project code, AS586.
3.3 Spectra
The observational parameters and flux densities of the outer and inner lobes/doubles of J0041+3224 and J1835+6204 are listed in Table 2 and 3. Obviously, all the uv data used for imaging have different shortest baselines, and so we re-mapped the fields of both sources at high frequencies with a similar lower uv cutoff to image the inner double free from outer diffuse emission. We tabulate the high-frequency flux densities and their errors in Table 4 for the lobes and total inner doubles of J0041+3224 and J1835+6204, which were measured from the maps re-made with similar lower uv cutoff. No appreciable curvature is visible in the spectra of the components (except the core) of the inner doubles of both the sources within our observable frequency range. Therefore, we have fitted power laws to the spectral data of the inner lobes and the total inner doubles with the flux density and error values tabulated by Konar et al. (2012, in prep). The flux density measurements of J0041+3224 at 617, 1287, 4860 and 8460 MHz have been made from the FITS maps published by Saikia et al. (2006). A power law has been fitted to only three high frequency points (namely, at 1287, 4860 and 8460 MHz) tabulated in Table 4 to constrain the spectra of NW2 lobe, SE2 lobe and the total inner double of J0041+3224. These spectra have been extrapolated to lower frequencies. Expressing in mJy and in MHz, the best fitting power laws for the SE2 lobe and NW2 lobe of J0041+3224 are and respectively. The best fitting power law for the total inner double is . For J1835+6204, we have fitted power laws to only four high frequency data points (namely, at 1287, 1440, 4860 and 8460 MHz) tabulated in Table 4 to constrain the spectra of SE2 lobe, NW2 lobe and entire inner double. The best fitting power laws for SE2 and NW2 lobes are and respectively. The best fitting power law of the total inner double is . For this source as well, we have used the same units of and to express these power laws. The fits of both the sources along with the observed data points are plotted in Figure 5. The flux densities of the integrated source, inner and outer doubles, are given in Table 5 and 6. The integrated spectra of the entire source, and the spectra of the core-subtracted outer and inner doubles are presented in Figure 5. Clearly there is steepening in the spectra of the integrated source and the outer lobes at high frequencies. The steepening of the spectra at higher frequency is presumably due to spectral ageing (due to synchrotron and inverse-Compton losses). Low-frequency measurements from our observations supplemented with those from the literature show significant straightening of the spectra below 300 MHz. This low frequency straight part of the spectra can be characterised by a power law whose spectral index most likely represents the injection spectral index (). Further analysis of these issues is described in Section 4.
3.4 Radio core
The J2000.0 positions of the radio core estimated from our high-resolution images are RA: , DEC: for J0041+3224 and RA: , DEC: for J1835+6204. For J0041+3224, a weak radio core has been detected only at 4860 MHz with a flux density of 0.57 mJy, and a weak peak of emission at 8460 MHz with a brightness of 0.2 mJy/beam at the position of the core has been found by Saikia et al. (2006).
The radio source J1835+6204 has a clear core detection at L band, C band and X band. The core flux densities as measured by us from our observations as well as from the VLA archival data have been compiled in Table 7. Different observations were done at different epochs, enabling us to conclude that no prominent variability has been found over a duration of 12 years.
| Telescope | Project | Date of obs. | Freq. | Resolution, PA | Flux | Error |
|---|---|---|---|---|---|---|
| code | , deg | density | ||||
| MHz | mJy | mJy | ||||
| (1) | (2) | (3) | (4) | (5) | (6) | (7) |
| GMRT | 10CKa01 | 13-JUL-2006 | 1287.5 | 02.1001.84, 338 | 1.66 | 0.42 |
| VLA-A | AS697 | 21-OCT-2000 | 1440.5 | 01.3501.00, 357 | 1.74 | 0.09 |
| VLA-B | AL412A | 18-FEB-1997 | 1442.5 | 04.9903.66, 334 | 1.62 | 0.18 |
| VLA-B | AL412A | 18-FEB-1997 | 4860.1 | 01.5201.12, 324 | 1.53 | 0.09 |
| VLA-D | AM954 | 27-JUN-2008 | 4860.1 | 15.3110.03, 46 | 1.51 | 0.09 |
| VLA-B | AL442.A | 07-OCT-1998 | 8460.1 | 00.7900.57, 336 | 1.05 | 0.05 |
| VLA-D | AS586.B | 23-AUG-1996 | 8460.1 | 08.7906.45, 14 | 1.25 | 0.08 |
4 Spectral ageing analysis
In order to determine the spectral age in different parts of the lobes, i.e. the time elapsed since the radiating particles were last accelerated, we apply the standard theory describing the time-evolution of the emission spectrum from particles with an initial power-law energy distribution characterised by an injection spectral index and distributed isotropically in pitch angle relative to the magnetic field direction (JP model, see Jaffe & Perola, 1973). Our assumption is that the initial energy distribution over the entire frequency/energy range of the spectrum of a blob of relativistic plasma is characterised by the injection spectral index (). After sufficient amount of time is elapsed, the synchrotron spectrum develops a curvature at high frequencies. This curvature is characterised by a spectral break frequency. The spectral break frequency () above which the radio spectrum steepens from the injected power law slope is related to the spectral age and the magnetic field strength through
| (1) |
where =0.318(1+)2 is the magnetic field strength equivalent to the cosmic microwave background radiation; and are expressed in units of nT, while is in GHz.
4.1 Determination of and values
There are three free parameters in the spectral ageing models: the normalisation, the injection spectral index () and the break frequency (). Determination of requires very low frequency data points in the synchrotron spectrum.


High frequency data points are required for the accurate determination of . The smaller the lower limit of the frequency span, the better the determination of . Once is determined accurately, the higher the upper limit of the frequency span, the better the determination of . However, for high-frequency measurements, it is necessary to be cautious about the loss of flux due to central uv holes in the interferometric data, as well as the loss due to sparse uv coverage and the low surface brightness of the lobes at higher frequencies.
Since low frequency flux measurements are very important in the determination of , we have compiled very low frequency measurements from the literature and tabulated in Table 5 and 6. While compiling the low frequency flux densities from the literature, we have discarded those which are very discrepant from the curve obtained by simple freehand drawing. A simple estimate by eye clearly identifies data that are highly discrepant. Since most of the measurements from the literature are total flux density values, and no flux density values exist for a single lobe component of a source, we have constrained the total synchrotron spectrum of the two outer lobes together for each source to very low frequencies. The flux densities and their errors compiled in Tables 5 and 6 have been used in fitting the spectra of various components of J0041+3224 and J1835+6204. The flux densities of the total inner doubles of both the DDRGs are fitted well with power laws and these best fitting power laws are given in Section 3.3. We have estimated the flux densities of the inner double from the best-fitting power law models at those frequencies for which we could not directly measure the flux densities of the inner doubles due to contamination of diffuse emission of outer double and/or poor resolution. For those estimated flux densities the errors have been calculated using the formula , where (the normalisation), (the error in normalisation) and are in mJy, is in MHz and is the error in spectral index of a general power law spectrum of the form .
In order to determine a value of , we first fitted the JP (Jaffe & Perola 1973) and Continuous Injection (CI) models (Pacholczyk, 1970) of radiative losses to the flux densities of the outer lobes. We found that the CI model does not provide a good fit to the data. The application of the CI model to the outer structure is physically unjustifiable for DDRGs in general, because a) the jets no longer feed the outer lobes, and b) the outer lobes are so old that they have suffered synchrotron and inverse-Compton losses to a large extent (and possibly adiabatic loss to some extent). So high energy electrons are no longer being replenished in the outer lobes. Therefore, it is reasonable that the CI model does not provide a good fit for the total spectrum of the outer lobes, and instead the JP model is more appropriate. However, for J1835+6204, the NW1 lobe has a clear compact hotspot (a signature of the ongoing feeding by the last ejected jet material in the previous episode of JFA) and both the NW1 and SE1 lobes have single power-law spectra within our observable range of radio frequencies. Even in that case the CI model does not yield a good fit, while the JP model does. This might have something to do with the fact that most of the parts of the lobes except the hotspot are old and the high energy particles are not replenished. Since we cannot constrain the radio spectra of each lobe separately up to very low frequencies, we have assumed that is the same for both the outer lobes, and that remains constant over the entire active phase of JFA.


The various best fitting parameters of the spectra of the outer lobes of our 2 DDRGs are shown in Figure 5 These fits have been used to constrain the values of for the ageing analysis of the outer lobes of the sources. Since there is no visual indication of curvature in the spectra of the inner doubles, we have fitted a pure power law to the inner lobes of both the DDRGs. Then, the total-intensity maps made by us at multiple frequencies were convolved with a common angular resolution (circular beams of for J0041+3224 and for J1835+6204). Each lobe was then split into a number of strips, separated approximately by the common resolution element (with which the maps were convolved) along the axis of the source, and the spectrum of each strip has been constrained by fitting a spectral ageing model with our measured flux densities. For fitting the synchrotron ageing model to the observed spectra of our sources, we have used the SYNAGE software (Murgia 1996), which is specifically written for this purpose. SYNAGE was used to fit a JP model to the spectrum of each strip of the outer lobes of our sample sources. For a given source, we fixed the value of , as determined by our fits, shown in Figure 5, for all strips. The fitted spectra of some of the strips are shown in Figure 6 and 7. If we treat as a free parameter, then the resulting best-fitting values of for different strips show significant variation with large error bars. We believe that the large errors of in the fit are possibly due to the large uncertainty in the surface brightness for each strip. So, for all the strips of both lobes of each source, we have fixed the value of to the best fitting value obtained from the JP model fit to the observed spectrum of entire outer double. The values of used for all the strips (of a source) are quoted in the caption of Table 8 and 9 for J0041+3224 and J1835+6204 respectively. Here our assumption is that the jet injected all the relativistic plasma with the same value of over the entire period of the active phase. We would need much more sensitive data to treat as free parameter for the spectrum of each strip. The values of including the 1 errors for the strips of outer lobes are listed in Table 8 and 9. In our previous work, whenever we could constrain for each outer lobe separately, we found that they are not very different (Jamrozy et al. 2008, Machalski et al., 2010), and so there is no strong evidence for significantly different values of this parameter in two opposite lobes of a radio galaxy.
4.2 Magnetic field determination and radiative ages
To determine the spectral age of the particles in each strip, we estimated the magnetic field strength of each strip. The values of the minimum energy density and the corresponding magnetic field, Bmin, were calculated using the formalism described in Appendix of Konar et al. (2008). We then used the values of the minimum energy magnetic field and the break frequency (from Table 8 and 9) to calculate the spectral ages of the strips via Equation 1 . While performing spectral ageing analysis we have assumed that 1) the energy losses of the relativistic cocoon plasma are only due to synchrotron and IC processes, 2) the blob of plasma in each strip was injected over a short period compared to the age of the radio galaxy, so that the blob of plasma can be assumed to have been injected in a single shot, 3) there is no mixing of plasma between any two adjacent strips, 4) the magnetic field is in equipartition (the result of Croston et al., 2005 is in favour of this assumption) and does not change appreciably over the lifetime of the radio source and 5) the magnetic field is completely tangled. The spectral ages of the strips as a function of distance are plotted in Figure 8. As expected, the synchrotron ages for both the outer lobes increase with distance from the edges (warm-spots) of the lobes. We have fitted a polynomial to every age-distance plot to extrapolate the curve to the position of the core. The value of the polynomial at the position of the core gives the expected spectral age of the outer lobes. Since in both of our DDRGs there is diffuse relativistic plasma from the outer lobes all the way back to the core, it makes sense to determine the spectral age by this extrapolation method. We could not determine the age of the outer lobe plasma near the core region due to (i) the presence of inner lobes and (ii) the non detection of diffuse plasma in our higher frequency images. While interpreting these numbers, caveats related to the evolution of the local magnetic field in the lobes need to be borne in mind (e.g. Rudnick, Katz-Stone & Anderson 1994; Jones, Ryu & Engel 1999; Blundell & Rawlings 2000). While Kaiser (2000) suggested that spectral and dynamical ages are comparable if bulk backflow and both radiative and adiabatic losses are taken into account in a self-consistent manner, Blundell & Rawlings (2000) argue that this may be so only in young sources with ages much less than 10 Myr. In a study of the FRII type giant radio galaxy, J1343+3758, Jamrozy et al. (2005) find the dynamical age to be approximately 4 times the maximum synchrotron age of the emitting particles.


5 Discussion
We find that the spectral ages of the two different outer lobes of the DDRGs are different. This does not necessarily mean that the two jets started at different points in time. This result may be due to additional loss processes other than synchrotron and IC radiative losses, (e.g., adiabatic expansion loss) and any kind of re-acceleration of the particles that may be at work with differing efficiency in the two lobes. The differing spectral ages then provide information about the asymmetry of the physical conditions (internal and external) of the lobes on opposite sides. A source can have asymmetric jet powers, an asymmetric environment or both, in addition to radiative losses and acceleration of the particles in the lobes.
In the western outer lobe of J0041+3224, we find that the variation of spectral age with distance from the core is not smooth. As we go from the western hotspot towards the core we see that the spectral age becomes almost constant from a distance of 400 kpc all the way to 175 kpc from the core. This may be due to particle re-acceleration (of unknown origin). The outer lobes of J0041+3224 are highly asymmetric which may be due to genuine asymmetry in the density of the ambient medium combined with asymmetric jet power and/or any other asymmetric parameters. Since the outer lobes are not active, the lobe heads are likely to advance with a speed slower than when they were active. Since the radio spectra of the inner doubles are a very close approximation to a single power law, we cannot determine spectral ages for them. However, we have determined upper limits to the spectral ages of the inner doubles with the assumption that the break frequencies are greater than the highest observed frequencies (see Figure 5). We also determined a lower limit to their age by assuming the jet-head advancement speed to be 0.5 times the velocity of light.
As we have discussed, we find different radiative ages for the two lobes of both sources. The actual ages of the lobes are very unlikely to be different as it is not physically plausible for the two jets of an AGN to start at different times. Therefore, our interpretation of the apparent age difference is that processes other than radiative losses, e.g., re-acceleration and adiabatic expansion, are at work. Their relative impact on the energy loss in different lobes might be different, giving rise to different radiative ages. We can therefore obtain a more meaningful spectral age for the outer doubles by taking an average of the spectral ages of the two lobes, provided they are not different by huge factor (e.g.,5 times). For J0041+3224, the spectral ages obtained by extrapolating the spectral age vs. distance plot are 24 and 28 Myr for the NW1 and SE1 lobes respectively, with an average of 26 Myr. If we assume that the re-acceleration of particles took place in the inner parts of the NW1 lobe, then the extrapolated age of this lobe would be 84 Myr. In such a situation, we must invoke re-acceleration in the entire SE1 lobe as it has a much lower spectral age than the NW1 lobe. It is difficult to infer the true evolutionary history of this source. For J1835+6204, the extrapolated ages are 31 and 13 Myr for the NW1 and SE1 lobes, respectively, with an average of 22 Myr. The average spectral age of the two warm-spots () is 4.44 Myr for J0041+3224 and 1 Myr for J1835+6204. The spectra of the inner doubles show no curvature, and therefore we could not constrain the break frequency or determine a spectral age. However, the highest frequencies in the power-law spectra of both the DDRGs are 8.46 GHz, which can be assumed to be a lower limit on the break frequency. This leads to upper limits on the spectral ages of the inner doubles of 5.30 and 3.94 Myr for J0041+3224 and J1835+6204, respectively.
It is known from various observations that the inner hotspots travel with a velocity with respect to the host galaxy (Konar et al., 2006; Schoenmakers et al., 2000b; Safouris et al., 2008). So we have estimated the lower limits on the ages (kinematic ages) of the inner doubles for a hotspot velocity of , which are 0.34 and 1.34 Myr for J0041+3224 and J1835+6204, respectively. Of course, if one interprets the inner lobes to the bow shock driven by the jets (Brocksopp et al., 2007; 2011; Safouris et al., 2008) then the jet head velocity is supposed to be close to the jet bulk velocity which will be higher than 0.5. In that situation the lower limit of the ages of the inner doubles will be even lower. The spectral age of the outer hotspot is the time elapsed since the last jet material reached the hotspot in the previous episode of JFA; similarly the age of the inner double is the time since the current episode of JFA started. So the durations of the active phases () and quiescent phase () are given by
| (2) |
and
| (3) |
respectively; where, is the time which any blob of jet material took to travel from the core to the warm-spot in the previous episode, is the age of the outer double, and is the age of the inner double. If we assume that the bulk velocity of the jet fluid is the velocity of light, then the values of (when averaged over the two outer lobes) are 1.58 and 2.25 Myr for J0041+3224 and J1835+6204 respectively. So, the duration of active phase in the previous episode of JFA of J0041+3224 is 20 Myr (using Equation 2). Since the estimated age of the inner double of J0041+3224 is given by Myr and Myr, the duration of the quiescent phase for this source is given by Myr (using Equation 3). So, quiescent phase of J0041+3224 lies between 3.6 to 28.4 per cent of the active phase of the previous episode of JFA. For J1835+6204 the situation is different. The break frequency is higher than the conventional fiducial value of the highest frequency ( GHz) up to which the spectrum exists (see Table 9). Therefore, it is unlikely that there is any real curvature in the spectrum. However, SYNAGE tries its best to fit with a curvature. There is no appreciable curvature in the spectra of the outer hotspots (NW1-strip 01 and SE1-strip 01) of J1835+6204 (see Figure 7). Though we have formally obtained an age of 1 Myr, ageing has not really started at the outer hotspots, as the last ejected jet material is still feeding them, which is particularly clear in the NW1 hotspot. Therefore, we will assume the ages of the outer hotspots to be zero in the sense that they are still fed,
| Strip | Dist. | ||||
|---|---|---|---|---|---|
| kpc | GHz | nT | Myr | ||
| NW1-lobe | |||||
| NW1-01 | 573.3 | 4.94 | 1.860.18 | ||
| NW1-02 | 516.0 | 7.42 | 1.730.17 | ||
| NW1-03 | 458.6 | 29.95 | 1.310.13 | ||
| NW1-04 | 401.3 | 17.55 | 1.120.11 | ||
| NW1-05 | 344.0 | 30.75 | 1.140.11 | ||
| NW1-06 | 286.6 | 1.70 | 1.240.12 | ||
| NW1-07 | 229.3 | 14.06 | 1.160.11 | ||
| NW1-08 | 177.7 | 9.10 | 1.070.11 | ||
| SE1-lobe | |||||
| SE1-01 | 378.4 | 2.26 | 2.010.20 | ||
| SE1-02 | 321.0 | 8.01 | 1.780.18 | ||
| SE1-03 | 263.7 | 6.68 | 1.420.14 | ||
| SE1-04 | 206.4 | 1.31 | 1.420.14 |
| Strip | Dist. | ||||
|---|---|---|---|---|---|
| kpc | GHz | nT | Myr | ||
| NW1-lobe | |||||
| NW1-01 | 664.2 | 1.70 | 1.850.18 | ||
| NW1-02 | 561.7 | 2.39 | 1.210.12 | ||
| NW1-03 | 456.2 | 2.90 | 0.940.09 | ||
| NW1-04 | 363.1 | 4.02 | 1.000.10 | ||
| NW1-05 | 186.2 | 0.38 | 1.080.11 | ||
| SE1-lobe | |||||
| SE1-01 | 679.7 | 1.84 | 1.310.13 | ||
| SE1-02 | 574.2 | 4.80 | 1.040.10 | ||
| SE1-03 | 468.6 | 14.43 | 0.670.07 | ||
| SE1-04 | 372.4 | 7.06 | 0.850.08 | ||
| SE1-05 | 189.3 | 0.99 | 0.860.08 |
and as a result the high energy particles are replenished. In high resolution X band image (Figure 4), we can easily see that there is a hotspot like feature in NW1 lobe. However we don’t see such prominant hotspot like feature in the SE1 lobe. Hotspot formation is a complicated phenomenon. It certainly seems possible that a diffuse hotspot can be formed without the jet having been turned off completely, and that is evident in the radio image of high resolution hotspots in some of the FR II sources published by Leahy et al., (1997). Moreover, if there is a weak compact hotspot like the one in north western lobe of 3C105 (see Leahy et al., 1997), we might not be able to see because of the sensitivity of our high resolution X band image in Figure 4. So, it is difficult to conclude whether the SE1 lobe is still fed by the jets or not. Here we argue from both points of view.
First we assume that NW1 and SE1 lobes are still fed by the jets of previous episode. The last jet material has been ejected from the nucleus, but the jet material is still travelling down the jets. However, we do not know how long ago the last jet material was ejected from the nucleus. We assume that , which is ( Myr), is the time since the last jet material was ejected. So to calculate and , and should be replaced by and 0 in Equations 2 and 3 respectively. However, must be greater than the lower limit of as the last jet material of previous cycle had to be ejected before the current episode started. So . Again, if the last ejected jet material has already reached the hotspots, then Myr. So, we ultimately get Myr. The upper limit of the age of the inner double can be at most , not greater than that. So, . Therefore, we get Myr. Considering that must be a positive number, and the limits of and , we get Myr and Myr. The limits of are so close to each other that the average of those limits is a good approximation of the which is 20.20 Myr. So, in this range of quiescent phase, the last ejected jet material can travel from the nucleus up to 279 kpc, and not more than that. So the quiescent phase of J1835+6204 has lasted less than per cent of the active phase of the previous episode of JFA.
If we assume that the lack of a hotspot in SE1 lobe is real, then it may suggest that jet activity has ceased there and we expect that the hotspots of the inner double are the current jet termination points. In such a case, the presence of a compact hotspot in the NW1 lobe is the feature that needs to be explained. Since hotspots of the inner double are the current jet termination points, then we would expect the hotspot in the NW1 lobe to disappear at some point. Assuming also that the jet turns off on both sides at the same time, the only way we can see a hotspot in the NW1 lobe and not in the SE1 lobe is if the NW1 lobe is on the far side of the source, so that we are seeing it at an earlier time. For the sake of a simple calculation we assume that the source is symmetrical. Let the true lobe length (from the core to the hotspot) be and the angle to the line of sight be . Then and the distance along the line of sight between the hotspots is given by , where is the observed lobe length and is basically the Light Travel Time (LTT) multiplied by speed of light (). So is . If we require degrees (unification arguments) then the maximum value of 1.4 Mpc. So the maximum time difference between the hotspots is 4.6 Myr. Suppose the jet was disconnected from the lobes at a time in the past and the effects travel down the old jet channel at a speed . If we see no hotspot in the SE lobe, then we know that . But if we see a hotspot in the NW1 lobe, which we see at an earlier time, then we know , or . For simplicity if we assume degrees and , then we have Mpc and Mpc. So, essentially we obtain Myr. So the jet switch-off time has to be more than 3.3 Myr ago and less than 7.9 Myr ago (measured with respect to the observations of the SE1 hotspot). We have already found out that the jet travel time of the last ejected material for J1835+6204 is 2.25 Myr which is less than . Therefore, we can calculate the hotspot fading away time () from this analysis. The hotspot fading time can be given by
| (4) |
Considering the limits of for the source J1835+6204, we obtain Myr. Even if the hotspot fade away time is the lower limit of this range, i.e., 1.05 Myr which is enough for the SE1 hotspot to get diffuse, as it takes only sound crossing time which is yr (Kaiser et al., 2000). From Equation 4, the age of the warm spot () in SE1 lobe can be given by Myr. Using the magnetic field value of nT of the SE1-strip01 from Table 9 into Equation 1, we obtain GHz. So, our estimation of warmspot age in the SE1 lobe of J1834+6204 in our interpretation of absence of the SE1 hotspot is fully consistent with the fact that we don’t see any curvature in the spectrum of SE1-strip01 (see Figure 7) in our observable range of frequencies. This particular set of numbers doesn’t seem to make it so implausible that we are seeing a genuine one-sided hotspot, though these are the most favourable assumptions. As approaches 90 degrees, we have to be observing the source at more and more special times to see a hotspot in one lobe and not in the other, since our constraints are basically . So, for any source with roughly symmetrical lobes there will be some time window where we expect to see a hotspot in one lobe but not in the other. Now again in Equations 2 and 3, we replace and by and 0 (as the spectrum is straight) respectively. Keeping in mind the limits of and , we obtain from Equations 2 and 3 that Myr and Myr. So, if this interpretation is correct, then the quiescent phase of J1835+6204 can be given by percent of the active phase of the previous cycle.
6 Concluding remarks
We have presented the results of multifrequency radio observations of two DDRGs, J0041+3224 and J1835+6204, using both the GMRT and the VLA. We have carried out detailed spectral ageing analysis of these two sources, and have come to the following conclusions.
-
1.
From our observations, it is quite clear that the inner doubles are propagating through the cocoon material deposited in the previous episode of JFA. This may be the case for most of the DDRGs, even though the old cocoon material is not always visible in images of limited sensitivity.
-
2.
Our spectral ageing analysis reveals the youth of the inner doubles and the old age of the outer doubles, consistent with the model in which the central engine is capable of restarting a previously quenched jet of the central engines, and with all previous work.
-
3.
The images show that in both cases the pairs of doubles are not significantly misaligned. This suggests that there has not been any realignment of the galaxy gas disk, accretion disk and/or jet axis of the central engine.
-
4.
The radio core of J1835+6204 shows no evidence of variability, whereas Konar et al. (2006) and Jamrozy et al. (2007) have reported high variability in the cores of the restarting radio galaxies J1453+3308 and 4C29.30 respectively. The results we present here suggest that strong core variability may or may not be observed in restarting radio galaxies.
-
5.
The synchrotron age of the emitting particles in both the lobes of the outer doubles increases with distance from the edges of the lobes, as expected from the backflow model of FRII radio galaxies (This behaviour is also seen in lobed FR I sources. See Parma et al., 1999 and Laing et al., 2011. ). There appears to be either re-acceleration of particles in the inner part of the NW1 lobe of J0041+3224, or adiabatic loss in the middle of this lobe. The reasons for the re-acceleration or adiabatic loss are not known. Further investigation is required to understand this phenomenon.
-
6.
The duration of the quiescent phase of J0041+3224 is greater than 0.72 Myr but less than 5.68 Myr, which is between per cent of the duration of the active phase of the previous episode of JFA, provided the age of the outer double is 26 Myr. If the age of the outer double is 84 Myr, then the duration of quiescent phase is per cent of the duration of the active phase of the previous episode of JFA. The duration of the quiescent phase of J1835+6204 is less than 1 Myr, which is per cent of the active phase of the previous episode of JFA. It is therefore clear that the quiescent phase can be as small as a few per cent of the active phase duration.
-
7.
Our age estimates of J1835+6204 are fully consistent with the outer lobes being still fed by the last ejected jet material, though the alternative explanation of one sided visible hotspot because of the LTT effect is also physically plausible.
Acknowledgments
We thank the GMRT and the VLA staffs for their help with the observations. The Giant Metrewave Radio Telescope is a national facility operated by the National Centre for Radio Astrophysics of the Tata Institute of Fundamental Research. The National Radio Astronomy Observatory is a facility of the National Science Foundation operated under co-operative agreement by Associated Universities Inc. This research has made use of the NASA/IPAC extragalactic database which is operated by the Jet Propulsion Laboratory, Caltech, under contract with the National Aeronautics and Space Administration. CK and MJ acknowledge the access to the SYNAGE software provided by M. Murgia (Istituto di Radioastronomia, Bologna, Italy. MJ acknowledges the Polish MNiSW funds for scientific research in the years 2009-2012 under agreement no. 3812/B/H03/2009/36. JHC acknowledges support from the South-East Physics Network (SEPNet). CK acknowledges the grant (No. NSC99-2112-M-001-012-MY3) from the National Science Council, Taiwan.
References
- [] Baars J.W.M., Genzel R., Pauliny-Toth I.I.K., Witzel A. 1977, A&A, 61, 99
- [] Barnes J.E., Hernquist L., 1996, ApJ, 471, 115
- [] Becker R.H., White R.L. and Edwards A.L., 1991, ApJS, 75, 1
- [] Belsole E., Worrall D.M., Hardcastle M.J., Croston J.H., 2007, MNRAS, 381, 1109
- [] Blundell K.M., Rawlings S., 2000, AJ, 119, 1111
- [] Brocksopp, C., Kaiser, C.R., Schoenmakers, A.P., de Bruyn, A.G., 2007, MNRAS, 382, 1019
- [] Brocksopp, C., Kaiser, C.R., Schoenmakers, A.P., de Bruyn, A.G., 2011, MNRAS, 410, 484
- [] Cohen A.S., Lane W.M., Cotton W.D., Kassim N.E., Lazio T.J.W., Perley R.A., Condon J.J., Erickson W.C, 2007, AJ, 134, 1245
- [] Colla G. et al., 1970, A&AS, 1, 281
- [] Condon J.J., Cotton W.D., Greisen E.W., Yin Q.F., Perley R.A., Taylor G.B., & Broderick J.J. 1998, AJ, 115, 1693
- [] Croston J.H., Birkinshaw M., Hardcastle M.J., Worrall D.M., 2004, MNRAS, 353, 879
- [] Croston J.H., Hardcastle M.J., Birkinshaw M., Worrall D.M., 2003, MNRAS, 346, 1041
- [] Croston J.H., Hardcastle M. J., Birkinshaw M., Worrall D.M., Laing R.A., 2008, MNRAS, 386, 1709
- [] Croston J.H., Hardcastle M.J., Harris D.E., Belsole E., Birkinshaw M., Worrall D.M., 2005, ApJ, 626, 733
- [] Evans D.A., Hardcastle M.J., Croston J.H., Worrall D.M., Birkinshaw M., 2005, MNRAS, 359, 363
- [] Gregory P.C. and Condon J.J., 1991, ApJS, 75, 1011
- [] Griffith Mark, Langston G., Heflin M., Conner S., Lehar J., Burke B., 1990, ApJS, 74, 129
- [] Hales S.E.G., Waldram E.M., Rees N., Warner P.J., 1995, MNRAS, 274, 447
- [] Hardcastle M.J., and Worrall D.M., 1999, MNRAS, 309, 969
- [] Hardcastle M.J., and Worrall D.M., 2000, MNRAS, 319, 562
- [] Hota A., Sirothia S.K., Ohyama Y., Konar C., Kim S., Rey S.-C., Saikia D.J., Croston J.H., Matsushita S., 2011, MNRAS, 417, L36
- [] Jaffe W.J., Perola G.C., 1973, A&A, 26, 423
- [] Jamrozy M., Konar C., Machalski J., Saikia D.J., 2008, MNRAS, 385, 1286
- [] Jamrozy M., Machalski J., Mack K.-H., Klein U., 2005, A&A, 433, 467
- [] Jamrozy M., Konar C., Saikia D.J., Stawarz Ł., Mack K.-H., Siemiginowska A., 2007, MNRAS, 378, 581
- [] Jetha N.N., Hardcastle M.J., Ponman T.J., Sakelliou I., 2008, MNRAS, 391, 1052
- [] Jones T.W., Ryu D., Engel A., 1999, ApJ, 512, 105
- [] Kaiser C.R., 2000, A&A, 362, 447
- [] Kaiser C.R., Schoenmakers A.P., Röttgering H.J.A., 2000, MNRAS, 315, 381
- [] Konar C., Jamrozy M., Saikia D.J., Machalski J., 2008, MNRAS, 383, 525
- [] Konar C., Hardcastle M.J., Croston J.H., Saikia D.J., 2009, MNRAS, 400, 480
- [] Konar C., Saikia D.J., Jamrozy M., Machalski J., 2006, MNRAS, 372, 693
- [] Laing, R.A., Guidetti D., Bridle A.H., Parma P., Bondi M., 2011, MNRAS, 417, 2789
- [] Leahy J.P., Black A.R.S., Dennett-Thorpe J., Hardcastle M.J., Komissarov S., Perley R.A., Riley J.M., Scheuer P.A.G., 1997, MNRAS, 291, 20
- [] Machalski J., Jamrozy M., Konar C., 2010, A&A, 510, 84
- [] McNamara B.R., Nulsen P.E.J., 2007, ARA&A, 45, 117
- [] Murgia M., 1996, Laurea Thesis, University of Bologna.
- [] Pacholczyk A.G., 1970, Radio Astrophysics, Freeman & Co., San Francisco
- [] Parma P., Murgia M., Morganti R., Capetti A., de Ruiter H. R., Fanti R., 1999, A&A, 344, 7
- [] Rengelink R.B., Tang Y., de Bruyn A.G., Miley G.K., Bremer M.N., Röttgering H.J.A., Bremer M.A.R., 1997, A&AS, 124, 259
- [] Rudnick L., Katz-Stone D., Anderson M., 1994, ApJS, 90, 955
- [] Saikia D.J., Konar C., Kulkarni V.K., 2006, MNRAS, 366, 1391
- [] Saikia, D.J., Jamrozy, M., 2009, BASI, 37, 63
- [] Schoenmakers A.P., de Bruyn A.G., Röttgering H.J.A., van der Laan H., Kaiser C.R., 2000a, MNRAS, 315, 371
- [] Schoenmakers A.P., de Bruyn A.G., Röttgering H.J.A., van der Laan H., 2000b, MNRAS, 315, 395
- [] Spergel D.N. et al., 2003, ApJS, 148, 175
- [] Safouris V., Subrahmanyan R., Bicknell G.V., Saripalli L., 2008, MNRAS, 385, 2117
- [] White R.L. & Becker R.H., 1992, ApJS, 79, 331
- [] Worrall D.M. & Birkinshaw M., 2000, ApJ, 530, 719