High-Redshift Galaxies with Large Ionization Parameters
Abstract
Motivated by recent observations of galaxies dominated by emission lines, which show evidence of being metal poor with young stellar populations, we present calculations of multiple model grids with a range of abundances, ionization parameters, and stellar ages, finding that the predicted spectral line diagnostics are heavily dependent on all three parameters. These new model grids extend the ionization parameter to larger values than typically explored. We compare these model predictions with previous observations of such objects, including two new Lyman- emitting galaxies (LAE) that we have observed. Our models give improved constraints on the metallicity and ionization parameter of these previously studied objects, as we are now able to consider high ionization parameter models. However, similar to previous work, these models have difficulty predicting large line diagnostics for high ionization potential species, requiring future work refining the modelling of FUV photons. Our model grids are also able to constrain the metallicity and ionization parameter of our LAEs, and give constraints on their Ly escape fractions, all of which are consistent with recent lower redshift studies of LAEs.
Subject headings:
galaxies: abundances, galaxies: high-redshift, galaxies: ISM, galaxies: starburst1. Introduction
Understanding the history of galactic evolution requires us to probe the early universe when the first star-formation episodes were occurring. It is during these events that the first metals are created, via large, hot, young stellar populations. These hot stars drive efficient ionization, which is quantified by the ionization parameter, , the ratio of the mean ionizing photon flux, , and the mean atom density, (Dopita et al., 2006). These hot stars have short lives, thus the population’s flux is strongly dependent on stellar age.
The metals produced by massive stars allow for more efficient cooling in nebular gas, leading to the efficient formation of enriched stars. A galaxy’s star-formation history can therefore be assessed through its metallicity (Tinsley, 1980). The repeating cycle of star formation and evolution enriches the interstellar medium with the products of nuclear burning from each generation of stars. The metallicity of a galaxy is extremely important for setting the temperature of stars in stellar synthesis models, for accurately predicting equivalent widths, as well as illustrating the chemical enrichment history of the galaxy. Assuming very little metals accumulate from accretion from the intergalactic medium (IGM) then the metallicity of the galaxy should be a lower limit for all of the metals created in past star-forming cycles. It is merely a lower limit as some of these metals have been ejected in energetic outflows from supernovae and stellar winds to enrich the IGM further, while accretion of metal-poor gas will lower the observed metal abundance.
Previous work has demonstrated that the metallicity is correlated with the stellar mass of the galaxy (Zaritsky et al. 1994; Tremonti et al. 2004; Erb et al. 2006; Mannucci et al. 2010; Xia et al. 2012). Among the youngest and least massive galaxies (see Finkelstein et al. 2011 and references therein) are Lyman- emitters (LAE). These galaxies are host to young stellar populations and have a significant number of hot, massive stars whose ionizing radiation will mainly escape from the galaxy as Ly photons. The Ly line itself can contain up to 6% of the total emitted light from a star-forming galaxy (Partridge & Peebles, 1967), yielding the location of the galaxy and information on its star-formation history. While their specific star formation is quite large, LAEs typically have an absolute star formation an order of magnitude smaller than other high-redshift galaxies, such as Lyman-break galaxies, and are thus an excellent test of the low mass, low star-formation regime of the fundamental metallicity relation (FMR; Mannucci et al. 2010), which was in good agreement for redshifts , but inconsistent with other galaxies.
The ionization parameter of a galaxy is suggestive of the effective temperature of its stellar population. Larger ionization parameters than cm s-1, although uncommon in the local universe (See Rigby & Rieke 2004; Lilly et al. 2003), may very well be present in the early universe around stronger, younger starbursts. Indeed, earlier work by Fosbury et al. (2003), Richard et al. (2011), and Erb et al. (2010) and very recent work by Nakajima et al. (2013), Jaskot & Oey (2013) and Xia et al. (2012) have demonstrated that these earlier galaxies undergoing significant starburst do have larger ionization parameters. These same objects also have low metallicities, as expected.
Large ionization parameter galaxies will excite more nebular emission lines, which act to cool the gas. Thus to maintain the observed strong emission lines, there must be a maintained source of ionizing flux. This suggests either a galaxy with a near constant rate of star formation, where new bright hot stars are replacing the recently deceased stars, or a very recent, nearly instantaneous epoch of star formation, which is transient and unable to maintain a high ionization for more than a few Myr. While a continuous star formation will reach equilibrium and then be age-independent (Kewley et al., 2001), a stellar population that was created nearly instantaneously will begin losing the very brightest stars after a very short amount of time, and the O-B population as a whole and the temperature of its nebular gas will diminish significantly by about 5 Myr (Schaller et al. 1992; Schaerer et al. 1993; Charbonnel et al. 1993; Levesque et al. 2010). Left undisturbed by feedback effects, the most metal rich nebular gas will cool efficiently such that beyond this age almost no emission lines will be visible.
With suitably chosen emission lines, we can constrain the metallicity and ionization parameter. For the redshifts and fluxes of the objects we study in this work, we are limited to observing [OII] 3727 Å, [NeIII] 3869 Å the [OIII] 4959,5007 Å doublet, and H 4861 Å. Thus we can compare our observations with the [OIII] 5007 Å/[OII] and [OIII] 5007 Å/H line diagnostics, both of which were described in Levesque et al. (2010). Although these line diagnostics are highly dependent on ionization parameter, they have been shown (e.g., Kewley et al. 2002) to depend on metallicity as well. Note that there exists a degenerate dependence of the [OIII]/H diagnostic on the metallicity of the galaxy, making it a difficult diagnostic to use without other constraints. This degeneracy stems from the fact that at low abundances the amount of ionized oxygen grows with the metallicity until reaching a critical abundance where the photoionized region can efficiently cool, above which the ionized oxygen then drops with increasing abundance (Kewley & Dopita, 2002). Typically this degeneracy is broken by observing another line diagnostic, such as [NII]/[OII]. However, as we will demonstrate, if the [OIII]/[OII] ratio, which is monotonic in both metallicity and ionization parameter, predicts a sufficiently low metallicity and high ionization parameter, then this ratio will also break the degeneracy of the [OIII]/H diagnostic.
The stellar age can be well constrained by observing the continuum flux in several spectral bands. By combining these observations with stellar synthesis models, one can determine the best fit models which predict a stellar formation history and age (e.g. Yan et al. 2005). This method probes the total population of stars, instead of just the hottest stars that are probed by observing emission lines.
Thus, whether one is constraining the stellar age, or the metallicity and ionization parameter, one must compare observations with models. Levesque et al. (2010) combined the output of the stellar population synthesis code Starburst99 (Leitherer et al. 1999; Vázquez & Leitherer 2005) with the photoionization code Mappings III (Binette et al. 1985; Sutherland & Dopita 1993) to model the emission line diagnostics capable of constraining the metallicity and ionization parameter given a star formation history and age. Their work illustrated how different stellar population formation histories and ages, metallicities, densities, stellar mass-loss models, and ionization parameters can vastly change the ratios between different spectral lines. Such a study is essential for attempting to probe the conditions of galaxies at all redshifts. However, their work focused on ionization parameters more typical of low-redshift, older galaxies, with values of cm s-1.
Earlier work, including Kewley & Dopita (2002), only considered one stellar age and formation history. Levesque et al. (2010) have demonstrated that this is insufficient, as older, high metallicity populations are typically too cold to match observed emission line strengths. Recent observations that demonstrate ionization parameters beyond those studied by Kewley & Dopita (2002) are still using this work on which to base their conclusions. This demonstrates the need to continue the work of Levesque et al. (2010) for the highest ionization parameters, allowing for more detailed study of the new population of young high redshift galaxies.
In this work, we have observed two high redshift galaxies having bright Ly lines, and strong [OIII] 5007 Å detection. One has its ionization parameter well matched with the upper end of the work of Levesque et al. (2010), while the second has its ionization parameter above their work. There is a clear gap in models for higher ionization parameter, thus we continue their work for the higher ionization parameter values. We use these models to better constrain our larger ionization parameter object, and apply them to other large ionization parameter objects in Appendix A.
The structure of this paper is as follows. We begin by discussing our sample, observations and data reduction in §2. We then present the measured line emission in §3, and discuss motivation for requiring higher ionization parameter models. In §4 we introduce the ionization models created using MAPPINGS III, presenting multiple line diagnostics relevant to this work. In §5 we apply our models to our sample to determine what constraints they place on the ionization parameter, metallicity, H flux and Ly escape fraction. We conclude in §6. Additional line diagnostic comparisons and applications with multiple galaxies in the literature are presented in Appendix A.
2. Observations
We observed two Ly emitting galaxies, LAE40844 and LAE27878, whose selection is described in McLinden et al. (2011). LAE40844 was previously detected in Ly with a redshift of , and LAE27878 was previously detecting in Ly with a redshift of . We performed subsequent IR spectroscopic observations at Gemini North with the Near-infrared Integral Field Spectrometer (NIFS; McGregor et al. 2003) which uses an Integral Field Unit (IFU) with a field-of-view of 2.99” 2.97” over 29 69 pixels. This device has a spectral resolving power of roughly 9600 in the two bands we used. Observations of LAE40844 for [OII] and [OIII] using H-Band (1.65 m) and K-Band (2.20 m) were done on March 4th, 2010, and observations of LAE27878 for [OII], H, and [OIII] using H-Band (1.65 m) and K-Band (2.00 m and 2.20 m) were done on March 5th and April 27 th, 2010. We did not observe H for LAE40844 as its systemic redshift, as determined by McLinden et al. (2011), placed this line in a region of strong telluric absorption. Based on our limited observing time we settled on solely observing H for LAE27878. We note that on all nights our objects were unresolved in our 0.6” seeing, consistent with a LAE galaxy of size kpc (see Malhotra et al. 2012) at an angular-size distance of 1600 Mpc at z3.1.
Each science object was observed for 300 sec per exposure with 30 (13) exposures in the K- Band, centred on 2.20, and 20 (11) exposures in the H-Band, centred on 1.65, for LAE40844 (LAE27878). LAE27878 also had 16 exposures in K-Band, centred on 2.00 , to look at H. Each science object was coupled with 30 sec exposures of two A0V standard stars to later correct for telluric absorption and to perform the flux calibration. Finally, calibration frames were taken at the end of the observing night, including darks, flats and spectral correction frames to rectify the image plane into the IFU.
The reduction process almost completely followed the reduction tasks provided by Gemini. This pipeline was designed to develop the datacube and included flat-field and dark correction as well as some sky line subtraction and telluric absorption correction. Of this, we modified the sky line subtraction and postponed the telluric absorption correction.
Our observations did not include sky frames, thus to compose a sky frame for each science we took the previous two exposures and following two exposures and median-combined them. As the offset pattern had five unique positions, this allowed only the sky to be preserved. For the first and last (second and second-to-last) exposures, the sky was created by median combining the three succeeding and three preceding (preceding plus three succeeding and three preceding plus succeeding) exposures, respectively. A second sky-subtraction was performed by determining the median value of the non-science area of the final datacube at each spectral plane and subtracting that from the entire plane. This method removed particular sky fluctuations specific to the exposure.
The telluric absorption correction was performed simultaneously with the flux calibration, which was completed by using the Pickles Model Spectra (Pickles, 1998) for A0V stars. LAE40844 was calibrated by scaling the A0V model spectra to match the observed H- and K-Band 2MASS magnitudes (Cutri et al., 2003) of HIP41798 and HIP73200. Once scaled, this spectrum was divided by the observed spectrum to get a sensitivity function relating counts to . This simulataneously corrected for telluric absorption. Finally, the sensitivity function was multiplied by the observed spectrum for LAE40844 and renormalized for the different integration times between the standard star and the science. LAE27878 was flux-calibrated in the same manner with telluric standard stars HIP41798 and HIP59351.
The final flux calibrated spectrum was then constructed for each exposure by performing an unweighted summation of the spatial pixels of the IFU containing the object flux. We then averaged each exposure’s spectrum together. Noise estimates were determined by performing the identical procedure to five blank sky regions of the IFU. At every wavelength all noise spectra (five times as many as science spectra) were averaged together. The expected average was zero, and any non-zero component was also present in the science, thus this value was subtracted from the science flux. Note that this final correction was negligible. At every wavelength we determined the standard deviation of the noise. The uncertainty in our science flux was simply this standard deviation normalized by the square root of the number of science exposures. We stress that at no point were we subtracting science data from itself. The sky subtraction and noise were determined from multiple non-science regions of the IFU, and were thus statistically robust.
Finally, any observed line at the expected systemic redshift was fitted with a Gaussian profile. To estimate line flux uncertainties, we repeated the fit for 6,000 synthetic spectra where each wavelength’s flux was the sum of the flux observed and a random number from a normal distribution with standard deviation equal to the observed 1- uncertainty in that wavelength’s flux. Together these gave a distribution of possible line fluxes, where we took the mean value and the standard deviation to be the observed line flux and its 1- uncertainty. For lines that were not observed, 3- upper limits on flux were found by following the method of Finkelstein et al. (2011), where a mock line profile was added to the spectrum at the expected wavelength and then repeatedly decreased in flux until the signal to noise ratio fell below the level.
3. Final spectra
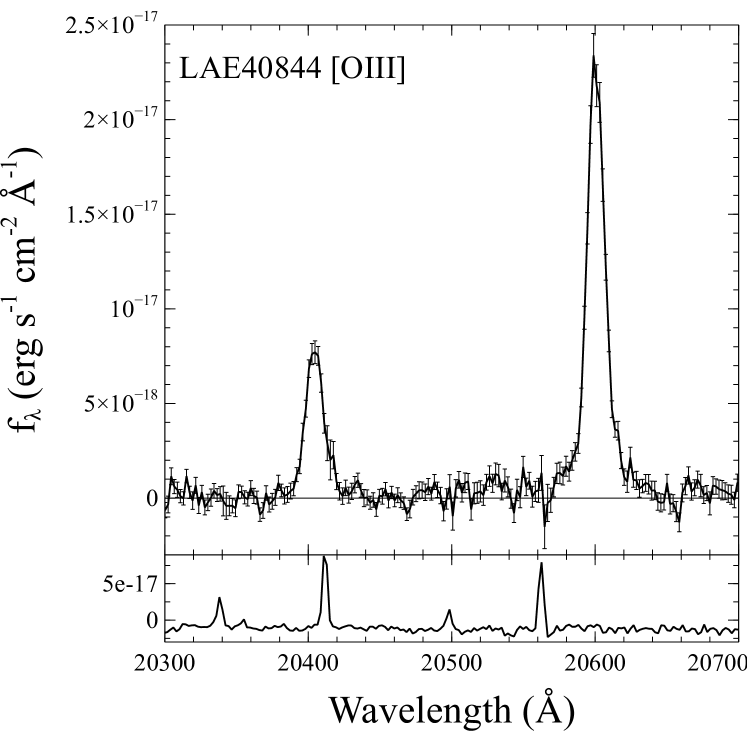
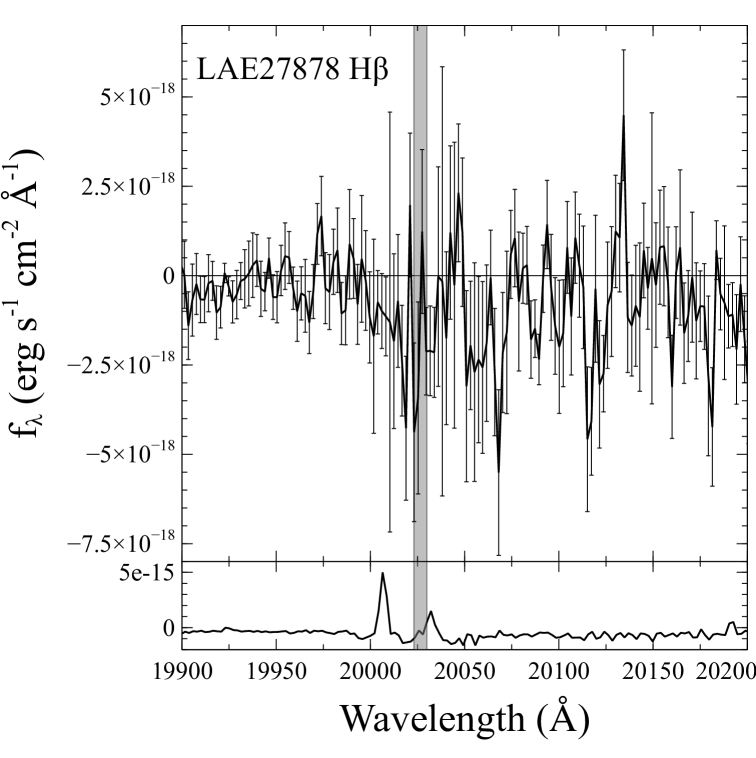
We successfully detected [OIII] for both LAE40844 and LAE27878 with redshifts of (see 1) and (see 2), respectively. We fit a Gaussian for the [OIII] 5007 Å line, which had a reduced chi-squared value of 1.4 and 1.1 for LAE40844 and LAE27878, respectively, and determined the total line flux from this profile. The [OIII] 4959 Å line was constrained to have the same redshift and line width as the 5007 Å line. We then applied an extinction correction following Calzetti et al. (2000) with an value of 0.15 and 0.10 for LAE40844 and LAE27878, respectively, as determined by McLinden et al. in prep. (2013). These extinction values are the result of multi-band observations and SED fitting, and are consistent over small variations in the best fit. The measured [OIII] flux from the 5007 (4959) Å line was 32.33 1.74 (11.90 0.67)and 6.85 1.06 (3.56 0.51)for LAE40844 and LAE27878, respectively.

| Galaxy Characteristic | LAE40844 | LAE27878 |
|---|---|---|
| 3.11639 0.00021 | 3.12051 0.00021 | |
| Ly line fluxaa | ||
| 3.11330 0.00011 | 3.11835 0.00006 | |
| OIII line flux ( Å)aa | 32.33 1.74 | 6.85 1.06 |
| OIII line flux ( Å)aa | 11.90 0.67 | 3.56 0.51 |
| OII line fluxaa | 3.05 1.63 | 2.9 |
| NeIII line fluxaa | 1.8 | 2.6 |
| Ionization Parameter, bb - assuming a minimum metallicity of , see §5.1 | ||
| Metallicity, ZccIn units of Z⊙ | - | |
| H line fluxa,da,dfootnotemark: | ||
| % | % |
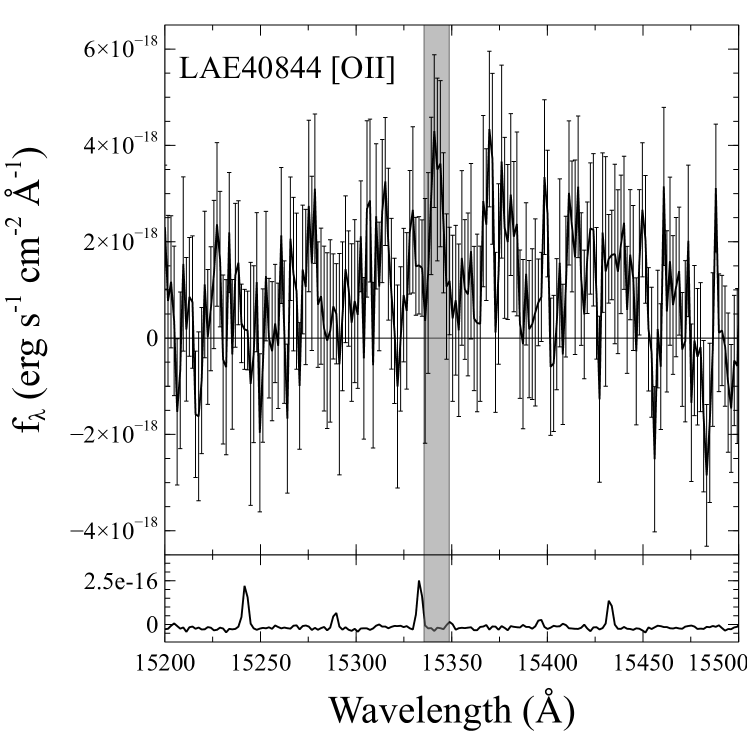
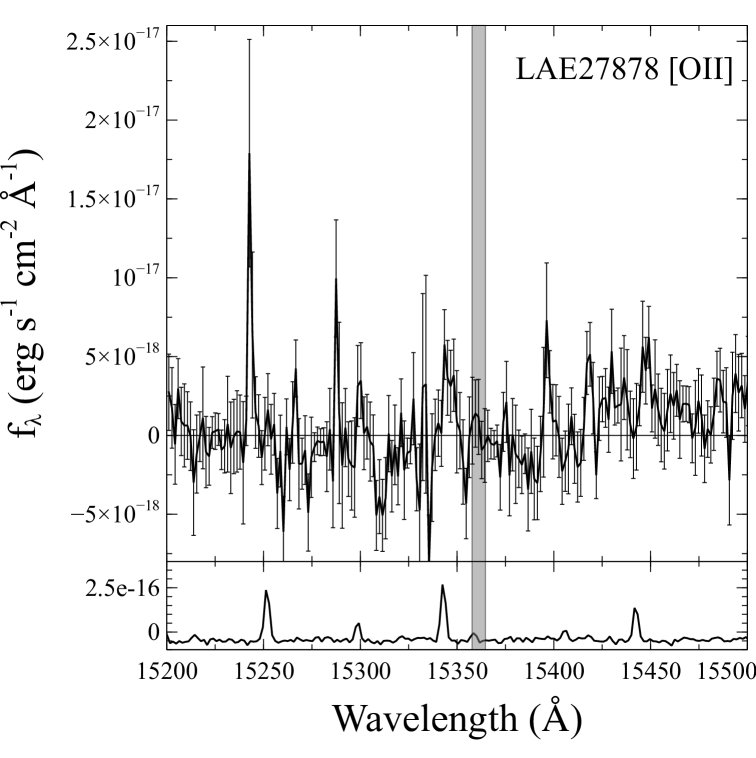
Following the same technique as for the [OIII] 4959 Å line, we detected [OII] at about the 2- level for LAE40844 (see grey region in 1). After applying the extinction correction we measured the [OII] flux to be 3.05 1.63. We did not detect [OII] from LAE27878, thus, following the procedure outlined in §2, we determined 3- upper limits on the [OII] line flux to be 2.9for LAE27878.
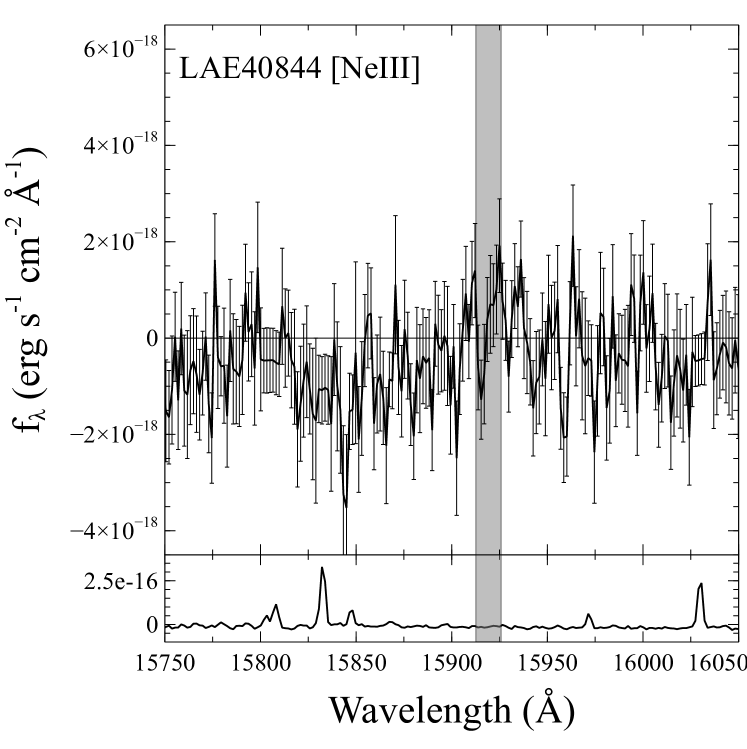
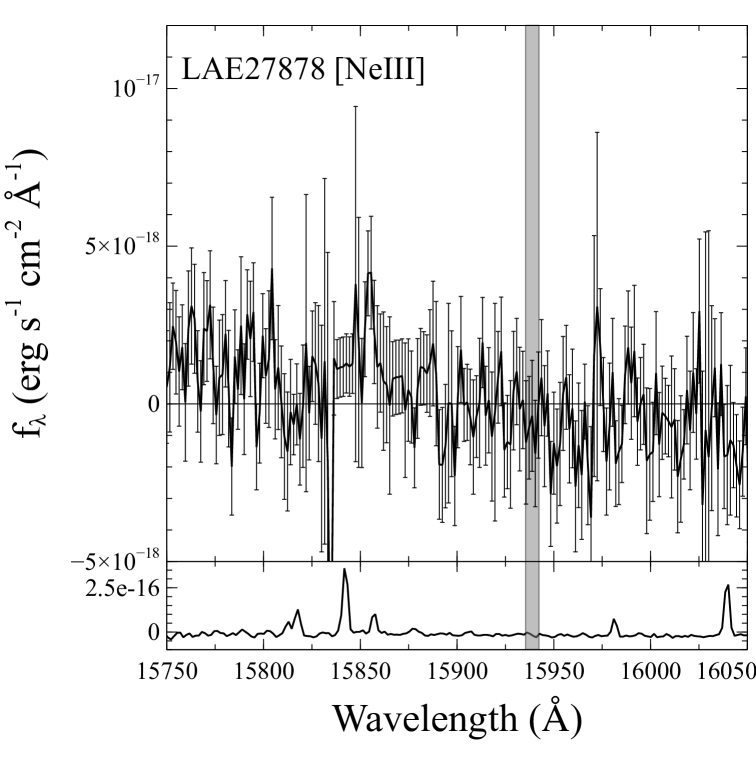
We did not detect [NeIII] 3869 Å in either LAE40844 or LAE27878. We thus determined a 3- upper limit on the [NeIII] line of 1.8 and 2.6 for LAE40844 and LAE27878, respectively. We only had H coverage for LAE27878 (see middle of 2). Unfortunately, we were unable to completely compensate for the strong telluric variations at this wavelength and had no detection. We got a 3- upper limit on the H flux of 4.3. We recognize that time variation in the telluric absorption may be unaccounted for in our sky subtraction technique, thus we limit any further conclusions based on this upper limit. A complete summary of the measured and determined line fluxes for LAE40844 and LAE27878 can be seen in Table 1.
The single detection of [OIII] and constraint of [OII] for LAE27878 allows us to make few conclusions for this object. The lower limit for this ratio implies an ionization parameter consistent with the models of Levesque et al. (2010), although a larger ionization parameter is possible. We explore this more fully in §5. The detections of both [OIII] and [OII] for LAE40844 demonstrate that this galaxy has an ionization parameter larger than those considered in Levesque et al. (2010). To better understand this galaxy, and other high ionization galaxies discovered recently, we present models in this regime, continuing the work of Levesque et al. (2010).
4. Ionization Models
We created models to compare with observed emission lines from galaxies, constraining their gas-phase metallicities and ionization parameters. Previous works (e.g. Kewley et al. 2002; Nagao et al. 2006; Levesque et al. 2010) have presented models with ionization parameters in the range of - . However, larger ionization parameters, although uncommon in the local universe (e.g., Rigby & Rieke 2004; Lilly et al. 2003), may very well be present in the early universe around stronger, younger starbursts. Indeed, recent observations (e.g., Fosbury et al. 2003; Richard et al. 2011; Erb et al. 2010; Xia et al. 2012; Jaskot & Oey 2013; Nakajima et al. 2013) have demonstrated that these earlier galaxies undergoing significant starburst do have larger ionization parameters. This work extends the existing models of Levesque et al. (2010) to higher values of ionization parameter.
To simulate photoionization regions we took the Starburst99 (Leitherer et al. 1999; Vázquez & Leitherer 2005) outputs of Levesque et al. (2010) and used these as input for the photoionization code Mappings III (Binette et al. 1985; Sutherland & Dopita 1993). We wished to investigate models with larger ionization parameters, extending earlier work to best constrain the physical parameters of LAE40844. All Starburst99 models were previously described in Levesque et al. (2010).
The Mappings code was developed by Binette et al. (1985) to model shocks and photoionization regions. Sutherland & Dopita (1993) improved upon this code, which was used in Dopita et al. (2000) and Kewley et al. (2001). These were followed by more improvements, including a more sophisticated treatment of dust (Groves et al., 2004), the effects of absorption, charging, and photoelectric heating by the grains. These improvements are explained in more detail in Groves et al. (2004) and Snijders et al. (2007) and were used in Kewley et al. (2006) and Levesque et al. (2010). Given the artificial ionizing FUV spectrum from Starburst99 we adopted a plane-parallel nebular geometry with the same range of densities as Levesque et al. (2010) but with a range of larger ionization parameters. Using these parameters in Mappings III, we computed a grid of plane-parallel isobaric photoionization models.
We studied both continuous and instantaneous star formation histories with model ages of 6 Myr and 0, 1, and 3 Myr, respectively. We considered metallicities of 0.05, 0.2, 0.4 and 1 solar (using the solar value of presented in McGaugh 1991), and we adopted the HIGH mass-loss tracks from the Geneva models. Given these outputs we then generated model line fluxes using Mappings III models with hydrogen densities of 10 and 100 and ionization parameters of , , , , , , , , , and . Recall that the ionization parameter is the ratio between the ionizing photon flux and the hydrogen density, and is a proxy for the fastest speed an ionizing front can attain. The largest ionization parameter was chosen to agree with the work of Groves et al. (2004) where , however we note that the samples of Rigby & Rieke (2004) and Lilly et al. (2003) illustrate that galaxies, in general, are not seen with values above . These much larger ionization parameters are expected for more metal-poor galaxies in their first cycles of star-formation.
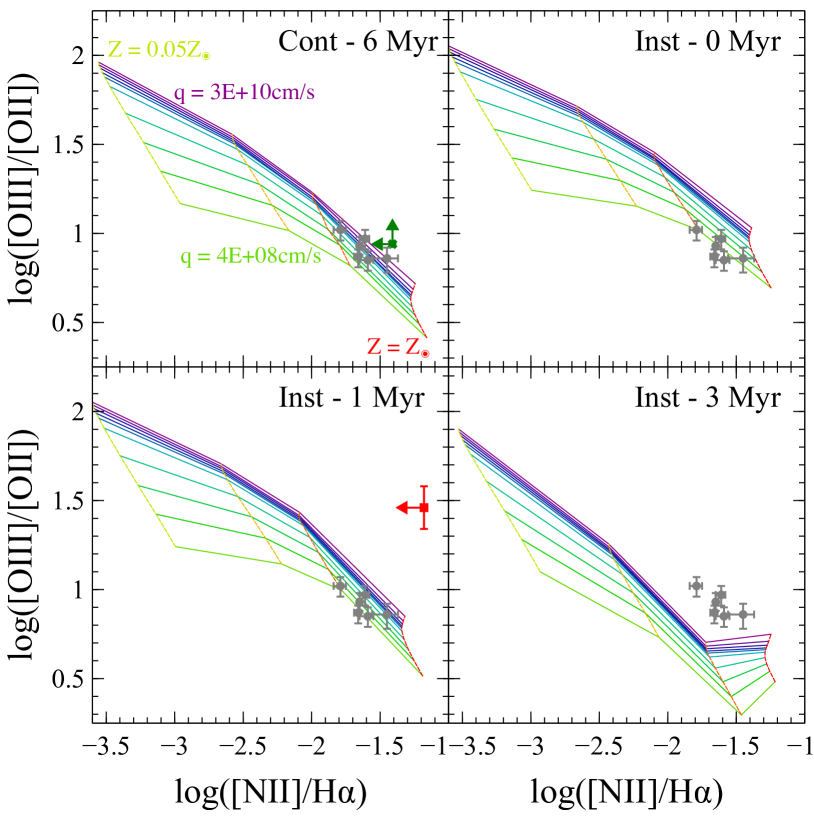
In the following subsections we briefly discuss the line diagnostics line ratios appropriate for ground-based observations of galaxies. This limits us to the [OIII]/[OII] , [OIII]/H, and line ratios, and we present them in various combinations. We also discuss in Appendix A the [NeIII]/[OII], [NII]/H, and [NII]/[OII] line ratios, presenting them in various combinations, and discuss these new models’ implication for other objects in the literature.
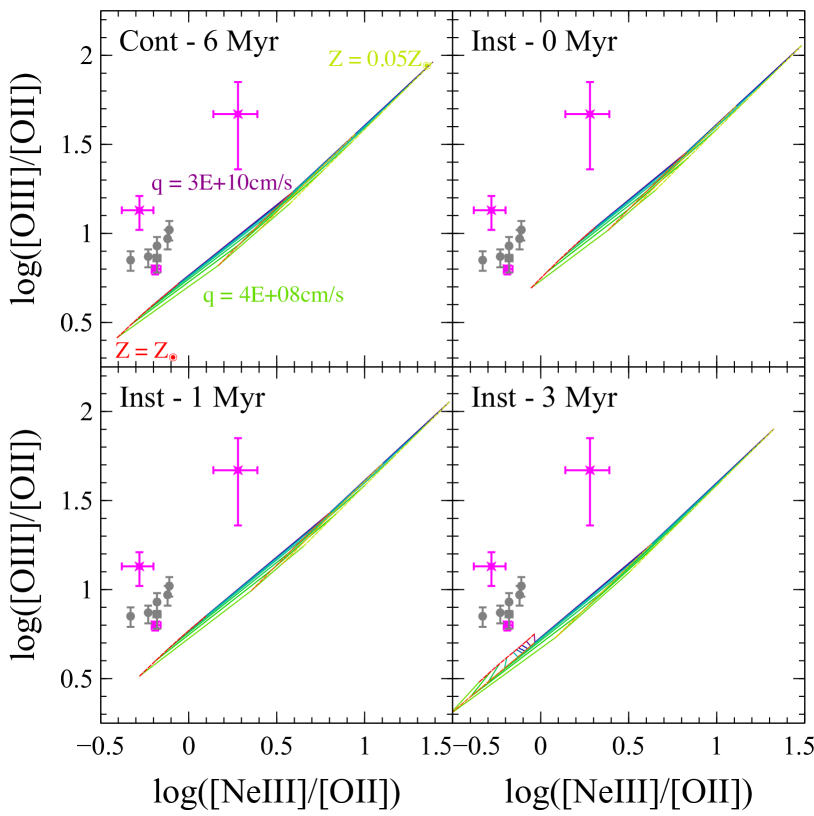
4.1. [OIII]/[OII]
The [OIII]/[OII] line ratio is described in detail in Levesque et al. (2010). This ratio is commonly used as an ionization parameter diagnostic, although it is weakly dependent on metallicity (Kewley & Dopita, 2002), with larger values corresponding with larger ionization parameter, or lower abundances (see for example Figures 3 and 7).
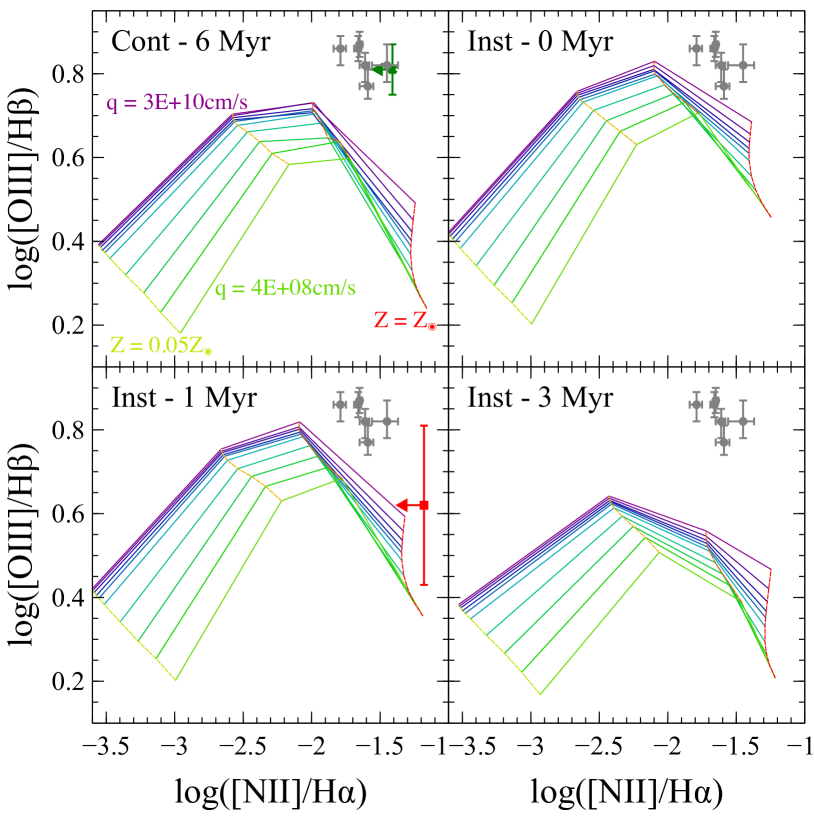
4.2. [OIII]/H
The [OIII]/H line ratio is well described for the case of low to medium ionization parameter in Levesque et al. (2010). In this case, the inferred abundance is particularly sensitive to the ionization parameter for “normal” ionization parameters and sub-solar abundances. For ionization parameters cm s-1, the [OIII]/H ratio saturates, making it a more useful diagnostic of sub-solar abundances (see for example Figures 4 and 8). At both large and small ionization parameters this ratio is double-valued with respect to abundance. Of special note, these lines are very similar in wavelength, thus the ratio will not suffer from significant reddening effects.
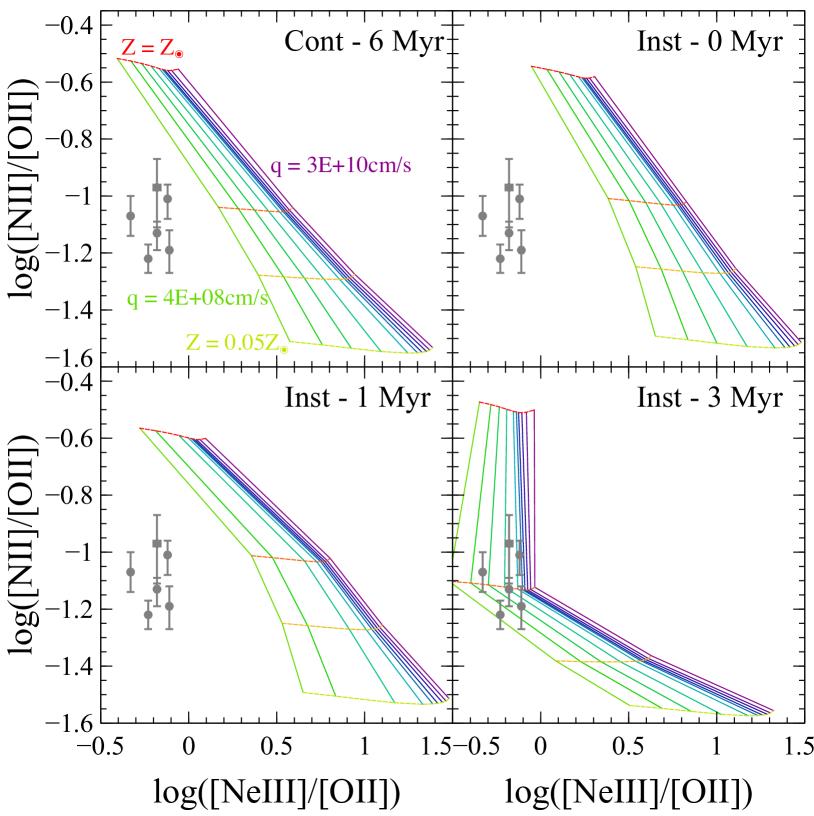
4.3.
The diagnostic, defined as log10 (Pagel et al., 1979), is described in detail in Kewley & Dopita (2002). It is commonly used as a metallicity diagnostic, although it is double-valued and dependent on the ionization parameter, thus it must be combined with another diagnostic to determine the metallicity and ionization parameter correctly (see for example 5). It is particularly useful at higher redshifts, where H, [NII] , and [SII] are too far redshifted to be easily observed.
4.4. Diagnostic Diagrams
The motive for these models was to better constrain the physical parameters of high-ionization parameter galaxies. To best accomplish this, typically two line diagnostics are compared via emission line diagnostic diagrams.
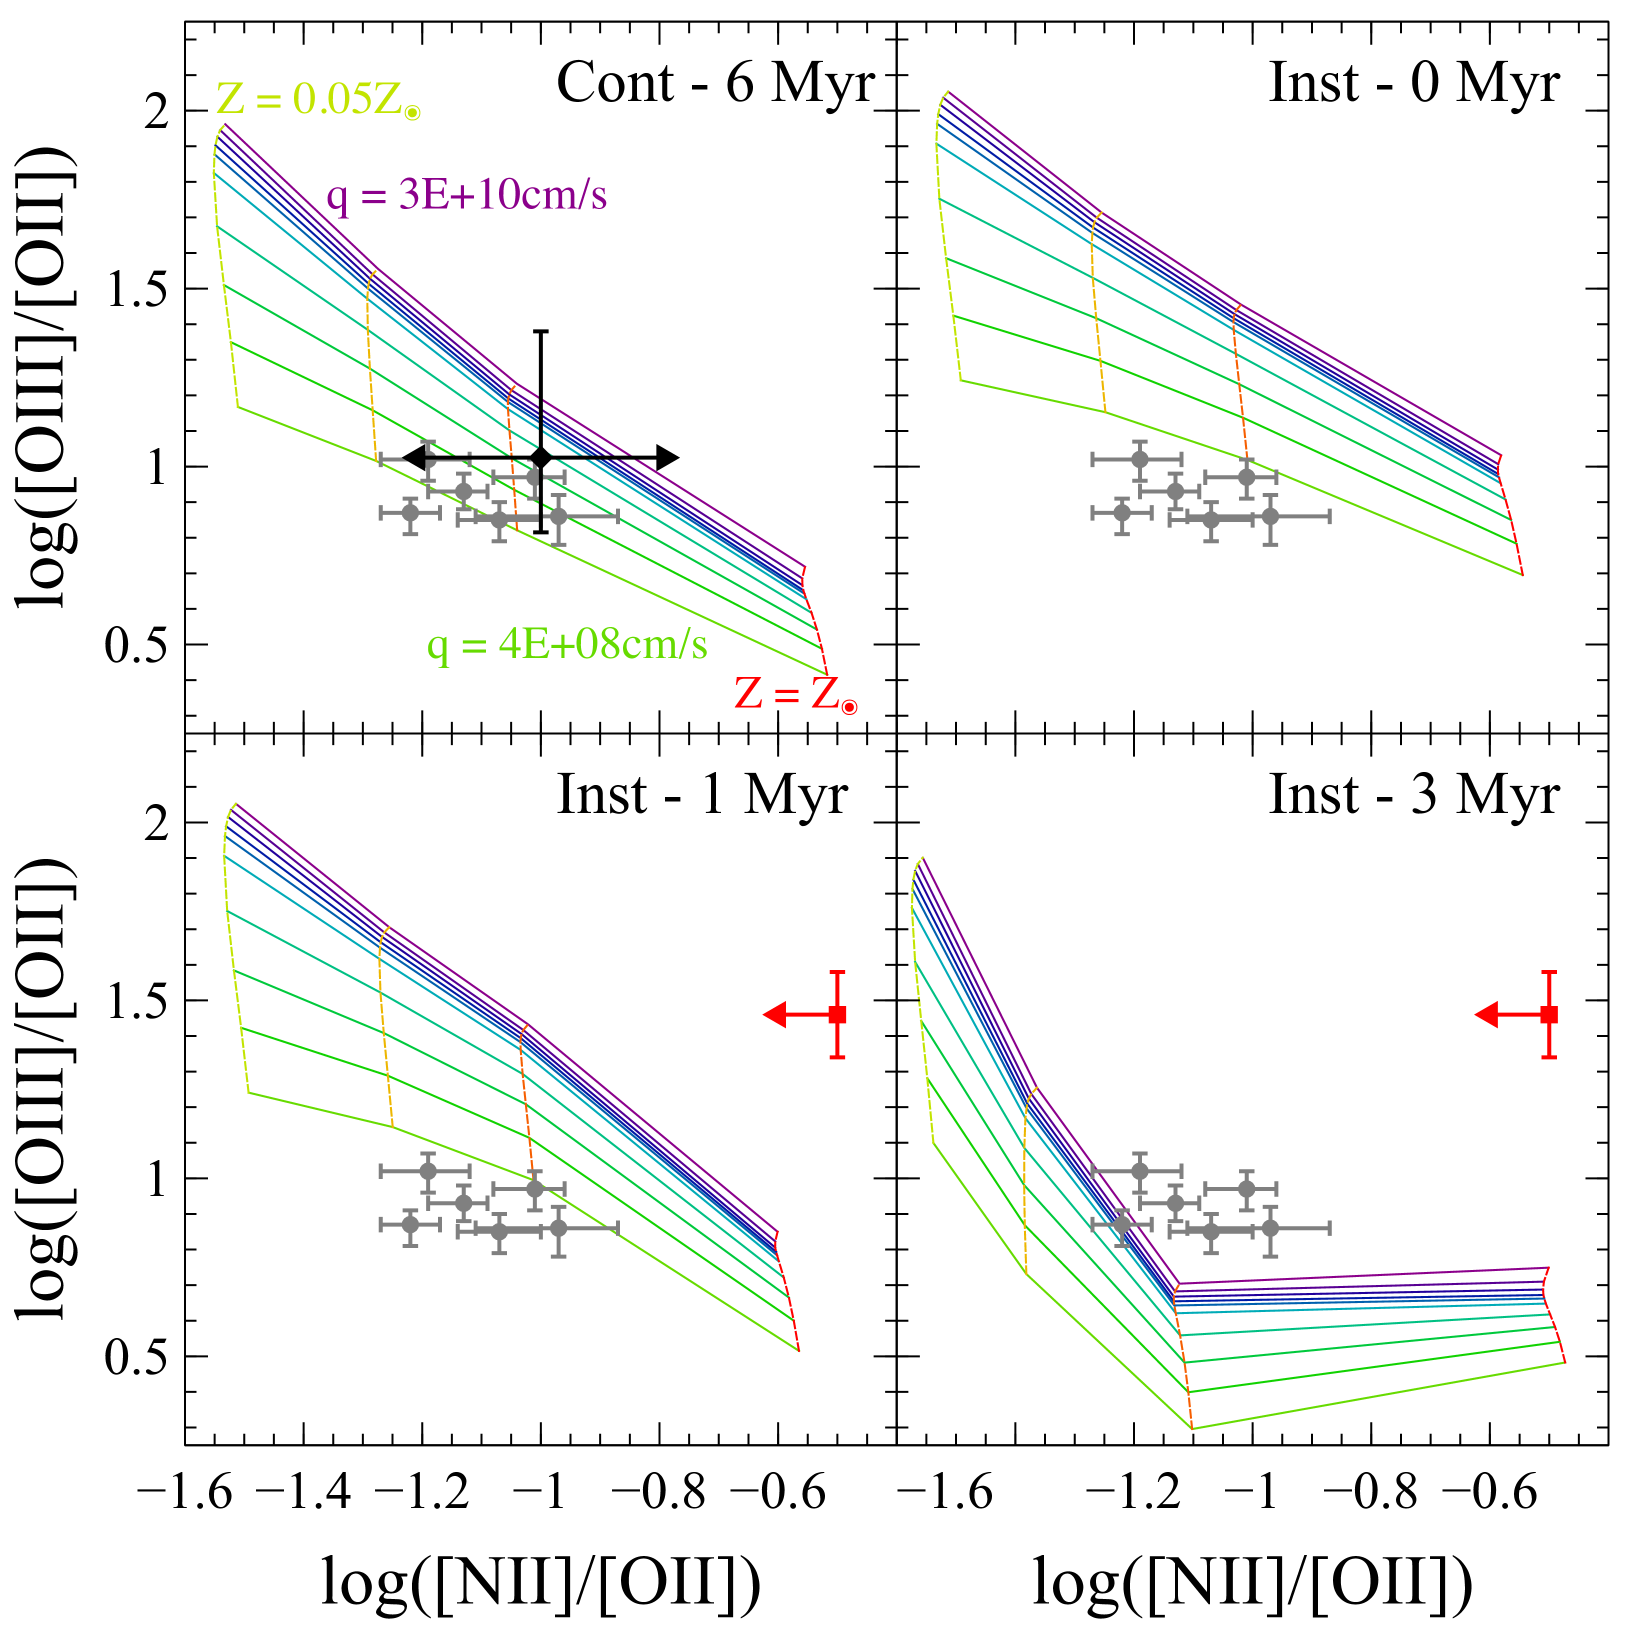
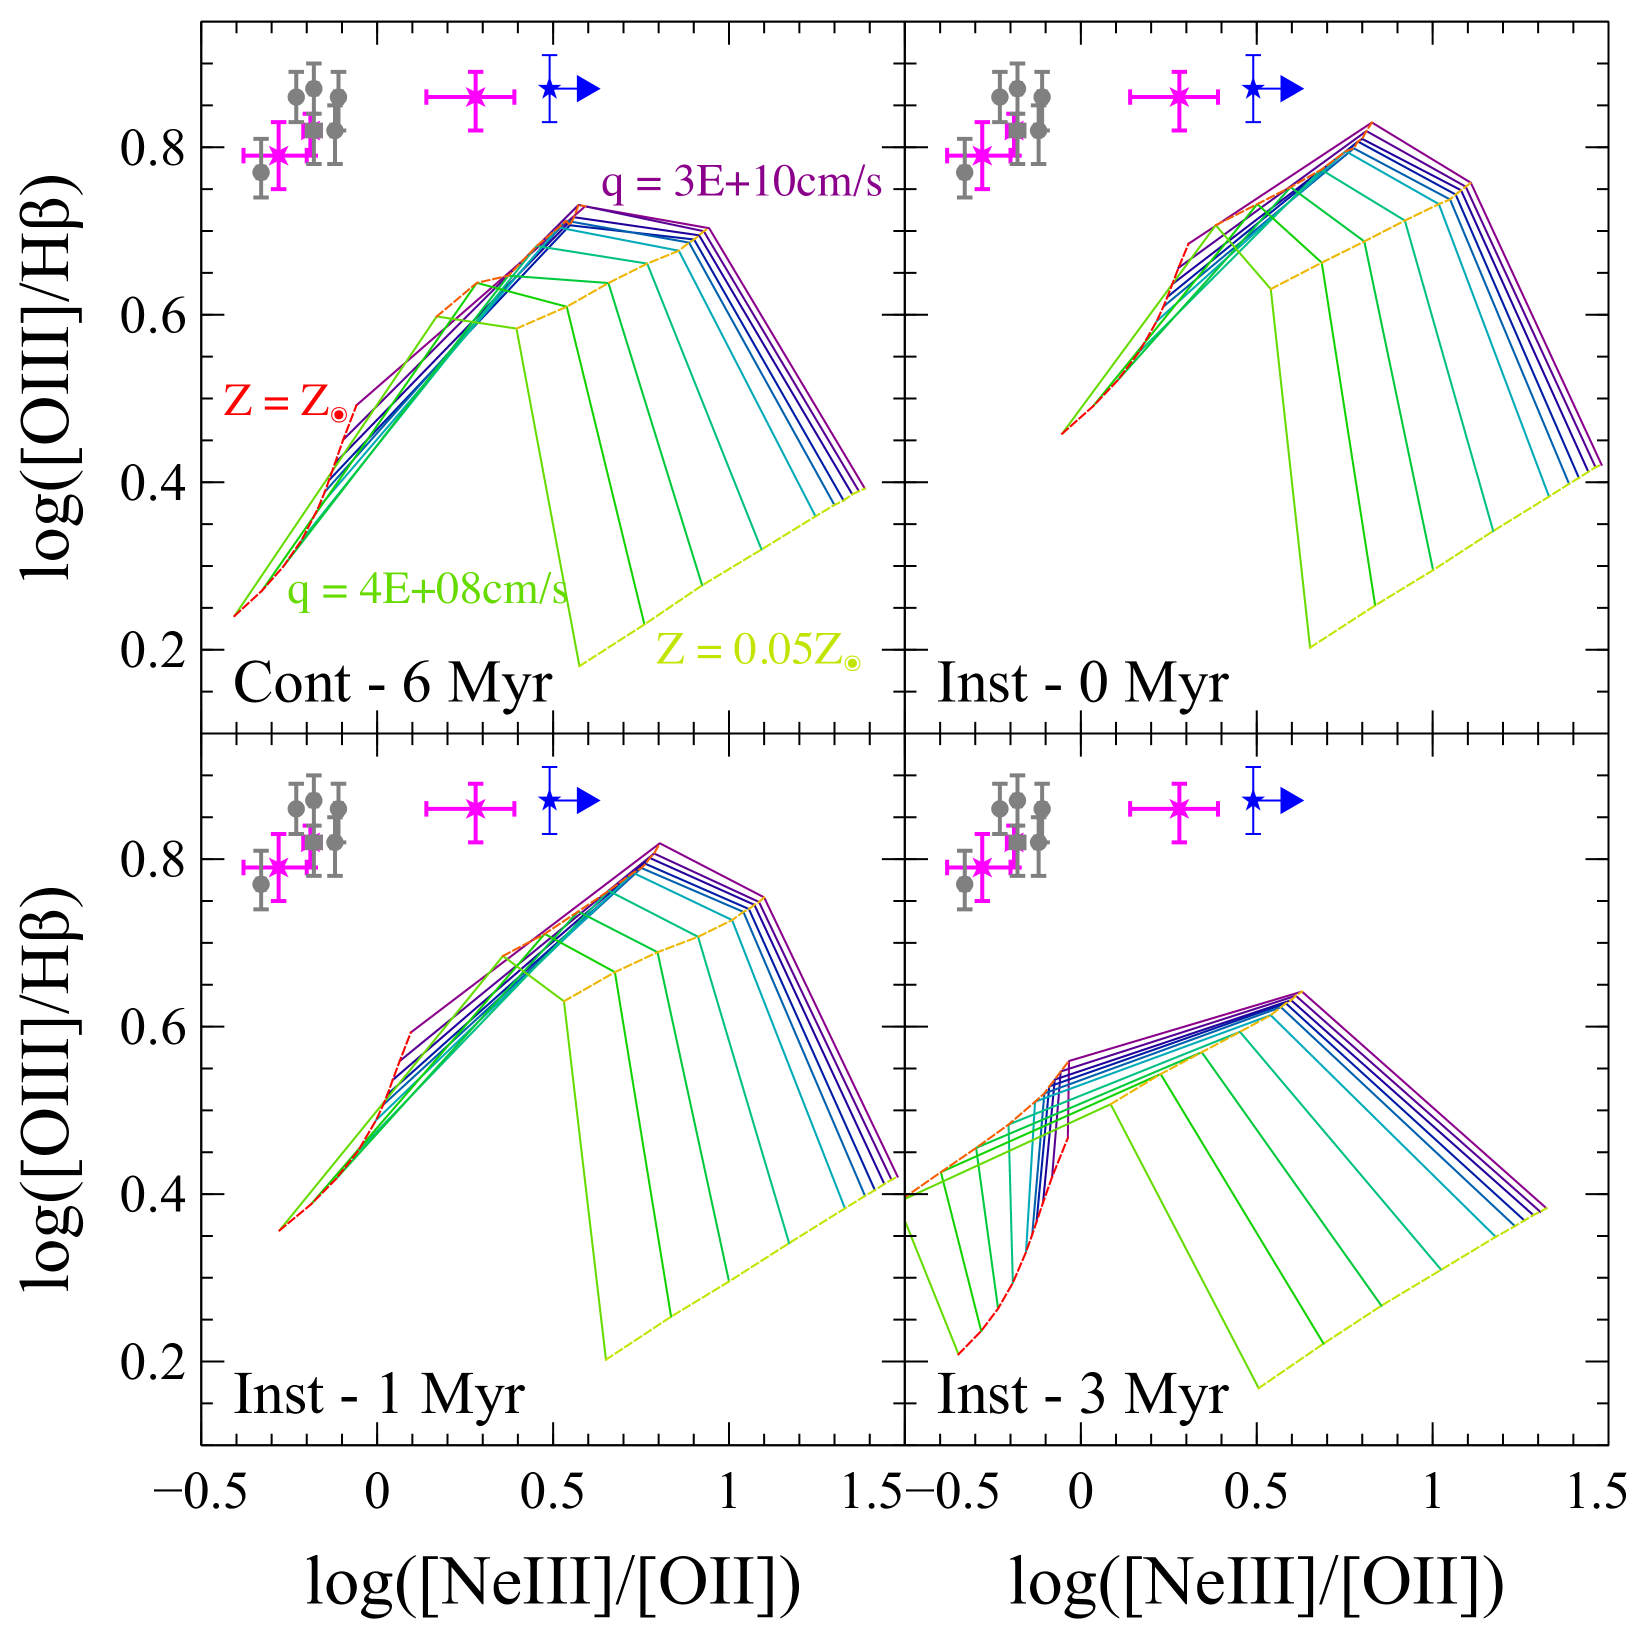
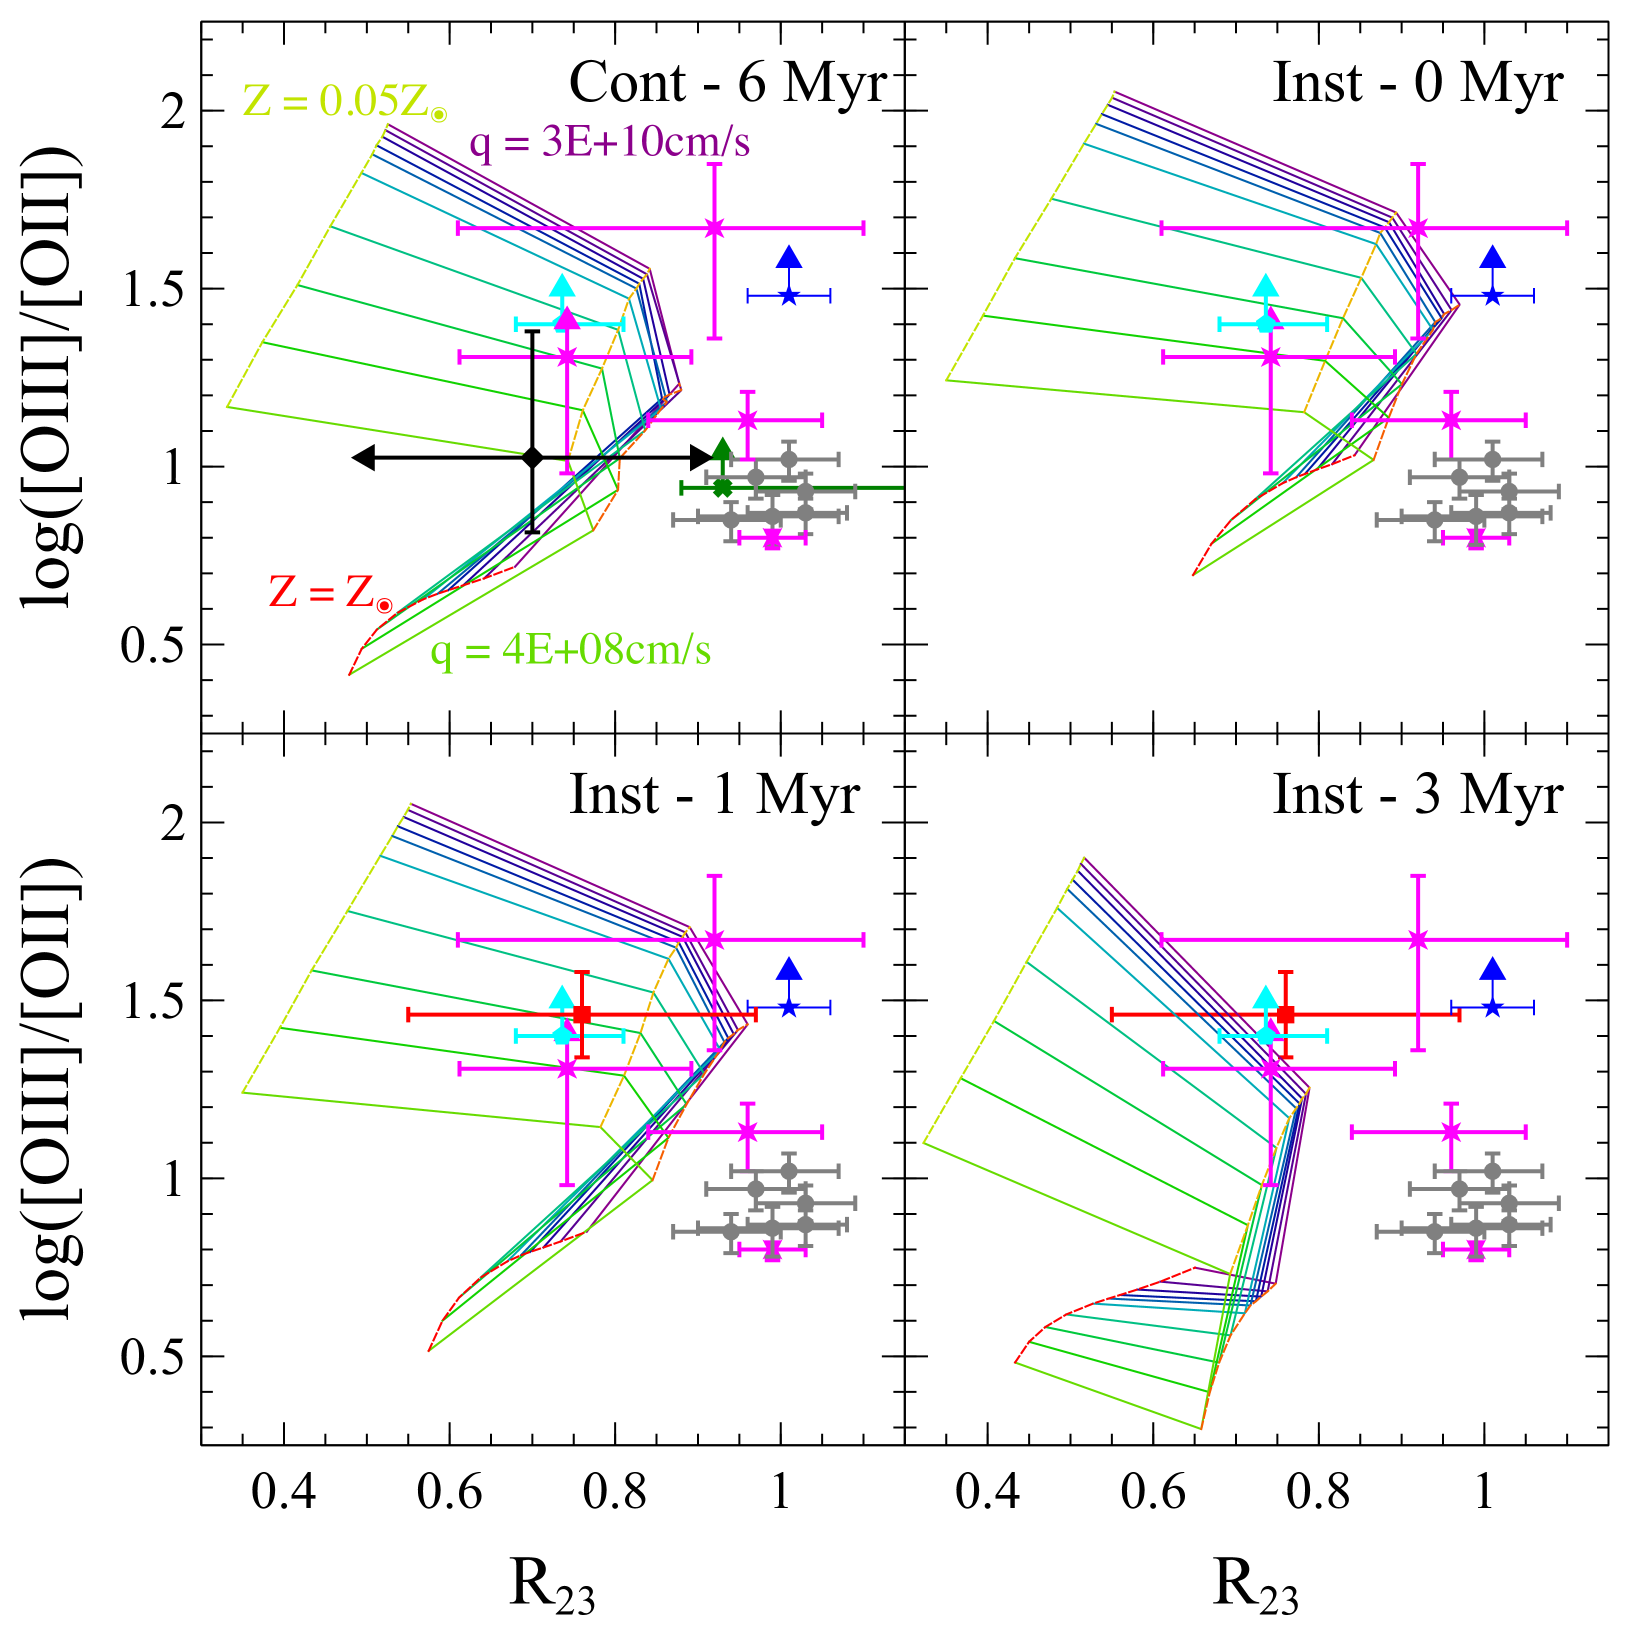
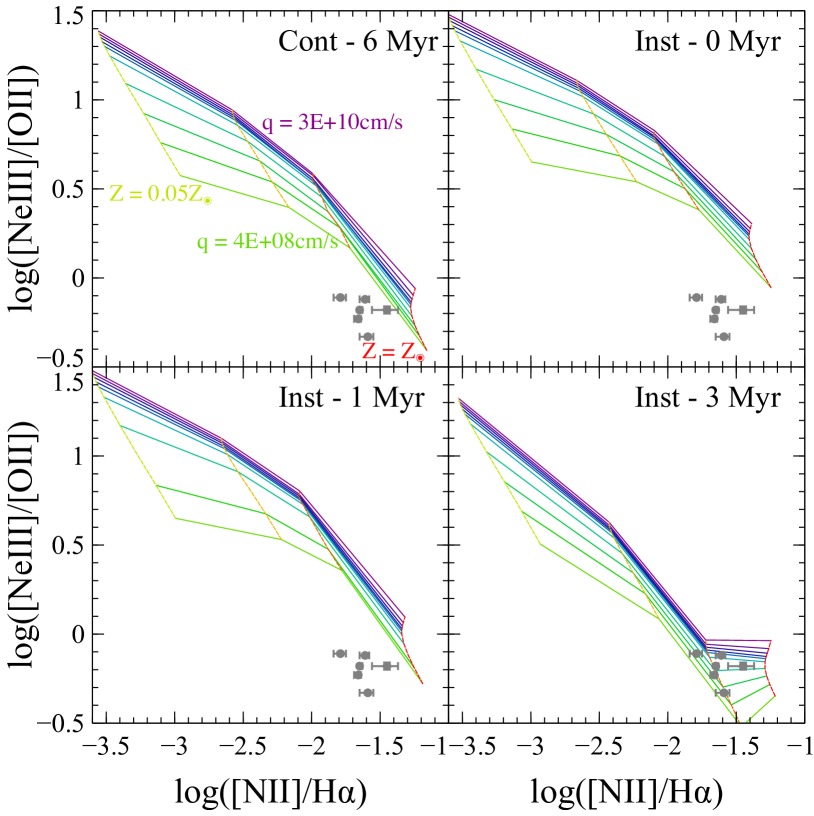
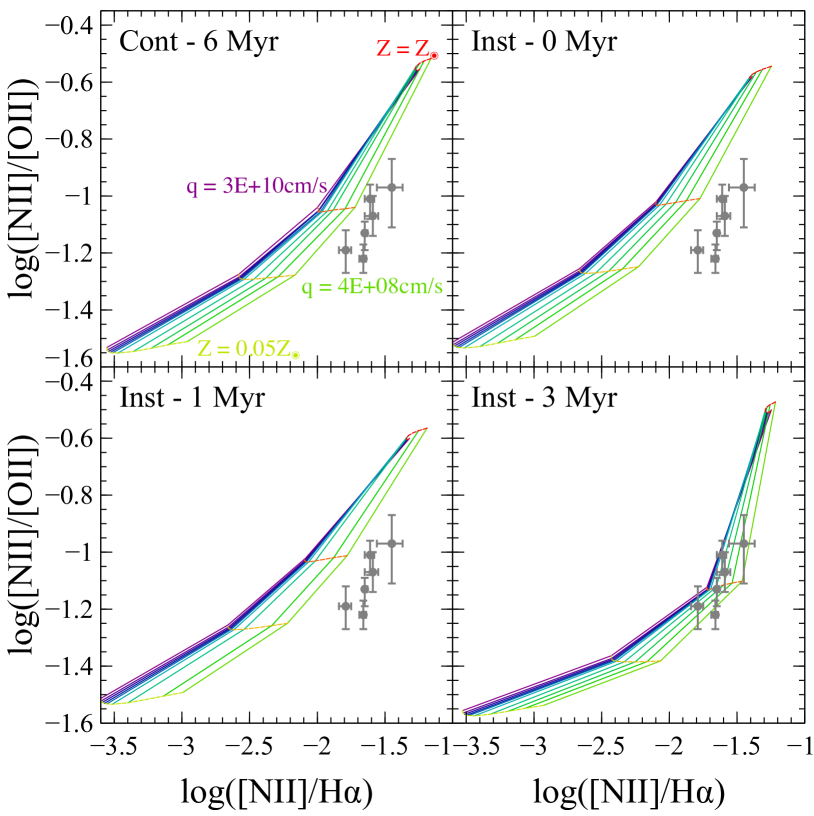
Figures 3-5 combine in multiple pairings the different line ratios discussed above. We select these pairings to highlight the line combinations observable with ground-based spectroscopy of LAE, and in particular the two LAE that we observe. Other pairings that may prove useful with future observations can be found in Appendix A. Plotted are the models with a density of 10 cm-3. In all cases the models with a density of 100 cm-3 are very similar to the 10 cm-3 models, and are omitted here for brevity444All models can be found at http://www.public.asu.edu/mlricha4/HII_Models.tgz. Dashed lines of constant metallicity and solid lines of constant ionization parameter are plotted.
Included in these figures are observations of high ionization parameter galaxies, including the observations of LAE40844 from this work. Where possible, we plot each object on the panel whose model star-formation history best matches that reported for the object in the literature. In some cases, published information on age and star formation history is not sufficiently detailed for us to do this (notably, objects from Richard et al. 2011, Xia et al. 2012, and 2013 in prep, and Jaskot & Oey 2013). In these cases, we plot the objects on all panels. It is important to note that there is significant variation of the ionization parameter and metallicity grids from one stellar age to the next. Thus it is essential to know the age a priori to determine how these models, combined with observations, constrain the physical parameters of a galaxy. Without the age constrained, it would require several emission line diagnostics to determine a self-consistent solution to age, metallicity and ionization parameter.
5. Results & Discussion
In this section we discuss how our photoionization models can be used to infer constraints on the metallicity and ionization parameter for LAE40844, LAE27878, and what further inferences can be made. How our models describe other high-ionization parameter galaxies is discussed in Appendix A. There are a few notable examples where specific combinations of line diagnostics yield model grids that are inconsistent with observations. All combinations that include [OIII]/H or R23 have the observations slightly offset from the bend in the double-valued diagnostic (e.g., Figures 4, 5, 8). We see similar offsets in the diagrams with [NeIII]/[OII]. Such inconsistencies were also observed by Levesque et al. (2010) when combining [OIII]/H with [SII]/H. Earlier models, such as Kewley et al. (2001), were even less able to predict such large line diagnostics, and predicted that including harder far-ultraviolet (FUV) photons from a more accurate modeling of stellar atmospheres would account for this discrepancy. Specifically, the deficiency in high-energy photons results in underpredicting these species’ line fluxes. Although Levesque et al. (2010) showed that their models, including the new atmospheric models of Hillier & Miller (1998) and Pauldrach et al. (2001) in Starburst99, were better able to predict large emission line diagnostic, there were still some shortcomings in the models. These same shortcomings are apparent in our work. An even better treatment of the FUV is necessary to amend these model grids. Further, our models do not take into account the rotation of stars. After a few Myr, stellar rotation has been shown to produce a harder ionizing spectrum at solar metallicities (Levesque et al., 2012), and this effect should be even more pronounced at lower metallicities. It is therefore not surprising that such an offset would be visible for line diagnostics associated with [OIII] and [NeIII], both of which span a broad range of ionizing wavelengths. While this does not diminish their efficacy as diagnostics, these offsets do effectively illustrate the need for additional improvements to the models used in developing such diagnostics.
5.1. LAE40844
Given our inability to observe H for LAE40844, we would naively think, based on earlier models of low ionization parameter galaxies, that we’d be unable to constrain either the metallicity or the ionization parameter. However, similar to the procedure in Erb et al. (2010), a comparison with the emission-line diagnostics of Levesque et al. (2010) reveals that for our sufficiently large [OIII]/[OII] ratio, LAE40844 must be either very low metallicity, or at higher ionization than they consider. From SED fitting in McLinden et al. in prep (2013) we know that LAE40844 has been undergoing near constant star formation for the last 7 million years, thus we will compare it with our continuous star formation models. Our new models reveal that at solar metallicity, even our largest ionization parameter models would not predict such a large [OIII]/[OII] ratio (e.g. Figures 3, 5, 7). Even larger ionization parameters are unlikely to make a difference as its effect asymptotes near . Note these figures give no constraint on the horizontal axis. We stress that this upper limit on oxygen abundance is entirely dependent on the knowledge of the star formation history of LAE40844, as a zero-age population from an instantaneous burst of star formation does allow for such a large [OIII]/[OII] ratio at solar abundances, while a 3 Myr population from an instantaneous burst of star formation would require even stricter upper limits on the abundance.
Assuming a metallicity above , combining our models with those of Levesque et al. (2010) requires LAE40844 to have an ionization parameter of at least to explain the observed line ratio of [OIII]/[OII]. Allowing for an even more metal-poor environment would likely allow for a lower ionization parameter. Rigby & Rieke (2004) compared multiple studies of the ionization parameter, using an average value for starburst galaxies of , and an upper limit of about . Lilly et al. (2003) observed 66 UV-luminous galaxies and found the largest log([OIII]/[OII]) ratio to be roughly 0.6. We thus conclude the LAE40844 has a larger ionization parameter than the average local starburst galaxy (Rigby & Rieke, 2004) and the high-UV galaxies of Lilly et al. (2003). From 3, we conclude that LAE40844 has a metallicity less than solar, and likely less than solar, if we assume the same maximum ionization parameter of (Rigby & Rieke, 2004). Comparisons with Maiolino et al. (2008) who fit the observed line diagnostics of the low-metallicity galaxies of Nagao et al. (2006) and the SDSS DR4 galaxies with their inferred abundances show that LAE40844 is expected to have a low metallicity, with , accounting for a spread of 0.2-0.3 dex.
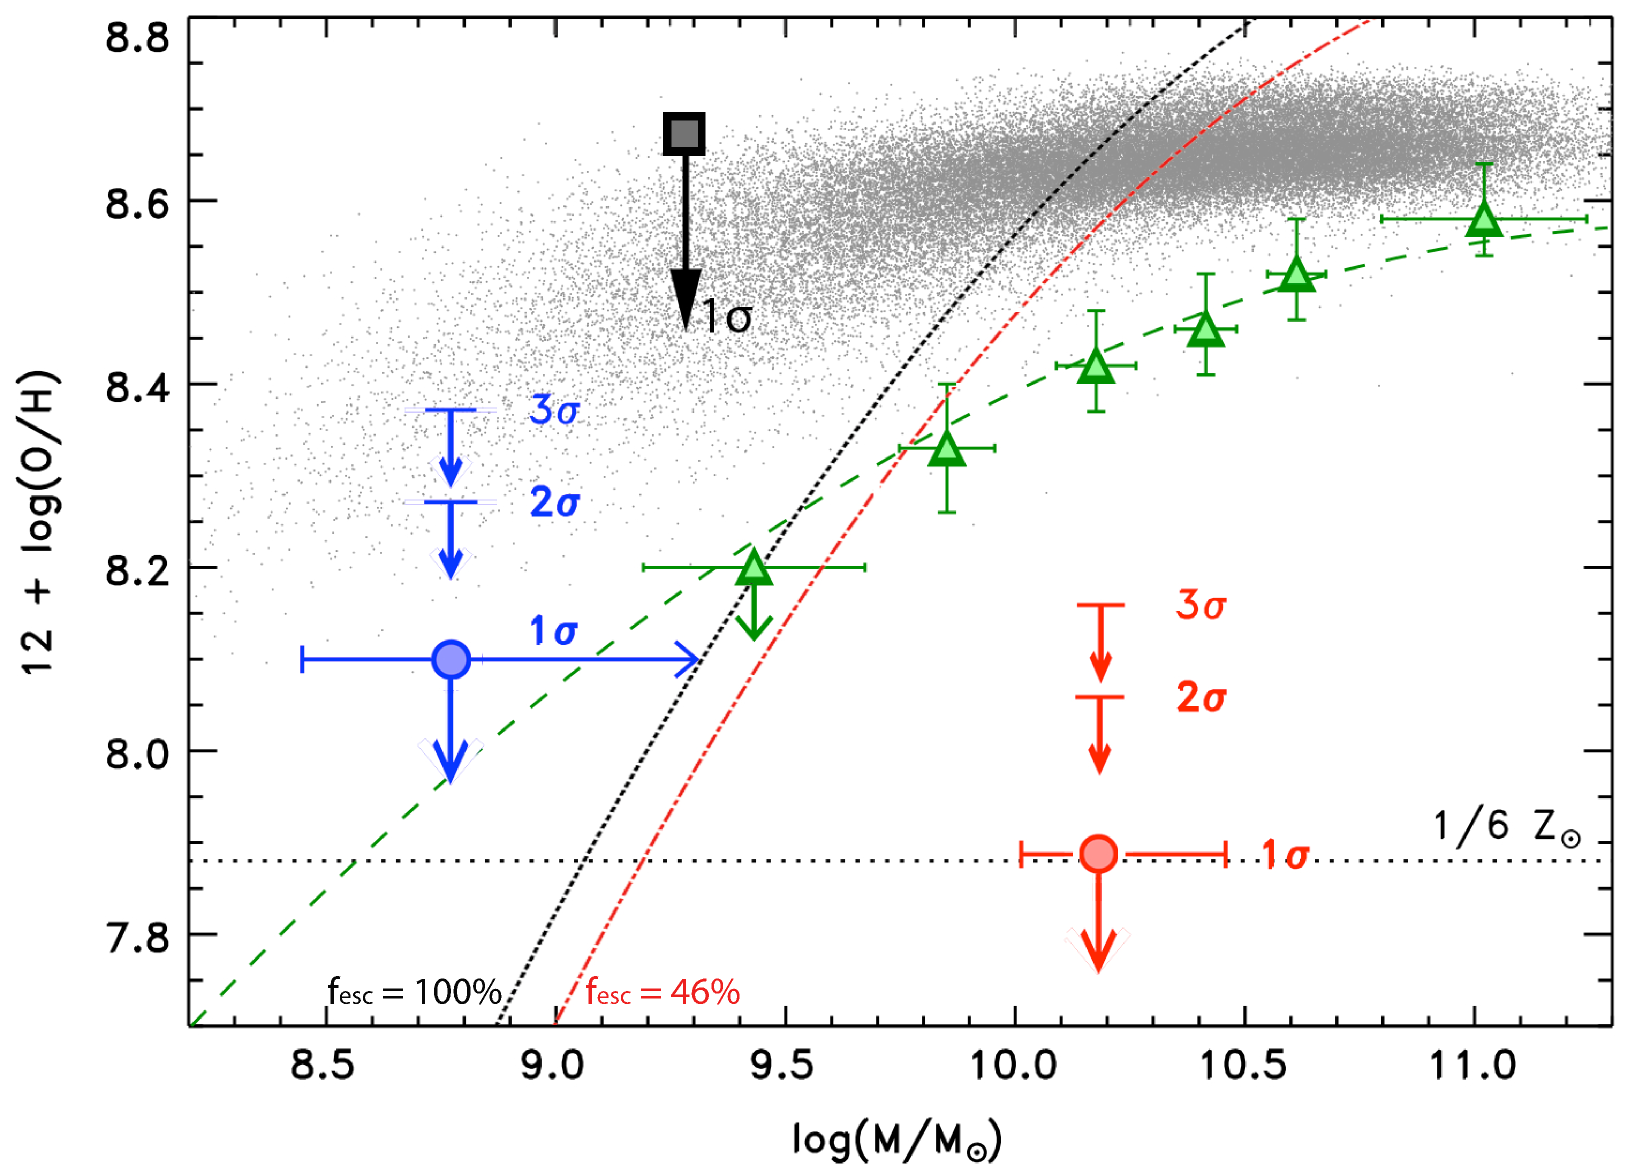
Previous work (McLinden et al. in prep. 2013) has determined the best-fit stellar mass for LAE40844 to be with 1- uncertainties. This was determined using an analysis of the mass distribution from Monte Carlo best fits of the spectral energy distribution (SED) of LAE40844. These SED fits consider 10 different filter observations, and are thus robust to mass, as it normalizes the flux across the whole spectrum. We compare the mass and metallicity constraints of LAE40844 with the mass-metallicity relation of Tremonti et al. (2004) and Erb et al. (2006). In 6, taken from Finkelstein et al. (2011), we plot LAE40844 (black square) along with the SDSS sample of Tremonti et al. (2004) (gray points), the star-forming galaxies in Erb et al. (2006) (green triangles with a fit given by a green dashed line), and the two LAEs (z=2.29 and 2.49) of Finkelstein et al. (2011) whose metallicities were constrained (red and blue circle). The metallicity constraints on LAE40844 are not surprising, given its redshift, apparent high ionization parameter, and stellar population and age, and are consistent with the fundamental metallicity relation (FMR; Mannucci et al. 2010) for galaxies, where the star-formation rate was determined following Hu et al. (1999), with . We determine the Ly line luminosity by taking the Ly line flux from McLinden et al. (2011) and given below, combined with a luminosity distance of Gpc. Using the observed Ly line flux the fundamental metallicity relation is given by the black dotted line.
We now look at the [OIII]/H diagnostic modeled in this work and of Levesque et al. (2010). As discussed before, there is a maximum value attained by [OIII]/H (e.g., 4), where at larger metallicity the gas can cool efficiently and reduce the amount of ionized oxygen, and at lower metallicity there is a lower oxygen abundance. This maximum is larger for larger ionization parameter, however its effect asymptotes above a few cm s-1. The high ionization parameter galaxies explored in this work fall in or just above this regime. Our models suggest the upper-limit on log[OIII]/H is at or around 0.8, which is consistent with observations (e.g., Fosbury et al. 2003; Jaskot & Oey 2013; Xia et al. in prep. 2013). To be conservative, we assume an upper value for log[OIII]/H to be 0.95, 2- above the largest ratio observed in all of the galaxies with large ionization parameter. Thus, given the observed [OIII] line fluxes this yields 1- lower limits on the H flux. These models suggest for LAE40844.
Assuming case B recombination, the ratio between Ly and H is 24.88, following Osterbrock (1989). Thus, bounds on H correspond to limits on the emitted, pre-escape Ly. We combine this information with the observed Ly flux (36.14 for LAE40844 from McLinden et al. 2011) to get a range of escape fractions of Ly, . This suggests that 46 % for LAE40844, consistent with the values found in Blanc et al. (2011) for 2 4 LAEs. If we consider that only 46% of the Ly line is escaping, then the fundamental metallicity relation becomes the red dash-dotted in 6.
5.2. LAE27878
Like LAE40844, LAE27878 was found to have a continuous star formation history in McLinden et al. in prep. (2013). The new models yield no further constraints on the metallicity of LAE27878, as its [OIII]/[OII] ratio implies an ionization parameter in the regime of Levesque et al. (2010). The work of Levesque et al. (2010) constrains the ionization parameter of LAE27878 to be at least . Considering the lower limits on H discussed above, we determine for LAE27878. From McLinden et al. (2011), we have a Ly flux of 9.41 suggesting an escape fractions of Ly of 74%. This is also consistent with the values found in Blanc et al. (2011) for 2 4 LAEs.
6. Conclusions
We have performed a large suite of models of photoionized regions with large ionization parameters ( and ), low metallicities ( and ), and multiple star formation histories and ages to continue the work of Levesque et al. (2010). Exploring even larger ionization parameters is likely unwarranted as its effect asymptotes at our most extreme values. These models were presented in multiple combinations of line diagnostics, then applied to our observations of LAEs. We also compare these with recent observations of high ionization parameter galaxies in Appendix A, finding metallicities and ionization parameters consistent with the original presented results. Using these models to constrain the physical parameters is aided, or in some cases made possible, by knowing the star formation history and age of the galaxy a priori, as some diagnostics can have significant variation from one age to the next.
We emphasize the use of the [OIII]/[OII] ionization parameter diagnostic with the [NII]/[OII] metallicity diagnostic as it yields unambiguously both the ionization parameter and metallicity. The [NII]/H is also a very useful replacement for [NII]/[OII] as a metallicity diagnostic since it is insensitive to reddening. Likewise, [OIII]/[OII] can be replaced by [NeIII]/[OII] as an ionization parameter diagnostic that is insensitive to reddening, and this is discussed more in Levesque & Richardson (2013).
It is important to note that, as demonstrated in multiple diagnostic figures, the model grids presented here cannot fully accommodate the observations of [OIII]/H, R23, and [NeIII]/[OII]. The synthetic ionizing spectra are too soft in the FUV, leading to insufficient line fluxes. This was previously discussed by Kewley et al. (2001) and Levesque et al. (2010); many of the models used to calibrate current star-forming galaxy diagnostics have similar shortcomings. Updates to stellar population synthesis and photoionization models should therefore lead to improved diagnostic calibrations. For example, population synthesis models that include stellar rotation produce harder ionizing spectra (Levesque et al. 2012), which in turn should lead to stronger synthetic emission line fluxes and improve the agreement between models and observations.
We have observed two Lyman- emitting galaxies that we fit using these models. We have identified line fluxes of [OIII] and [OII] and determined observational 3- upper limits on [NeIII] for one LAE, and we have identified line fluxes of [OII] and determined observational 3- upper limits on [NeIII], [OII] and H for another LAE. Future work refining the [OII], [NeIII], and H flux values will better constrain these results, as well as provide more insight into the evolution of LAE. We add to the scarce metallicity measurements of line-selected Ly galaxies with this work. Specifically:
LAE40844 was observed with a line flux of and for [OIII] 5008.240 Å and 4960.295 Å, respectively. [OII] was detected at the 2 confidence level as . 3- upper limits of were determined for [NeIII]. Together these require a metallicity of , consistent with Erb et al. (2006) and Xia et al. (2012), and either an ionization parameter, , making it more ionizing than average starbursting galaxies in the local Universe (Rigby & Rieke, 2004), or even more metal-poor, with . Upper limits on the [OIII]/H diagnostic were taken which result in an upper limit on the escape fraction of Ly photons, %, which is consistent with other LAEs in this redshift range (Blanc et al., 2011).
LAE27878 was observed with a line flux of and for [OIII] 5008.240 Å and 4960.295 Å, respectively. We have determined 3- upper limits of , , and for [OII], [NeIII], and H, respectively. Together these suggest an ionization parameter, (Levesque et al., 2010). Upper limits on the [OIII]/H diagnostic were taken which result in an upper limit on the escape fraction of Ly photons, %. Again, this constraint on escape fraction of Ly photons is consistent with (Blanc et al., 2011)
In summary, we have determined metallicity constraints for a high-redshift LAE, and find such objects to have large ionization parameters, consistent with primordial galaxies undergoing an early episode of star formation. We have also constrained the escape fraction of Ly photons, revealing the effect of dust on Ly. Together, these results are important for future surveys for progressively fainter and more distant LAEs. We urge future work to use our models and those of Levesque et al. (2010) for they consider multiple star formation histories and large ionization parameters.
The authors would like to thank the the Gemini observing facility and its staff for very useful correspondence and discussion during this work. We would like to recognize the cultural importance of Mauna Kea with the indigenous population of Hawai’i, and thank them for the opportunity to conduct observations from this mountain. This work was supported by NSF grant AST-0808165. M. L. A. R was also supported by the National Science and Engineering Research Council of Canada.
References
- Binette et al. (1985) Binette L., Dopita M. A., Tuohy I. R., 1985, ApJ, 297, 476
- Blanc et al. (2011) Blanc G. A., et al., 2011, ApJ, 736, 31
- Calzetti et al. (2000) Calzetti D., Armus L., Bohlin R. C., Kinney A. L., Koornneef J., Storchi-Bergmanm T., 2000, ApJ, 533, 682
- Cutri et al. (2003) Cutri R. M., et al., 2003, 2MASS All Sky Catalog of Point Sources (NASA/IPAC Infrared Science Archive), http://irsa.ipac.caltech.edu/applications/Gator/
- Dopita et al. (2000) Dopita M. A., Kewley L. J., Heisler C. A., Sutherland R. S., 2000, ApJ, 542, 224
- Dopita et al. (2006) Dopita M. A., et al., 2006, ApJS, 167, 177
- Erb et al. (2006) Erb D. K., Shapley A. E., Pettini M., Steidel C. C., Reddy N. A., Adelberger K. L., 2006, ApJ, 644, 813
- Erb et al. (2010) Erb D. K., Pettini M., Shapley A. E., Steidel C. C., Law D.R., Reddy N. A., 2010, ApJ, 719, 1168
- Ferland et al. (1998) Ferland G. J., Korista K. T., Verner D. A., Ferguson J. W., Kingdon J. B., Verner, E. M., 1998, PASP, 110, 761
- Ferruit et al. (1997) Ferruit P., Binette L., Sutherland R. S., Pécontal E., 1997, A&A, 322, 73
- Finkelstein et al. (2011) Finkelstein S. L., et al., 2011, ApJ, 729, 140
- Fosbury et al. (2003) Fosbury R. A. E., Villar-Martín M., Humphrey A., Lombardi M., Rosati P., Stern D., Hook R. N., Holden B. P., Stanford S. A., Squires G. K., Rauch M., Sargent W. L. W., 2003, ApJ, 596, 797
- Groves et al. (2004) Groves B., Dopita M., Sutherland R., 2004, ApJS, 153, 9
- Hillier & Miller (1998) Hillier, D. J., & Miller, D. L. 1998, ApJ, 496, 407
- Hu et al. (1999) Hu E.M., McMahon R. G., Cowie L. L., 1999, ApJ, 522, L9
- Jaskot & Oey (2013) Jaskot, A. E., & Oey, M. S. 2013, ApJ, 766, 91
- Kewley et al. (2001) Kewley L. J., Dopita M. A., Sutherland R. S., Heisler C. A., Trevena J., 2001, ApJ, 556, 121
- Kewley & Dopita (2002) Kewley L. J., Dopita M. A., 2002, ApJS, 142, 35
- Kewley et al. (2001) Kewley, L. J., Dopita, M. A., Sutherland, R. S., Heisler, C. A., & Trevena, J. 2001, ApJ, 556, 121
- Kewley et al. (2006) Kewley L. J., Groves B., Kauffmann G., Heckman T., 2006, MNRAS, 372, 961
- Kobulnicky & Kewley (2004) Kobulnicky, H. A., & Kewley, L. J. 2004, ApJ, 617, 240
- Leitherer et al. (1999) Leitherer C., et al., 1999, ApJS, 123, 3
- Levesque et al. (2010) Levesque E. M., Kewley L. J., Larson K. L., 2010, AJ, 139, 712
- Levesque et al. (2012) Levesque, E. M., Leitherer, C., Ekstrom, S., Meynet, G., & Schaerer, D. 2012, ApJ, 751, 67
- Levesque & Richardson (2013) Levesque, Emily M., & Richardson, M. L. A. 2013, submitted to ApJ
- Lilly et al. (2003) Lilly S. J., Carollo C. M., Stockton A. N., 2003, ApJ, 597, 730
- Maiolino et al. (2008) Maiolino R. et al., 2008, A&A, 488, 463
- Malhotra et al. (2012) Malhotra S., Rhoads J. E., Finkelstein S. L., Hathi N., Nilson K., McLinden E., Pirzkal N., 2012, ApJ, 750, 36
- Mannucci et al. (2010) Mannucci F., Cresci G., Maiolino R., Marconi A., Gnerucci A., 2010, MNRAS, 408, 2115
- McGaugh (1991) McGaugh, S. S., 1991, ApJ, 380, 140
- McGregor et al. (2003) McGregor P. J., et al., 2003, Proc. SPIE, 4841, 1581
- McLinden et al. (2011) McLinden E. M., et al., 2011, ApJ, 730, 136
- Nagao et al. (2006) Nagao T., Maiolino R., Marconi A., A&A, 459, 85
- Nakajima et al. (2013) Nakajima K., Ouchi M., Shimasaku K., Hashimoto T., Ono Y., Lee J. C. 2013, ApJ, 769, 3
- Osterbrock (1989) Osterbrock D. E., 1989, Astrophysics of Gaseous Nebular and Active Galactic Nuclei (Mill Valley, CA: Univ. Science Books)
- Pagel et al. (1979) Pagel B. E. J., Edmunds M. G., Blackwell D. E., Chun M. S., Smith G., 1979, MNRAS, 189, 95
- Partridge & Peebles (1967) Partridge R. B., Peebles P. J. E., 1967, ApJ, 147, 868
- Pauldrach et al. (2001) Pauldrach, A. W. A., Hoffman, T. L., & Lennon, M. 2001, A&A, 375, 161
- Pickles (1998) Pickles A. J., 1998, PASP, 110, 863
- Richard et al. (2011) Richard J., Jones T., Ellis R., Stark D. P., Livermore R., Swinbank M., MNRAS, 413, 643
- Rigby & Rieke (2004) Rigby J. R., Rieke G. H., 2004, ApJ, 606, 237
- Snijders et al. (2007) Snijders L., Kewley L. J., van der Werf P. P., 2007, ApJ, 669, 269
- Sutherland & Dopita (1993) Sutherland R. S., Dopita M. A., 1993, ApJS, 88, 253
- Tinsley (1980) Tinsley B. M., 1980, Fundam. Cosm. Phys., 5, 287
- Tremonti et al. (2004) Tremonti C. A., et al., 2004, ApJ, 613, 898
- Xia et al. (2012) Xia, L., et al., 2012, AJ, 144, 28
- Xia et al. (2013) Xia, L., Malhotra, S., Rhoads, J., Pirzkal, N. 2013, MNRAS, in prep
- Yan et al. (2005) Yan, H., Dickinson, M., Giavalisco, M., Stern, D., Eisenhardt, P. R. M, & Ferguson, H. C. 2006, ApJ, 651, 24
- Zaritsky et al. (1994) Zaritsky D., Kennicutt R. C. Jr., Huchra J. P., 1994, ApJ, 420, 87
In this appendix we discuss more of our diagnostic diagrams and how they apply to other high-ionization parameter galaxies discussed in recent literature. We compare and contrast the conclusions drawn in the original works with those of our models, and discuss possible short-comings in our models.
Appendix A Additional Line Diagnostics
A.1. [NeIII]/[OII]
The [NeIII]/[OII] line ratio is described in some detail in Nagao et al. (2006). However, they did not explore the dependence of this ratio on ionization parameter. We find that it behaves very much like the [OIII]/[OII] line ratio (see 9 in Appendix A), and is best employed as an ionization parameter diagnostic. The dependence of ionization parameter on metallicity is responsible for this relation, and is discussed in more detail in Levesque & Richardson (2013). Again, it is weakly dependent on abundance, with larger values corresponding with larger ionization parameter, or lower abundance (see for example Figures 4 and 10). Of special note, these lines are very similar in wavelength, thus the ratio will not suffer from significant reddening effects.
A.2. [NII]/H
The [NII]/H line ratio is described in detail in Levesque et al. (2010). It correlates with both metallicity and ionization parameter, and is therefore useful in combination with other diagnostics. This ratio is single-valued, with larger values corresponding with larger ionization parameter, and larger abundances (see for example Figures 7, 8, 11, and 12). Of special note, these lines are very similar in wavelength, thus the ratio will not suffer from significant reddening effects.
A.3. [NII]/[OII]
The [NII]/[OII] line ratio is described in detail in Levesque et al. (2010). Since the two lines have very similar ionization potential, their ratio is almost solely dependent on metallicity, making it an excellent abundance diagnostic. By combining this with another line diagnostic sensitive to ionization parameter, like [OIII]/[OII] or [NeIII]/[OII], one is more capable of determining both parameters, simultaneously (see for example Figures 3, 10, and 12). Note that there are inherent assumptions about how this ratio should change with metallicity. At higher metallicities (Z0.4), [NII] scales more strongly with increasing metallicity, as it is a secondary element. At lower metallicities this ratio should become more constant as both are primary nucleosynthesis elements. We also stress that this ratio will be particularly susceptible to reddening.
Appendix B Model Comparison with High Ionization Galaxies
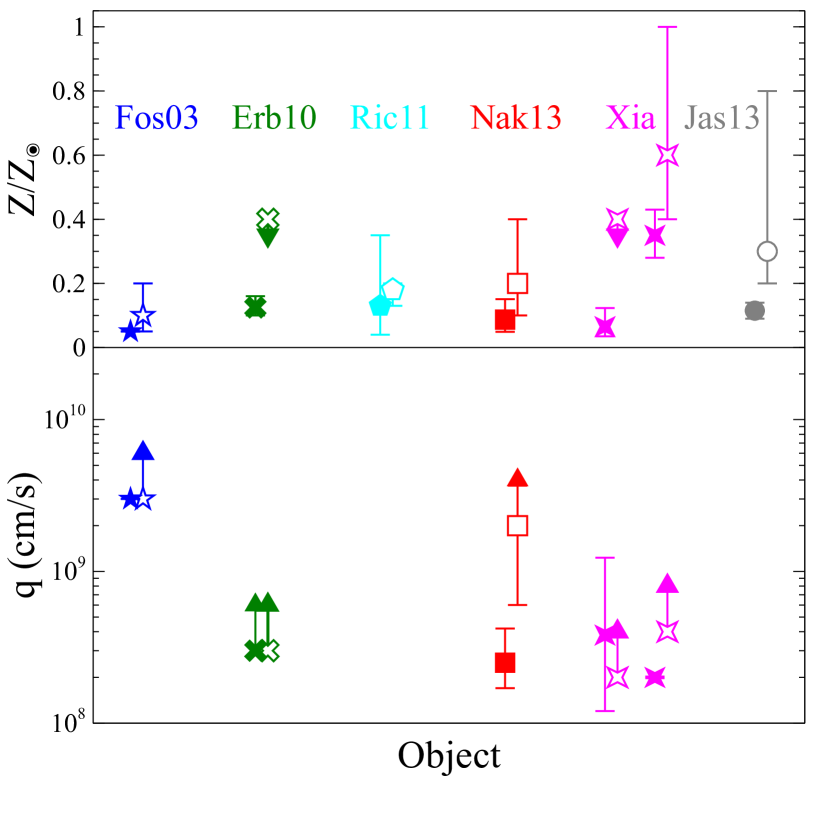
We have included observations of Fosbury et al. (2003), Erb et al. (2010), Richard et al. (2011), Xia et al. (2012) and Xia et al. in prep 2013, and Jaskot & Oey (2013) in our line diagnostic diagrams. Most of these observations include a star-forming history for each object with the exception of Xia et al. (2012) and Xia et al. in prep 2013, and Jaskot & Oey (2013). When we determine what constraints our models place on the metallicity and ionization parameter of the remaining objects, we find values that are consistent with their original work. 13 compares our constraints (empty symbols) with those in their original work (filled). An exception to the agreement is with the ionization parameter of Nakajima et al. (2013), which is only consistent to 2-. We stress however their use of work that does not consider higher ionization parameters.
We have included the objects of Xia et al. (2012) and Xia et al. in prep 2013, and Jaskot & Oey (2013) in multiple star forming histories to determine if a particular history is consistent in metallicity and ionization parameter. These objects are all emission-line selected galaxies. In general we find the [OIII]/H and R23 ratios are inconsistent with the data, suggesting that our models do not produce sufficiently hard FUV photons (see §5), thus we do not consider these diagnostics when constraining these objects. Looking at the other diagrams, we find they allow two possibilities for the Jaskot & Oey (2013) objects. Either the populations are an older instantaneous burst with near solar metallicities and large ionization parameters, or somewhat smaller metallicities with younger stellar populations and significantly lower ionization parameters. Accepting this range, our models are still consistent to 2- with the metallicities quoted in Jaskot & Oey (2013). Likewise for the objects of Xia et al., we find the population is either older, less enriched with large ionization parameters, or younger, more enriched, with lower ionization parameters. Our abundances are consistent with theirs while our the discrepancy in ionization parameter is expected as they use older work that does not consider larger ionization parameters and older ages.
In summary, we wish to stress the difficulty in determining constraints on the physical parameters of these objects without an indication of the star formation history. Figures 3-5, and 7-12 illustrate this in the variation of the grids from one star formation history to the next.