The RR Lyrae variables and Horizontal Branch of NGC 6656 (M22)
Abstract
The first calibrated broadband UBVI time-series photometry is presented for the RR Lyrae variable stars in NGC 6656 (M22), with observations spanning a range of twenty-two years. We have also redetermined the variability types and periods for the RR Lyrae stars identified previously by photographic observations, revising the number of fundamental-mode RR Lyrae variables (RR0) to 10 and the number of first-overtone variables (RR) to 16. The mean periods of the RR0 and RR variables are 0.660.02 d and 0.330.01 d, respectively, supporting an Oosterhoff II classification for the cluster. The number ratio of RR- to all RR-type variables is =0.61, also consistent with an Oosterhoff II designation. Both the RR Lyrae stars’ minimum light colors and the blue edge of the RR Lyrae instability strip suggest =0.360.02 mag toward M22. Regarding the HB morphology of M22, we find (-)/(++)=+0.970.1 and at least one “gap” located in an unusual part of the blue HB, in the middle of the so-called hot HB stars.
Subject headings:
surveys — stars: abundances, distances, Population II — Galaxy: center1. Introduction
NGC 6556 (M22) is a relatively massive galactic globular cluster (GC) with , lying inside the solar circle with (,)=(9.89,7.55) and in relatively close proximity to the Sun, = 3.2 kpc. These and other basic parameters are listed in (Harris, 1996, 2010 edition). Of note is that as far as massive GCs are concerned, M22 is not as heavily crowded as some, with a core radius of =1.33 arcmin, a central luminosity density of =3.63 (2010 edition of Harris, 1996) and a tidal radius of = 27 pc (Mackey & van den Bergh, 2005). Thus despite quite high reddening in which there is likely to be some variation, = 0.34 mag, M22 is amenable to ground-based observations.
M22 was first recognized as peculiar when it was discovered that its color-magnitude diagram (CMD) is anomalous: it has a red giant branch (RGB) with a shallower slope than would otherwise be expected based on other metallicity indicators (Butler, 1973; Hesser, 1976; Hesser et al., 1977; Hesser & Hartwick, 1979). Also, importantly, Hesser et al. (1977) found that M22 had a large color spread in the RGB, and therefore linked M22 to the prototypical peculiar GC, Cen. Since then, detailed spectroscopic investigations have shown that, like Cen, M22 shows variations in its bulk heavy-element content, including iron and elements associated with slow neutron-capture processes (-elements) (e.g., Norris & Freeman, 1983; Da Costa et al., 2009; Marino et al., 2009, 2012a).
In particular, from high resolution spectra (38 000 to 60 000) of 35 bright giant stars, Marino et al. (2011a) have shown that the stars in M22 exhibit a large range in their abundance of -elements,in particular the ratio cleanly divides the sample into two different sub-populations: an -rich stellar component and an -poor one. This was then later also seen in 101 SGB stars using medium-resolution (6400) spectra (Marino et al., 2012a). There is additionally a strong correlation between and -element abundance; the -rich stars have a systematically higher with , whereas the -poor stars are found to have (Marino et al., 2009). This is a of 0.140.03 dex. The CNO-sum distribution was also found to differ between the -rich and -poor stellar components, on the order of 0.13 dex, with the -rich one being the CNO-enhanced component (Marino et al., 2009, 2011a). Therefore, M22 is one of the few GCs showing clear evidence of a bimodality in the CNO-sum distribution (as is also seen in Cen, e.g., Marino et al., 2012b).
GCs are generally chemically homogeneous when it comes to the abundances of the iron-peak elements (Kraft & Ivans, 2003). The well-established counterexamples, such as Centauri (Freeman & Rodgers, 1975; Norris & Da Costa, 1995; Pancino et al., 2002), M54 in the Sagittarius dSph (Bellazzini et al., 2008; Carretta et al., 2010a; Saviane et al., 2012), NGC 2419 (Cohen, 2010; Mucciarelli et al., 2012), NGC 1851 (Carretta et al., 2010b), M22 (Da Costa et al., 2009; Marino et al., 2009) and Terzan 5 (Ferraro et al., 2009) may have a different origin than the other GCs. For example, they could have an extragalactic origin, such as being the remnant of a dwarf galaxy tidally disrupted by the MW. That these GCs have a peculiar origin is also suggested because they are some of the most massive GCs in the Galaxy and have different kinematics (e.g., retrograde rotation) than many “normal” GCs (Lee et al., 2007).
Photometrically, the two distinct sub-populations present in M22 have been traced along the RGB using Strömgren filters (Milone et al., 2012a), and along the SGB using optical Hubble Space Telescope (HST) filters (Piotto et al., 2012). The interpretative analysis provided by Cassisi et al. (2008) and Sbordone et al. (2011) suggests that the observed split along these evolutionary sequences can be understood as due to the bimodality in the CNO-sum and the observed light-element anti-correlations, respectively, the latter now understood to be a ubiquitous feature of GCs (Carretta et al., 2009a, b)
The spectroscopic study of multiple populations in Galactic GCs has recently been extended to the HB, e.g., M4, Marino et al. (2011b); NGC 1851, Gratton et al. (2012); NGC 2808, Gratton et al. (2011) and 47 Tuc, Milone et al. (2012b), Gratton et al. (2013). On the basis of these measurements a scenario is emerging in which Na-poor/O-rich stars, the first generation progeny, are located in the red portion of the HB, whereas Na-rich/O-poor stars, the stars belonging to the second generation, are distributed along the blue portion of the HB. Since the presence of a Na-O anticorrelation has to be accompanied by (at least a moderate) helium enhancement, and He-rich stars are expected on theoretical grounds to populate the bluest portion of the HB distribution, these empirical findings provide plain evidence that the HB morphology is greatly affected by the multiple-population phenomenon. In the case of NGC 1851, spectroscopy supplemented with an accurate analysis of both the HB morphology and the pulsation properties of RR Lyrae stars (Kunder et al., 2013a) has been used to shed more light on the detailed distribution of the various sub-populations along the HB of this peculiar GC. Very recently, the first spectroscopic tracing of sub-populations along the HB of M22 has been carried out by Marino, Milone & Lind (2013), finding that all the (seven) red HB stars (including 3 RR Lyrae variables) analyzed are barium-poor and sodium-poor and belong to the first generation of stars.
In this paper we present new UBVI photometry of M22, based on original and archival observations, which has allowed a more detailed study of the RR Lyrae instability strip than has previously been possible, including the discovery of additional RR Lyrae stars and the first calibrated light curves of the complete M22 RR Lyrae variable sample. We will use these data to seek evidence of the metallicity and generational dichotomies described above among the RRL in M22.
2. Observations
The observations come from co-author Peter B. Stetson’s (PBS) data archive and the details are given in Table 1. The last column in the table with the heading “Multiplex” refers to the number of individual CCDs in the camera used for the observing run. Standard DAOPHOT/ALLFRAME procedures (Stetson, 1987, 1990, 1994) were used to perform profile-fitting photometry with aperture growth-curve corrections. The calibration of the instrumental data is to the Johnson/Kron-Cousins photometric system defined by (Landolt, 1992), and was carried out as described by Stetson (2000, 2005). The observations are contained within 61 datasets, where a dataset is either the complete body of data from one CCD on one photometric night or the body of data from one CCD on one or more non-photometric nights during the same observing run. Therefore the number of datasets and the number of images will be different, as datasets, individually calibrated to the Landolt system, may be broken up to compensate for e.g., changing weather conditions. Of the 61 datasets, 35 are considered photometric, and the remaining 26 are considered non-photometric. The 35 photometric datasets are used to set up local standards in the field of M22, using nightly calibration equations that include linear and quadratic color terms as well as linear extinction terms; a color-extinction term is also employed for the filter. These local standards are then used to determine the photometric zero points of individual CCD images obtained on non-photometric nights.
The maximum number of calibrated magnitude measurements for any one star is 24 in , 154 in , 206 in , and 44 in . There was one photometric night in which -band data was obtained, but we consider that insufficient for a reliable photometric calibration, and a discussion of M22 -band photometry is not presented here. However, the -band images were included in the ALLFRAME reductions to aid in the completeness and astrometric precision of the catalog. Our final catalog includes 620,730 objects with photometric measurements and spans a field roughly 38.5 arcminutes east-west by 49.2 arcminutes north-south. There are 525,585 objects with “useful” measurements (arbitrarily defined as (magnitude) 0.10 mag) in , , and ; 55,910 of these also have useful (same definition) photometry in . There are a further 96,857 objects with astrometric information only (46.8 by 49.2 arcminutes).
The astrometry is carried out as in Kunder et al. (2013b), tied to the U.S. Naval Observatory (USNO) A2.0 Astrometric Reference Catalog. Therefore we believe our positions are on the USNO-A2.0 system with an accuracy well within 0′′.1, and are internally precise to better than 0′′.03.
| Run ID | Dates | Telescope/Camera/Detector | Multiplex | |||||
|---|---|---|---|---|---|---|---|---|
| 1 bond21 | 1991 Sep 23 | CTIO 0.9m 772 | – | 2 | 2 | – | – | |
| 2 emmi5 | 1993 Jul 17–18 | ESO NTT 3.6m EMMI | – | 20 | 21 | – | – | |
| 3 apr97 | 1997 Apr 16 | ESO Dutch 0.9m Tektronix | – | – | 8 | – | 8 | |
| 4 bond6 | 1998 Apr 22 | CTIO 0.8m Tek2K_3 | 1 | 1 | 1 | – | 1 | |
| 5 dmd | 1998 Jun 25 | JKT 1.0m TEK4 | – | – | 2 | – | 3 | |
| 6 wfi9 | 1999 May 15 | ESO/MPI 2.2m WFI | – | 4 | 3 | – | 3 | 8 |
| 7 wfi12 | 1999 Jul 12 | ESO/MPI 2.2m WFI | – | 1 | 4 | – | 2 | 8 |
| 8 wfi10 | 2000 Jul 07 | ESO/MPI 2.2m WFI | – | 4 | 4 | – | 3 | 8 |
| 9 ct36aug00 | 2000 Aug 30–31 | CTIO 0.9m Tek2K_3 | – | 78 | 78 | – | – | |
| 10 wfi5 | 2002 Jun 18 | ESO/MPI 2.2m WFI | – | 6 | 6 | – | 6 | 8 |
| 11 susi03may | 2003 May 31 | ESO NTT 3.6m SUSI | 8 | – | 8 | – | – | 2 |
| 12 wfi26 | 2004 Jun 26 | ESO/MPI 2.2m WFI | – | 4 | 6 | – | – | 8 |
| 13 fors20605 | 2006 May 29 | ESO VLT 8.0m FORS2 | – | – | 3 | 5 | 3 | 2 |
| 14 fors0707 | 2007 Jul 03–05 | ESO VLT 8.0m FORS1 | 1 | – | 38 | – | – | 2 |
| 15 efosc09 | 2009 Apr 20–29 | ESO NTT 3.6m EFOSC LORAL | 16 | 69 | 10 | 3 | – | |
| 16 ct12aug | 2012 Aug 19–21 | CTIO 0.9m Tek2K_3 | 20 | 15 | 45 | – | 15 |
Notes:
1 Observer H. E. Bond
2 Observers “SAV/ZAGGIA”
3 Observer A. Rosenberg?
4 Observer H. E. Bond
5 Observer “DMD”
6 Program identification 163.O-0741(C)
7 Program identification unknown, observer unknown
8 Program identification 065.L-0463, observer Ferraro
9 Observers A. Walker & D. Walker
10 Program identification 69.D-0582(A)
11 Program identification 71.D-0175(A)
12 Program identification 073.D-0188(A)
13 Program identification 077.D-0775(A)
14 Program identification 079.D-0893(A)
15 Program identification 083.D-0544(A)
16 Proposal ID 2012B-0178, observers A. Kunder, L. Paredes Alvarez
| Name | R.A. (J2000.0) | Decl. (J2000.0) | Period (d) | Type | (’) | Separation Index | Comment | ||||||||
| V1 | 18 36 19.55 | 23 54 32.7 | 0.615541 | 15.15 | 15.00 | 14.27 | 13.26 | 1.35 | 1.48 | 1.15 | 0.69 | RR0 | 1.1 | 5.9 | period increasing? |
| V2 | 18 36 34.90 | 23 53 06.3 | 0.641718 | 14.81 | 14.79 | 14.10 | 13.19 | 1.16 | 1.21 | 0.93 | 0.57 | RR0 | 3.0 | 5.5 | |
| V3 | 18 36 37.99 | 23 47 14.9 | 0.539559: | – | 16.49 | 15.64 | 14.69 | – | – | – | – | RR0 | 7.1 | a | |
| V4 | 18 36 23.35 | 23 55 29.1 | 0.716393 | 15.09 | 14.94 | 14.17 | 13.15 | 1.02 | 0.98 | 0.80 | 0.52 | RR0 | 1.2 | 4.8 | |
| V6 | 18 36 18.24 | 23 56 03.4 | 0.638486 | 14.91 | 14.80 | 14.10 | 13.14 | 1.35 | 1.37 | 1.10 | 0.70 | RR0 | 2.3 | 6.3 | b |
| V7 | 18 35 57.60 | 23 47 40.5 | 0.649523 | 14.94 | 14.81 | 14.10 | 13.20 | 1.19 | 1.44 | 1.26 | 0.70 | RR0 | 9.3 | 10.7 | |
| V10 | 18 36 20.92 | 23 56 27.1 | 0.646028 | 14.93 | 14.82 | 14.13 | 13.16 | 1.05 | 1.41 | 1.15 | 0.64 | RR0 | 2.3 | 6.1 | |
| V12 | 18 36 23.75 | 23 55 38.8 | 0.322622 | 15.00 | 14.78 | 14.19 | 13.38 | 0.61 | 0.57 | 0.44 | 0.27 | RR | 1.4 | 5.6 | |
| V13 | 18 36 28.64 | 23 51 39.5 | 0.672530 | 14.87 | 14.74 | 14.06 | 13.14 | 1.10 | 1.36 | 1.08 | 0.65 | RR0 | 2.9 | 6.5 | |
| V15 | 18 36 32.07 | 23 55 40.6 | 0.370922 | 14.98 | 14.84 | 14.21 | 13.34 | 0.49 | 0.56 | 0.41 | 0.23 | RR | 2.5 | 6.2 | |
| V16 | 18 36 36.97 | 23 54 33.2 | 0.325293 | 15.06 | 14.80 | 14.24 | 13.44 | 0.49 | 0.54 | 0.44 | 0.24 | RR | 3.3 | 5.6 | |
| V18 | 18 36 16.14 | 23 47 14.9 | 0.321059 | – | 14.65 | 14.11 | 13.35 | – | 0.57 | 0.46 | 0.30: | RR | 7.3 | 10.3 | |
| V19 | 18 36 20.58 | 23 52 17.2 | 0.383621 | 15.06 | 14.75 | 14.19 | 13.33 | 0.55 | 0.58 | 0.46 | 0.35 | RR | 2.2 | 7.0 | |
| V20 | 18 36 14.79 | 23 56 32.9 | 0.756134 | 14.98 | 14.84 | 14.10 | 13.09 | 0.80 | 0.93 | 0.70 | 0.43 | RR0 | 3.2 | 6.1 | |
| V21 | 18 36 25.74 | 23 52 57.9 | 0.327134 | 14.73 | 14.64 | 14.07 | 13.30 | 0.42 | 0.54 | 0.40 | 0.23 | RR | 1.4 | 5.2 | |
| V22* | 18 35 03.8 | 23 50 58.2 | 0.6245374 | – | – | 13.17 | – | – | – | 0.41 | – | field RR0 | 20.3 | V3853 Sgr | |
| V23 | 18 36 23.01 | 23 54 41.4 | 0.581019: | 15.36 | 14.93 | 14.28 | 13.32 | 1.25 | 1.37 | 1.02 | 0.62 | RR0 | 0.5 | 5.2 | |
| V24 | 18 36 24.04 | 23 54 29.4 | – | 14.1 | 13.1 | 11.3 | 9.3 | – | – | – | – | NV | 0.4 | not a variable | |
| V25 | 18 36 46.29 | 23 48 02.2 | 0.399985 | 15.02 | 14.83 | 14.18 | 13.30 | 0.47 | 0.62 | 0.46 | 0.31 | RR | 8.4 | 9.5 | Blazhko? |
| V27* | 18 35 28.92 | 23 45 25.3 | 0.34278 | – | – | 13.33 | – | – | – | 0.32 | – | field RR | 16.4 | V2592 Sgr | |
| V29 | 18 36 30.85 | 23 41 03.2 | 0.471584 | – | 14.79 | 14.21 | 13.37 | – | 0.45 | 0.36 | – | field RR | 13.3 | NSV 11080 | |
| KT-12 | 18 36 30.93 | 23 53 48.8 | 0.443610 | – | 17.28 | 16.56 | 15.59 | – | 1.18 | 0.93 | 0.50 | RR0 | 1.8 | bulge star | |
| KT-14 | 18 36 30.67 | 23 53 53.8 | 0.371984 | 14.85 | 14.69 | 14.07 | 13.25 | 0.39 | 0.35 | 0.30 | 0.18 | RR | 1.7 | 4.3 | Blazhko? blending? |
| KT-16 | 18 36 30.36 | 23 57 12.9 | 0.2819 | 14.95 | 14.71 | 14.17 | 13.45 | 0.07 | 0.11 | 0.07 | 0.05 | RR | 3.3 | 6.6 | |
| KT-26 | 18 36 23.15 | 23 53 23.3 | 0.370960 | 15.00 | 14.74 | 14.12 | 13.29 | 0.17 | 0.32 | 0.17 | 0.14 | RR | 0.9 | 2.1 | |
| KT-36 | 18 36 15.88 | 23 56 06.9 | 0.315182 | 14.99 | 14.75 | 14.17 | 13.41 | 0.36 | 0.46 | 0.37 | 0.22 | RR | 2.7 | 7.2 | |
| KT-37 | 18 36 13.17 | 23 53 46.8 | 0.296058 | 14.94 | 14.72 | 14.16 | 13.42 | 0.14 | 0.17 | 0.13 | 0.07 | RR | 2.7 | 6.2 | |
| KT-55 | 18 36 23.23 | 23 53 57.9 | 0.658735 | 15.07 | 14.85 | 14.14 | 13.17 | 0.86 | 1.3 | 0.75 | 0.4: | RR0 | 0.4 | 4.1 | Blazhko? |
| NV1 | 18 35 59.11 | 23 57 13.1 | 0.305811 | 14.92 | 14.66 | 14.14 | 13.41 | 0.24 | 0.28 | 0.22 | 0.11 | RR | 6.9 | 8.7 | |
| NV2 | 18 36 02.96 | 23 50 29.4 | 0.332917: | 99.99 | 14.83 | 14.23 | 13.45 | 9.99 | 0.25 | 0.16 | 0.15: | RR | 6.5 | 3.1 | period uncertain |
| NV3 | 18 36 29.52 | 24 01 32.6 | 0.334020 | 99.99 | 14.58 | 14.05 | 13.38 | 9.99 | 0.48 | 0.40 | – | RR | 7.4 | 5.4 | |
| NV4 | 18 36 31.67 | 23 49 30.3 | 0.287082 | 15.08 | 14.72 | 14.18 | 13.42 | 0.35 | 0.16 | 0.11 | 0.08 | RR | 5.2 | 8.5 |
* insufficient observations (star is outside field of view), data presented here are taken from the ASAS survey Pojmański (2000)
a inadequate phase coverage, too faint to be cluster RRL
b some light curve instability seen, e.g., phase jumps
3. Results
3.1. RR Lyrae variables
The first variable stars (V1-16) in M22 were discovered more than a century ago by Bailey (1902). Gradually additional variables were discovered: V17 in Shapley (1927), V18-25 by Sawyer (1944) and V26-31 by Hoffleit (1972). Wehlau & Sawyer Hogg (1977) published the discovery of V32 and V33, Lloyd Evans (1978) published the discovery of V34 and V35, and Kravtsov et al. (1994) identified V36-43, although the membership of these variables is uncertain. Finally the first results from CCD observations were presented by Kaluzny & Thompson (2001) resulting in 36 new variables. They were not able to determine periods for the seven RR Lyrae variables they detected, and provide approximate and calibration of their photometry. Pietrukowicz & Kaluzny (2003) identified eight more variables and both Anderson et al. (2003) and Pietrukowicz et al. (2005) announced one new variable. This brings the number of M22 variables to ninety, of which twenty-seven are RR Lyrae variables.
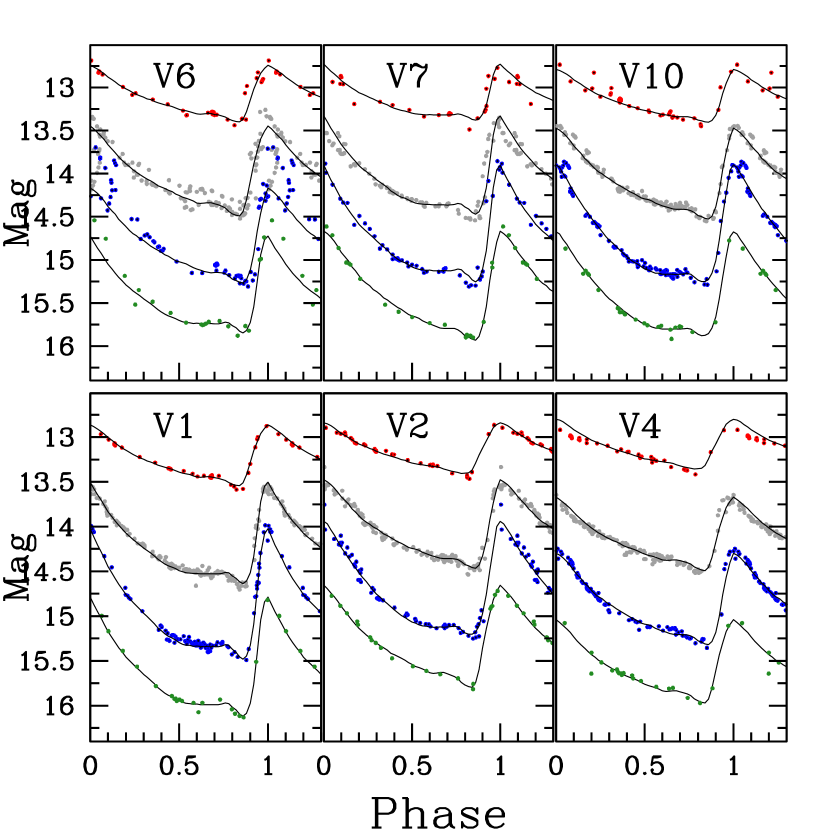
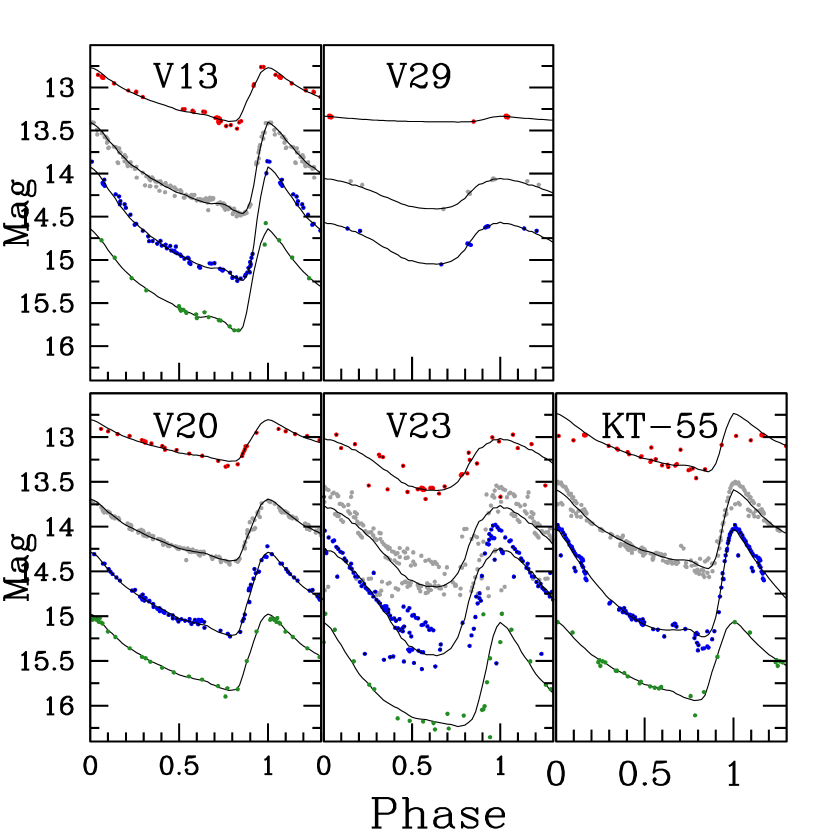
The sample of RR Lyrae stars in and around M22 is presented in Table 2. We estimate that the astrometry presented is accurate to better than 0.1 arcseconds and the photometry is accurate to 0.01 mag. The columns contain (1) the name of the variable as given in the 2011 update of M22 in the Clement et al. (2001) catalog, (2) the right ascension in hours, minutes and seconds (epoch J2000), (3) the declination in degrees, arcminutes and arcseconds, (4) the period in days, (5-8) the magnitude-weighted mean , , , and , respectively, (9-12) the -, -, - and -amplitude, respectively, (13) the type of variable, (14) the projected radius (in arcmin) from the star to cluster center (), (15) the separation index (as defined in Stetson, Bruntt & Grundahl 2003) and (16) any comments.
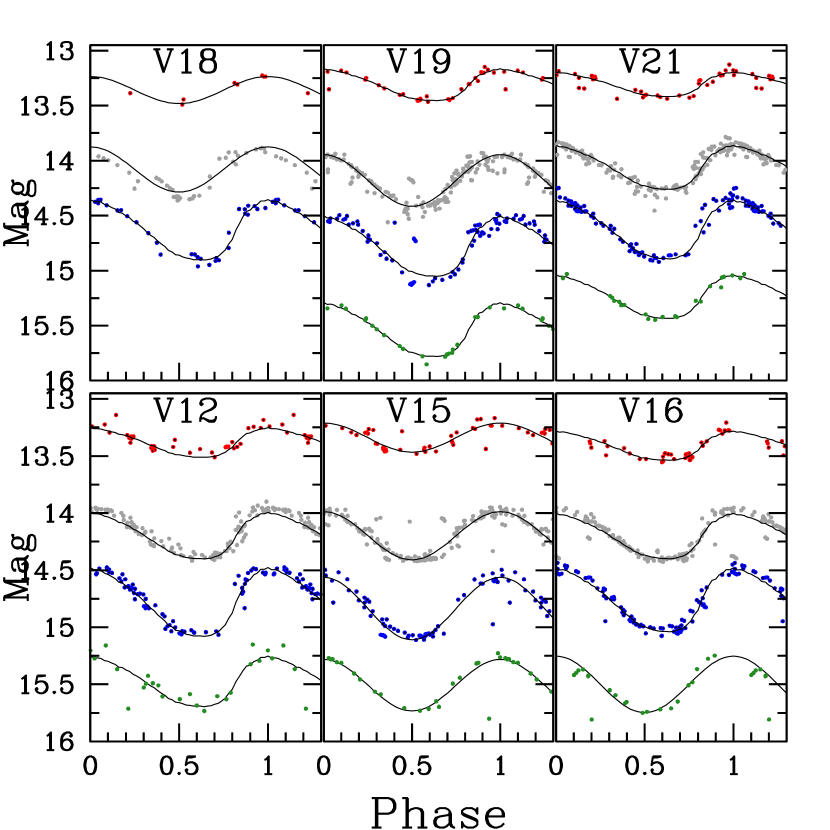
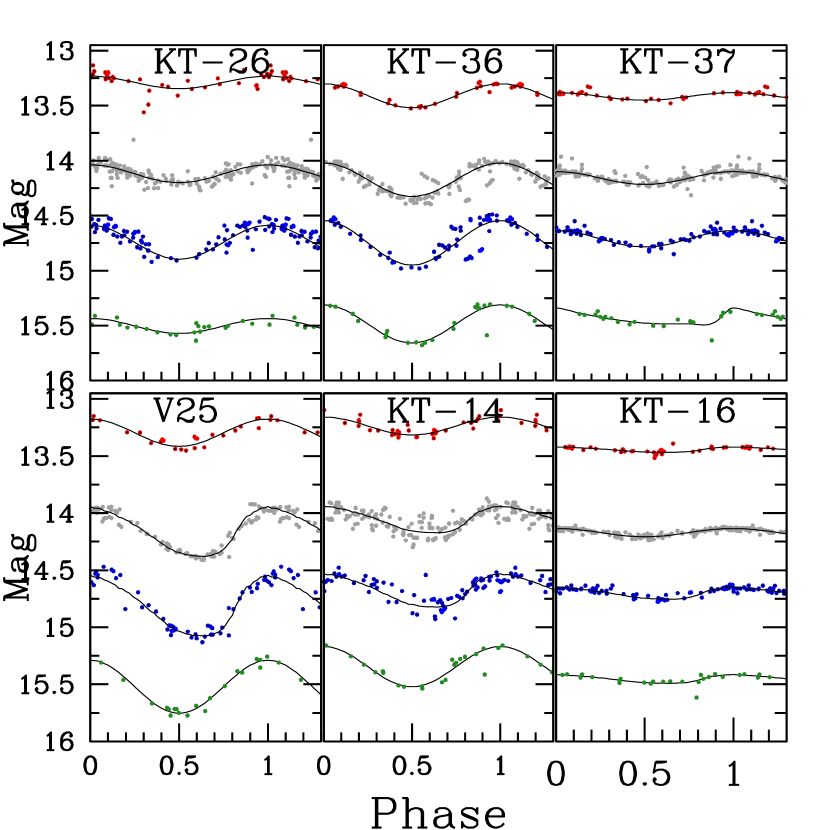
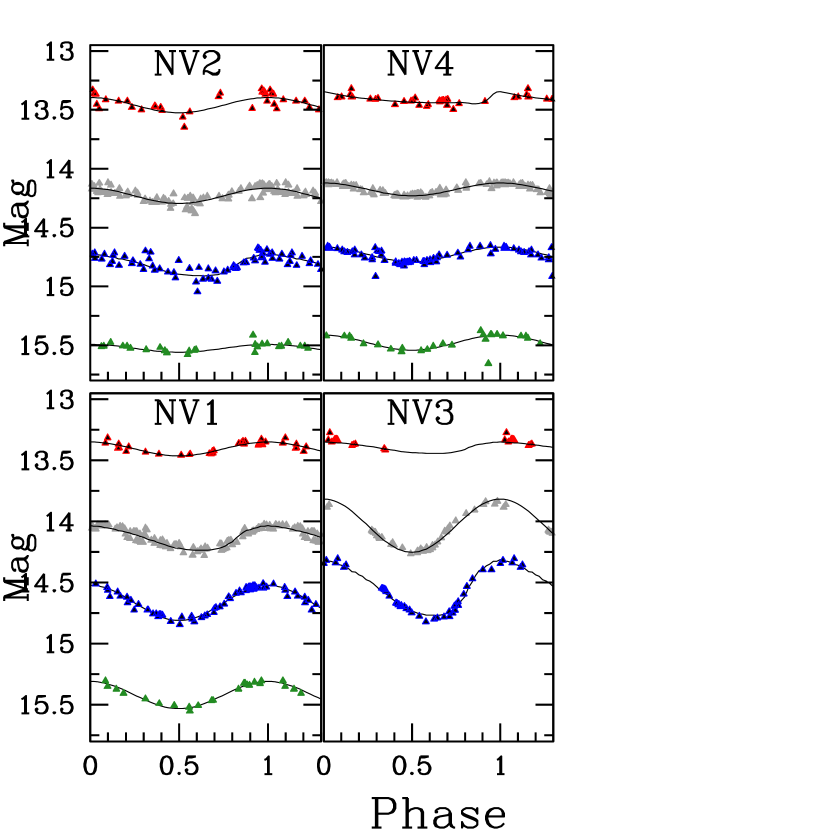
The light curves of the RR0 Lyrae variables are presented in Figure 1, and the RR stars are shown in Figure 3. The template-fitting routines from Layden (1998) and Layden & Sarajedini (2000) were used to fit the data, but a Fourier decomposition was used for their mean magnitude and amplitude parameters. Our observations do not cover the RR Lyrae variables V22 and V27, as they lie 16.5 and 20 arcminutes, respectively, from the cluster center. These stars were observed as part of the ASAS survey, and their bright mean magnitudes (1 mag brighter) suggest that both these stars are too bright to belong to the cluster. Further evidence that these two stars belong to the field population comes from their amplitudes, which are small for their pulsation periods (see Table 2), suggesting they are more metal-rich than the rest of the M22 RR Lyrae stars. Our observations also provide insufficient phase coverage for V3, but our photometry clearly suggests that this star is too faint to belong to the cluster. It has a magnitude similar to the majority of the RR Lyrae variables located in the Galactic bulge (Kunder et al., 2008; Pietrukowicz et al., 2012). Similarly the RR Lyrae variable KT-12 is too faint to belong to M22, and also likely belongs to the bulge population; our phase coverage for this star allows robust magnitudes to be determined, which are presented in Table 2.
We have discovered four new low amplitude RR Lyrae stars, presented in Figure 5. These stars are all located 6 arcminutes from the center of the cluster; there are only 3 other M22 RR Lyrae variables at comparably large distances, the other M22 RR Lyrae variables lying at a mean distance of 2 arcminutes from the center. The specific frequency of RR Lyrae stars in M22 is =10.4 where , and =8.50 (Harris, 1996, 2010 update) is the cluster’s integrated absolute magnitude in .
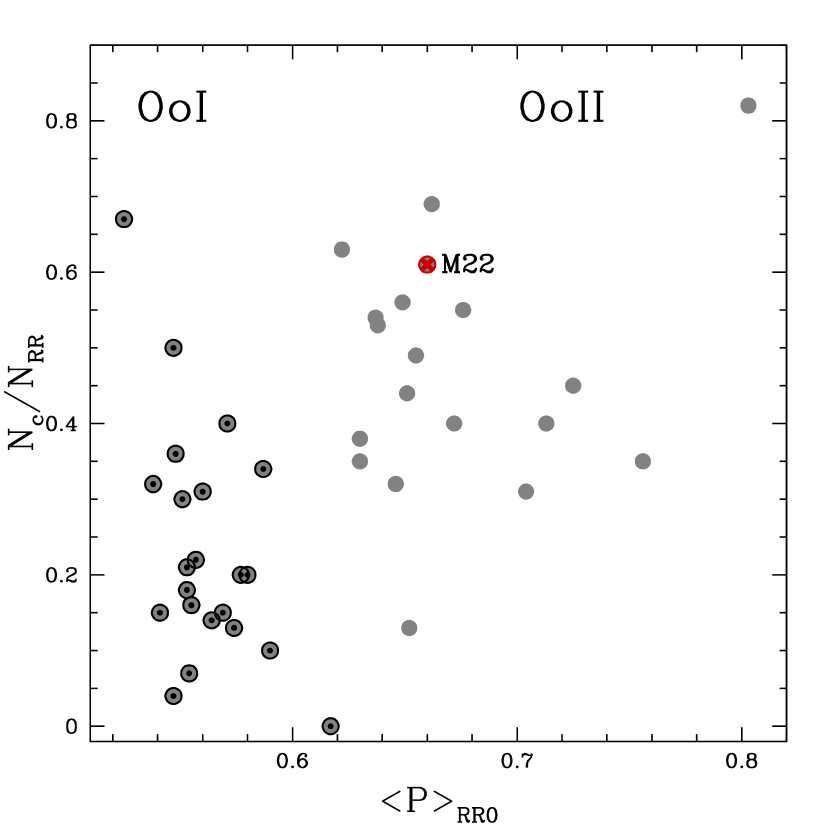
The mean periods for the 10 RR0 Lyrae stars and 16 RR stars are 0.660.02 d and 0.330.01 d, respectively. The ratio of RR to total RR Lyrae stars, , is 0.61. As Figure 6 shows, the mean periods of the RR0 Lyrae stars are similar to those found in the typical Oosterhoff II (OoII) clusters, as is the large ratio Catelan (e.g., 2009).
A significant fraction of RR Lyrae variables exhibit the Blazhko effect (hereafter also referred to as “Blazhkocity”), which can be described as long-term, sometimes periodic but often irregular amplitude and/or phase modulations (e.g., Blazhko, 1907; Klepikova, 1956; Benkõ et al., 2010; Buchler & Kolláth, 2011; Le Borgne et al., 2012). This effect is not understood theoretically. The only systematic survey carried out to determine the frequency of light curve modulation of RR0 Lyars stars is the Konkoly Blazhko Survey (KBS, Jurcsik et al., 2009). KBS1 consists of 30 field RR0 Lyrae stars with 0.50 d, and it was found that 47% exhibit Blazhkocity (Jurcsik et al., 2009). Similarly, from 124 field RR0 stars with periods ranging from 0.55–0.60 d, KBS2 reports a 43% incidence of stars with Blazhkocity (Sódor et al., 2012). The case for the RR stars is more unclear. Blazhkocity is usually not seen in RR variables (it is thought that the Blazhko effect occurs in 5% of RR variables; Moskalik & Poretti, 2003; Kolenberg, 2011) although recent studies of the GCs NGC 2808 and M53 have revealed RR Lyrae populations with large ( 50%) RR Blazhko percentages (Arellano Ferro et al., 2012; Kunder et al., 2013b).
The RR0 stars in M22 with light curve modulation include V6, V23 and KT-55 (see Figure 1). However, upon closer examination, the scatter in the light curve of V6 appears to be caused by various phase jumps, with no obvious cyclic variation of the pulsation amplitude such as seen in stars exhibiting Blazhkocity. V23 also has a light curve more indicative of a star with a rapidly changing or erratic period, as opposed to a star with Blazhkocity. KT-55, on the other hand, may be exhibiting Blazhkocity, particularly as amplitude modulation at maximum light is seen in the light curve (where there are more observations.) Assuming that only KT-55 exhibits Blazhkocity, this suggests a relatively small (10%) incidence of Blazhko RR0s in M22.
However, although our observations span many years, the most useful set of observations were taken over three nights in 2012 and such irregular spacing is not sufficient to derive either Blazhko periods or secondary periodicities with any confidence. Without Blazhko periods, it is difficult to know for certain whether the scatter in the light curves is indeed due to the Blazhko effect or whether the light curve scatter is due to other phenomena such as unstable periods, large period-change rates (e.g., Le Borgne et al., 2007; Kunder et al., 2011), secondary periods (e.g., Fitch & Szeidl, 1976; Peniche et al., 1989; Moskalik & Poretti, 2003), period doubling (e.g., Szabo et al., 2010), and/or photometric anomalies such as blending compounded by variable seeing conditions. We have searched the stars for secondary periods, and find no firm evidence of secondary periods in the sample. However, it is worth noting that double-mode RR Lyrae stars usually reside in metal-poor OoII-type clusters (e.g., Clement & Walker, 1991) so the environment of M22 could be receptive to such pulsators.
We have also searched for trends between light curve scatter and stellar brightness to see whether any faint neighboring stars were contaminating the stellar PSF profile (as blending would make the RRL brighter, while blending combined with variable seeing could increase the light curve scatter). No systematic trend in perceived stellar brightness as a function of radial distance is seen, and no trends in stellar brightness as a function of Blazhkocity are found either. However, it is worth mentioning that many of the stars with light curve scatter are located closer to the center of the cluster. We have also searched for trends in a stars’ separation index, where the separation index is defined by Stetson, Bruntt & Grundahl (2003). The larger the separation index, the less a given star is contaminated by its known neighbors. All of the RR Lyrae variables have separation indices greater than zero, although there are two stars (one exhibiting light curve scatter and one that does not) with a separation index less than or equal to three. A separation index of 3.0 indicates that the light of a star is contaminated by its known neighbors at a 6% level; since the known neighbors are accounted for in the PSF fits, the residual contamination by these stars should be at least an order of magnitude less. In summary, we stress that we have no specific evidence that the light curve scatter seen is caused by blending. But we do remain alert to the fact that PSF fitting in crowded fields observed under different seeing conditions is challenging. It is also possible that incorrect cycle counts spanning long intervals without observations can lead to inaccurate periods, but we stress that the periods we have derived are statistically superior to alternative periods requiring different numbers of cycles over the time span that we have covered.
3.2. RR Lyrae Distance
The mean apparent magnitude for the RR Lyrae variables is = 14.15 0.02 mag, where the confidence interval is the standard error of the mean. This is in excellent agreement with the Harris (1996) value of = 14.15, which lists the mean magnitude of the horizontal branch, . It also agrees well with the Monaco et al. (2004) estimate of = 14.17 0.25 mag, found from averaging the magnitudes of the RR Lyrae stars observed at random phases.
The absolute magnitudes of the RR0 variables can be estimated using:
| (1) |
from Catelan & Cortés (2008), where is the metallicity in the Carretta & Gratton (1997) scale. Adopting =1.75 dex on the Kraft & Ivans (2003) scale (Marino et al., 2009; Da Costa et al., 2009), =1.55 dex, and therefore the absolute magnitudes of the RR Lyrae variables in M22 are =0.570.13 mag. Similarly, using a quadratic relation between RR Lyrae absolute magnitude and metallicity from Bono, Caputo, & di Criscienzo (2007):
| (2) |
the RR Lyrae absolute magnitudes are =0.560.08. A brighter =0.400.07 is found when using the Benedict et al. (2011) – relation, however, suggesting that the level of agreement between independent measurements is as large as 0.2 mag.
The level of evolution off the ZAHB can also affect an RR Lyrae star’s absolute magnitude in by 0.08 mag (e.g., Sandage, 1990; Clementini et al., 2003), as can an RR Lyrae star’s helium content, alpha-element abundance and CNO content. The metallicity bimodality in M22 of 0.14 (see the Introduction), corresponds to variation of 0.04 mag in .
It is worth noting that the Catelan & Cortés (2008) absolute magnitude relationship assumes a helium abundance of =0.23, an = +0.31, and no CNO enhancement. The Bono et al. (2007) relation is based on synthetic HB simulations and a large sample of Galactic globular clusters; therefore it assumes a He, and CNO typical of MW GCs. If the He, and CNO of the M22 RR Lyrae stars is abnormal, the RR Lyrae absolute magnitudes will be slightly affected.
Using the above determined of =0.570.12, the apparent distance modulus of M22, based upon the RR Lyrae variables, is =13.580.13. Using =0.36 mag (see below, §3.5), we obtain a true distance modulus =12.460.13, which implies a geometric distance of 3.1 0.2 kpc. The Benedict et al. (2011) absolute magnitue of =0.400.07 results in =13.750.11. and a true distance modulus =12.670.12 or 3.4 0.2 kpc.
RR Lyrae period-luminosity PL relations in are powerful in that they are not as sensitive to evolutionary effects as the bluer passbands, leading to the presence of tighter absolute magnitude relations (e.g., Catelan et al., 2004). The reddening is also not as severe in these passbands. Using the Catelan et al. (2004) relation of
| (3) |
and Z=0.0006 ( =1.77, =0.23, =+0.35, no CNO enhancement), and using =0.36 mag, a true distance modulus =12.500.10 is found. This translates to a geometric distance of 3.2 0.2 kpc, and is in excellent agreement with the distances determined from the – relations above.
3.3. The RR Lyrae Color-Magnitude Diagram
Figure 7 gives an expanded view of the HB. As suggested earlier and demonstrated in §3.5, there is significant differential reddening across the face of M22 that increases the scatter in Figure 7. The RR0 stars provide a means to quantify and correct for this effect. The arrows in Figure 7 show the originally observed positions (squares) and the positions corrected for differential reddening (arrow heads) based on the mean reddening of and the stars’ colors in Table 5. Thus, the arrow heads should be compared to the evolutionary model tracks; this indicates that the RR0 in M22 are likely lower mass stars evolved from BHB rather than higher mass stars living on the red end of the ZAHB. The arrows also give a sense for how much the RR1 and non-variable BHB stars in Figure 7 are affected by differential reddening.
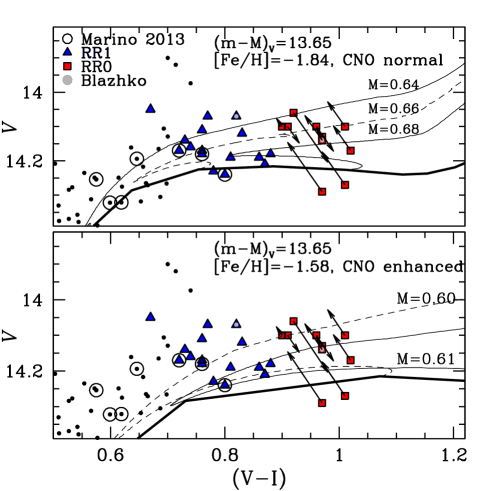
As mentioned in the Introduction, the stars in M22 can be roughly divided into two metallicity groups – the -rich and the -poor stars (e.g., Marino et al., 2011a; Alves-Brito et al., 2012), with and (Marino et al., 2009). The appropriate theoretical models from the BaSTI archive (Pietrinferni et al., 2004, 2006, 2009) are overplotted in Figure 7 to illustrate how the RR Lyrae stars in M22 are matched by theoretical evolutionary predictions. In particular, the Zero Age Horizontal Branch (ZAHB) loci corresponding to different assumptions about the chemical mixtures are shown: a ZAHB locus for an enhanced mixture with , and a ZAHB locus corresponding to a mixture where the CNO sum is enhanced with respect the standard enhanced mixture and . For the CNO-enhanced ZAHB locus, the BaSTI models available account for a CNO-sum enhancement of approximately dex. However, as a smaller CNO-enhancement of dex is found from the spectroscopic measurements of M22, a correction to both magnitude and color index of the models is made to account for this difference111This correction has been estimated by comparing the model predictions for various levels of CNO-enhancement discussed in Pietrinferni et al. (2009).. For the standard enhanced stellar locus, a shift of +0.05 mag in to the BaSTI ZAHB is applied to account for the updated conductive opacities provided by Cassisi et al. (2007). This shift is important to obtain a self-consistent comparison with the CNO-enhanced ZAHB, which has been computed accounting for the updated conductive opacities (see Cassisi et al., 2007, for a detailed analysis of this issue).
We adopt a reddening and a distance modulus of mag for the theoretical comparison in Figure 7. This distance modulus is within the range of the distances obtained from the RR Lyrae variables discussed above in §3.2 and was chosen because it allows the lower envelope of the observed HB star distribution for the standard enhanced ZAHB to match the BASTI models.
In each panel of Figure 7, the evolutionary tracks of some selected HB stellar models are also shown. Figure 7 therefore shows the comparison between observational data and theoretical models. Because the theoretical models in both panels are located at approximately the same position in the CMD, it is difficult to trace the origin of the RR Lyrae population – that is, to assess whether they belong to the first generation (the canonical enhanced one) or to the second generation (the more metal-rich, CNO-enhanced one). However, it is worth noting that, that if one assumes that the RR stars are (mainly) associated with the first generation, then their location in the CMD is well matched by the evolutionary pattern of HB models during the main core He-burning stage. In particular, BaSTI models also indicate that in such a scenario, most of the M22 RR Lyrae stars have a rather small mass range of 0.66 – 0.68. We note that it has been shown spectroscopically that three (blue) RR1 variables in M22 are metal-poor with a normal CNO content (Marino et al., 2013) and therefore likely belong to the first generation.
On the other hand, if one assumes that the RR Lyrae stars belong to the second generation, the theoretical prediction is that these variables are brighter than the ZAHB, and that their location (at least of the majority of them) could be (mainly) explained as due to stars crossing the instability strip during their off-ZAHB evolution. In this scenario, their predicted masses would be 0.60 – 0.61.
It is obvious that spectroscopic investigations of the chemical composition of the M22 RR Lyrae stars, and in particular the measurement of O and Na abundances, would help in discriminating between these scenarios. However, due to the large difference in the evolutionary rates between HB stars experiencing their major core He-burning stage and those crossing the RR Lyrae when moving from the blue side of the HB distribution towards the Asymptotic Giant Branch, some useful hint for disentangling the evolutionary origin of these variable stars could be obtained by the analysis of the secular pulsation period changes (however see e.g., Le Borgne et al., 2007; Kunder et al., 2011, for the difficulties in associating period change rates to the evolutionary status of a star).
3.4. Period-Amplitude Diagram
The period-amplitude (PA) diagram for the RR Lyrae stars is shown in Figure 8, where is the amplitude in the -band. Also shown are the RR Lyrae stars in 14 OoII-type GCs (NGC 4590, NGC 5053, NGC 7078, Cen, NGC 5466, NGC 6426, NGC 6333, NGC 6341, NGC 5024, NGC 7089, NGC 2419, NGC 5286, NGC 6101 and NGC 1904). The period- relation for OoI and OoII clusters is overplotted, where the fundamental-mode and first-overtone PA relations are derived from the M3 RRL (Cacciari et al., 2005).
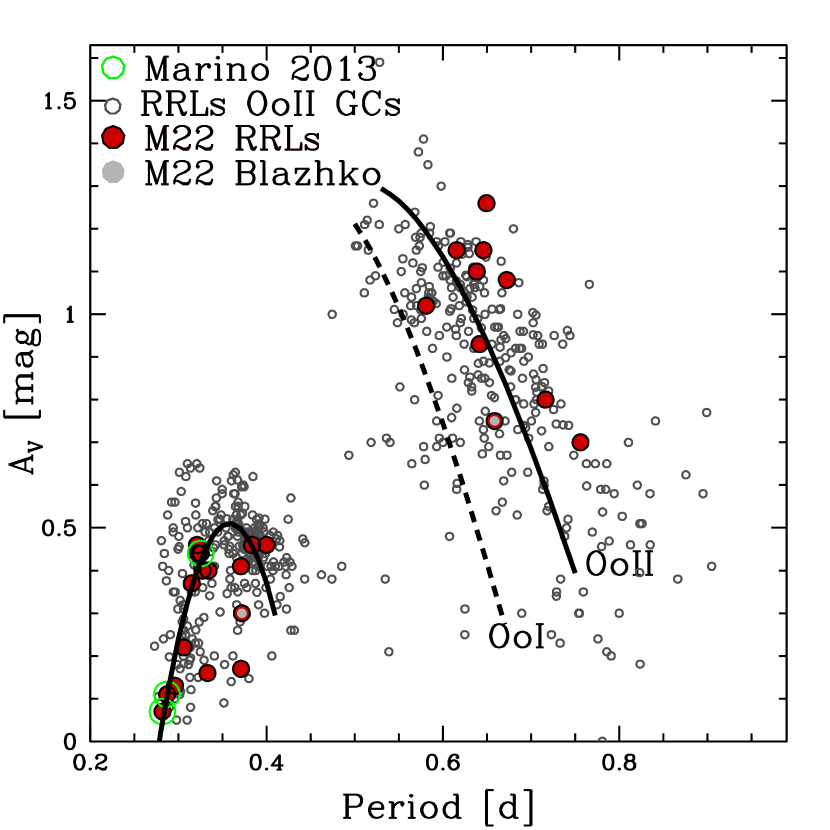
The M22 RR0 variables occupy the area of the PA diagram where OoII-type variables tend to lie (e.g., Clement & Shelton, 1999). Unlike RR0 variables, RR variables are not expected to follow a roughly linear sequence in the PA diagram (e.g., Bono et al., 1997), and this is clearly seen within the RR population of M22. The “hairpin” shape predicted for the RR variables in the theoretical PA diagram is evident, albeit with significant outliers. The approximate relation
| (4) |
is derived from the M22 RR1 variables. Blazhkocity can affect the position of a star on the PA diagram (e.g., Cacciari et al., 2005) and as discussed above, some of the RR Lyrae stars in M22 may exhibit signs of this phenomenon. The amount of the amplitude change due to the Blazhko effect is no more than 0.1 mag in (see Figure 3), which does not significantly affect the location of the star in the PA diagram.
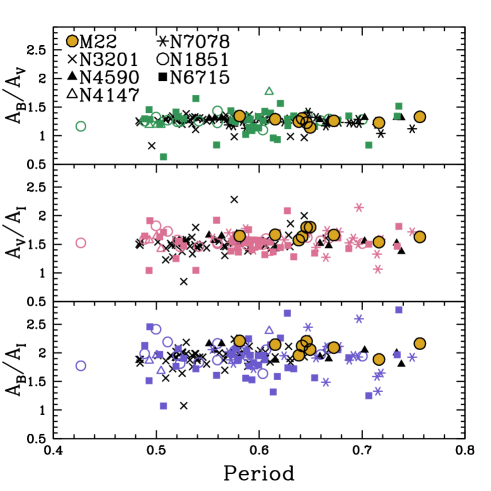
Amplitude ratios are often used both to identify variables that might have their photometry compromised by faint companions and to classify variable stars, especially the low amplitude RR Lyrae variables. In light of this, the ratios of the RR0 and RR amplitudes in the different bands are given in Table 3 and Table 4. We have excluded the RR0 star KT-55 in the amplitude ratio determination, as it has an uncertain (see Table 2). Similarly, the RR stars NV2, NV3 and V18 are not included in the amplitude ratios due to no/uncertain and s. The amplitude ratios of the RR Lyrae stars in few Galactic GCs are also listed for comparison purposes and plotted as a function of their period in Figure 9. There is a scatter of 0.2 mag for and , but a much smaller scatter of 0.05 mag, for . Moreover, Kuehn et al. (2011) find = 1.28 0.02 from 26 RR Lyrae variables in the OoI-type LMC GC NGC 1466 (see their Figure 9), and Kinman & Brown (2010) find = 1.27 from 12 field RR Lyrae stars in the Northern Sky Variability Survey (NSVS) data. These results are in excellent agreement with the amplitude ratios obtained here and in other Galactic GCs. This may suggest that Galactic field and cluster RR Lyrae and cluster LMC RR Lyrae stars have RR Lyrae amplitude ratios that are independent of their host system.
| cluster | num stars | source | ||||
|---|---|---|---|---|---|---|
| M22 | 1.890.05 | 2.090.04 | 1.660.03 | 1.260.02 | 9 | this work |
| NGC 3201 | – | 1.880.04 | 1.490.03 | 1.260.02 | 56 | (1) |
| NGC 1851 | – | 2.000.04 | 1.570.02 | 1.270.02 | 19 | (2) |
| NGC 4147 | – | 2.190.24 | 1.740.25 | 1.290.12 | 5 | (3) |
| NGC 4590 | – | 2.030.04 | 1.550.03 | 1.310.01 | 12 | (4) |
| NGC 7078 | – | 1.930.05 | 1.580.04 | 1.230.01 | 25 | (5) |
| NGC 6715 | – | 1.890.05 | 1.530.03 | 1.250.03 | 40 | (6) |
| cluster | num stars | source | ||||
|---|---|---|---|---|---|---|
| M22 | 1.830.10 | 2.170.07 | 1.610.07 | 1.370.06 | 13 | this work |
| NGC 3201 | – | 1.970.02 | 2.050.07 | 1.020.04 | 4 | (1) |
| NGC 1851 | – | 2.040.08 | 1.630.05 | 1.250.02 | 8 | (2) |
| NGC 4147 | – | 2.060.14 | 1.540.25 | 1.380.18 | 10 | (3) |
| NGC 4590 | – | 2.100.02 | 1.620.02 | 1.300.01 | 16 | (4) |
| NGC 7078 | – | 1.970.06 | 1.550.04 | 1.280.03 | 13 | (5) |
| NGC 6715 | – | 1.70.1 | 1.560.02 | 1.080.08 | 8 | (6) |
3.5. RR Lyrae Reddenings
The interstellar extinction toward M22 is high ( = 0.34 mag; 2010 edition of Harris, 1996) and variations of reddening are expected within the field of view of M22 (e.g., Monaco et al., 2004; Piotto et al., 2012). Minimum-light colors of the RR0 Lyrae variables have been used as a tool for measuring the interstellar reddening toward RRLs (Sturch, 1966; Walker, 1990; Blanco, 1992; Mateo et al., 1995; Kunder et al., 2010). Sturch (1966) derived a formula to determine reddenings toward RR Lyrae stars using their (B–V) colors at minimum light, which was then corrected to be on the GC scale by Walker (1990). In particular, for RR0 variables, Walker (1990) obtained:
| (5) |
where is the color at minimum light (phase between 0.5 and 0.8), is the period in days and is the metallicity in the Zinn & West (1984) scale. Similarly, using the and passbands, Guldenschuh et al. (2005) find:
| (6) |
and that this relation is largely independent of period, amplitude and metallicity.
The observed B–V and V–I color at minimum light is calculated using the best-fit light-curve templates and listed in Table 5. Comparing colors at minimum light derived from fitted template light curves, to minimum-light colors estimated directly from the observation, we find that the values agree usually to within 0.01 mag. The average from Equation 5, adopting =1.73 dex (which is =1.75 on the Kraft & Ivans, 2003, scale), gives =0.38 0.02 mag. The average from Equation 6 is 0.47 0.03 mag which translates to of 0.34 - 0.37 mag, depending on the reddening law used. 222Different values for the transformation from to include a ratio of 1.4 (Schlegel et al., 1998; Schlafly & Finkbeiner, 2011), 1.35 (McCall, 2004) and 1.28 (Cardelli et al., 1989, 1992). Adopting an average ratio of 1.35, is 0.35 0.04 mag.
The average of the values from Equation 5 and Equation 6 is =0.36 0.03, in excellent agreement with the value of =0.38 0.04 from Monaco et al. (2004) and Richter et al. (1999). Older reddening estimates range from = 0.32 to 0.42 (Hesser, 1976; Harris & Racine, 1979; Crocker, 1988). Monaco et al. (2004) find that differential reddening in M22 is 0.06, and our values of and show a similar range.
| Name | ( | ( | ||
|---|---|---|---|---|
| V1 | 0.800.01 | 0.41 | 1.080.01 | 0.50 |
| V2 | 0.770.01 | 0.38 | 1.020.02 | 0.44 |
| V4 | 0.790.01 | 0.38 | 1.070.01 | 0.49 |
| V6 | 0.780.01 | 0.39 | 1.010.02 | 0.43 |
| V7 | 0.760.01 | 0.37 | 1.050.01 | 0.47 |
| V10 | 0.760.01 | 0.37 | 1.050.01 | 0.47 |
| V13 | 0.730.01 | 0.33 | 0.980.01 | 0.40 |
| V20 | 0.790.01 | 0.37 | 1.070.02 | 0.49 |
| V23a | 0.850.04 | 0.38 | 1.100.02 | 0.52 |
| KT-55 | 0.800.01 | 0.40 | 1.070.01 | 0.49 |
a Based on a light curve using data only from runs 9, 14, and 16, which had minimal scatter.
b from Equation 5
Walker (1998) showed that the blue edge of the instability strip in GCs appears to have a constant B–V over a wide range of metallicity, with = 0.18 0.01. The blue edge of our sample is estimated by averaging the B–V color of the five bluest RR Lyrae stars and the five reddest constant stars. (Because measurement uncertainties guarantee observational tails beyond true limits, scissoring these two samples largely cancels out the systematic error that would arise if we had used the most extreme B–V RR Lyrae to define an envelope.) Hence the blue edge of the IS is B–V = 0.53 mag, suggesting = 0.35 0.01. This color excess is in excellent agreement with that found from the RR Lyrae minimum light colors.
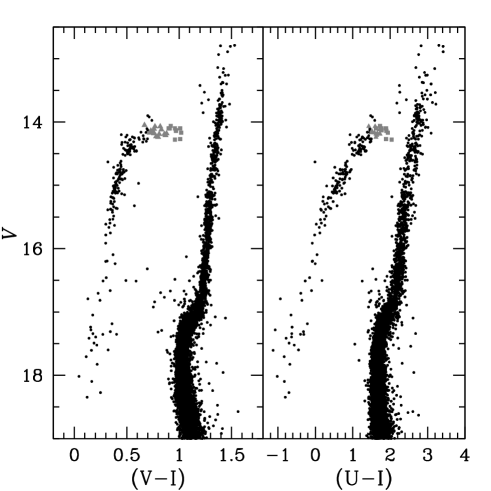
4. The Color-Magnitude Diagram
The color-magnitude diagram for M22 is shown in Figure 10, in versus V–I and U–I, where the CMD is cleaned using the proper motions provided by Zloczewski et al. (2013). About 13% of GCs in the Milky Way (15 out of 114) have strong extended HBs (E-BHBs), a feature which may be due to the presence of helium-enhanced second-generation subpopulations (e.g., Norris, 2004; Piotto et al., 2005; Lee et al., 2007). It has also been shown that E-BHB GCs are in general more massive than normal GCs and have different kinematics (e.g., Lee et al., 2007). This suggests that GCs with and without E-BHBs have different origins. M22 is known to have a strong E-BHB, and with our proper motion cleaned HB and accurate, calibrated photometry, we easily see that the E-BHB reaches 1.5 magnitudes fainter than the -magnitude main-sequence turnoff at its high temperature end.
4.1. HB morphology parameters
Most key HB morphology parameters compare the number ratios of stars in different parts of the HB (e.g., Mironov, 1972; Buonanno, 1993; Lee et al., 1994), with one of the most frequently used HB morphology parameters defined as (-)/( + + ) (see Lee et al., 1994). This requires the knowledge of the number of blue () stars (bluer than the RR Lyrae gap), variable () and red () HB stars (number of HB stars redder than the gap) in a cluster. For M22, is zero and is 26, as determined in §4. An estimate of the number of BHB, however, is complicated by the many field stars near M22. The proper motion cleaned HB ensures that the stars are cluster members, but again due to the heavy crowding of the field, the proper motion completeness is about 50 per cent (Zloczewski et al., 2013).
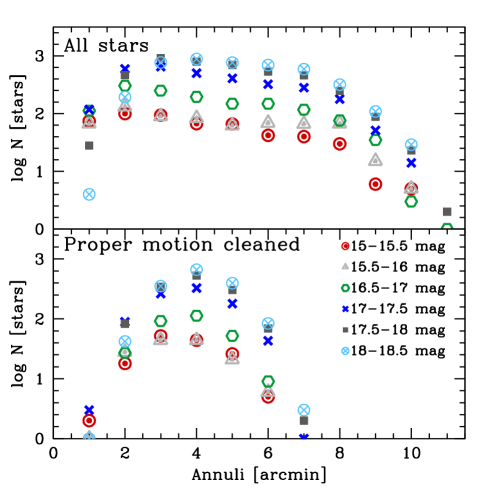
Figure 11 shows the observed star counts as a function of radial distance, and shows the logarithm of star counts plotted against apparent magnitude. If we can assume that the completeness is the same for all magnitude bins beyond some radius, say for instance 4 arcminutes, this can be interpreted as a luminosity function for that radial zone, at least. The radial zone that will be the most incomplete is the innermost radial zone, where the crowding is most severe, and in the case of the Zloczewski et al. (2013) proper motion cleaned catalog, also the outermost radial zone, where the fraction of the annulus contained within the rectangular field of view diminishes. The star counts of the outermost two zones can be compared (e.g., at 6′ and at 7′), and a similar magnitude distribution would indicate they are comparably complete. Where the magnitude distribution begins to diverge is where a radial zone is beginning to be incomplete. In this way, the onset of where incompleteness sets in as a function of radial distance from the cluster center is mapped (see also Walker et al., 2011).
For the magnitude range of the HB, from 15 to 18.5 mag, there is no divergence in the apparent magnitude distribution from 4-6′ in the Zloczewski et al. (2013) sample. The number of HB stars from the Zloczewski et al. (2013) proper-motion selected stars between =4′ and = 6′ is thirty-two, and the number of proper-motion selected RR Lyrae stars in this same range is zero. Therefore, = , or (-)/(++)=+1.00.1.
This same procedure is repeated with the sample of stars from our M22 photometric catalog. Figure 11 shows that there is little or no sign of incompleteness at distances between =4′ and =8′. In this radial zone there are 147 blue HB stars, 5 RR Lyrae stars and 0 red HB stars, giving a = or (-)/(++)=+0.970.1 in agreement with what was obtained from the proper motion cleaned sample.
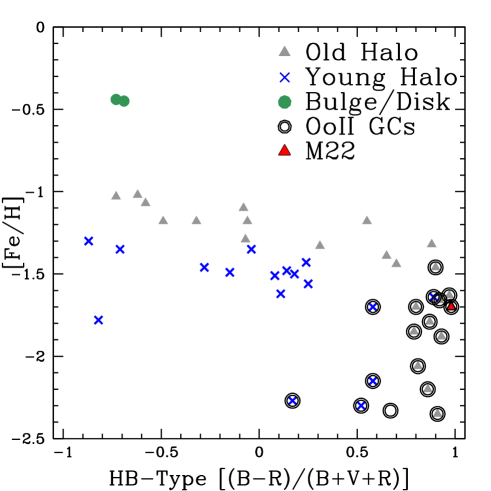
A comparison of the HB-type of M22 with respect to other GCs that harbor a population of RR Lyrae variables is shown in Figure 12, where the HB-type comes from the compilation of Catelan (2009). As expected, M22 has a , HB-type and Oosterhoff classification consistent with an old halo GC.
4.2. Gaps on the Blue HB
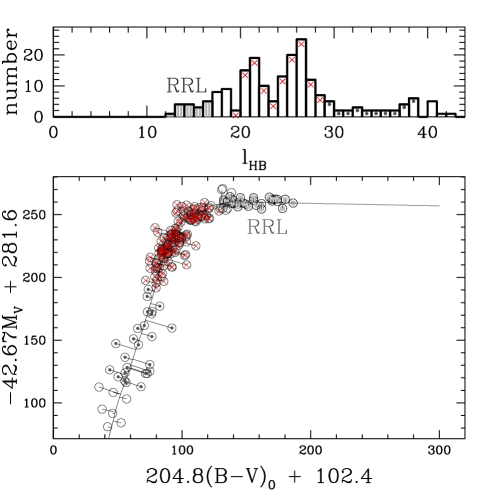
Rood & Crocker (1985, 1989) suggest that a good method for analyzing the distribution of stars along the HB is to define a coordinate, , which is linear along the HB ridge-line. Briefly, the length of the HB ridge-line is divided into equal bins, and the number of stars populating each bin (perpendicular to the ridge-line) is determined (see bottom of Figure 13). Although has been used frequently (e.g., Ferraro et al., 1992; Dixon et al., 1996; Catelan et al., 1998), it has been given different definitions (i.e., different bin sizes along the HB ridgeline), making it difficult to accurately reproduce and compare from cluster to cluster. In response to such confusion, Piotto et al. (1999) outline a recipe to obtain a “standard” , and their procedure is adopted here.
The distribution is shown in Figure 13, using the proper motion cleaned HB stars as well as the RR Lyrae stars in the cluster. The distribution is asymmetric; that the stellar distribution along the HB is not symmetric is a feature characteristic of blue HB clusters. The main feature of the is a double peaked distribution, one peak at =26 and another at =21. Between the two peaks is a pronounced gap, at =23, clearly seen at = 14.6, and first noted by Cho et al. (1998). To our knowledge, this is the first time that a gap clearly shows up in the middle of the so-called hot HB stars.
Unfortunately, it is difficult to tie physical parameters (such as or mass) to any gaps or over-densities along the HB from the parameter. This is because the HB ridge line does not follow the ZAHB, whereas theoretical models do. We have therefore used the ZAHB shown in Figure 7 to estimate the temperature of where this gap occurs. In particular, the ZAHB with a normal CNO and =1.84 dex is used, as that has spectroscopically been shown to be appropriate for the M22 HB (Marino et al., 2013). From (V–I,)=(0.44,14.53) to (V–I,)=(0.41,14.71), which is the approximate range of the “gap” in a versus V–I (see Figure 10), the runs from 9,500 K to 10,500 K. Therefore, the HB gap in M22 is on the cool side of the Grundahl et al. (1998) “jump”, which is seen in the UV CMDs of E-BHB GCs at =11,500 500 K (e.g., Grundahl et al., 1999) .
A peak at =26 is also seen in NGC 6273 (Piotto et al., 1999), suggesting that there may be some preference for stars to clump here, although a sample of two clusters is not sufficient to draw any conclusions at this point.
4.3. Radial Distribution
The currently available models for the formation of multiple populations in a GC suggest that the second generation stars should form in the inner regions of the cluster, shortly after the ejecta from the more massive first generation stars accumulated there and subsequently mixed with pristine, unpolluted matter (e.g., D’Ercole et al., 2008; Decressin et al., 2010). This is actually observed in the case of the not-yet dynamically relaxed GCs Cen and M13 (Sollima et al., 2007; Bellini, 2009; Lardo et al., 2011; Johnson & Pilachowski, 2012). Despite these cases, it is believed that the majority of the MW GCs will have the presence of radial stellar population gradients erased as a consequence of the long-term dynamical evolution occurring during the last 12 Gyr of their life (e.g., as it seems is the case for the GC NGC 1851; Milone et al., 2009).
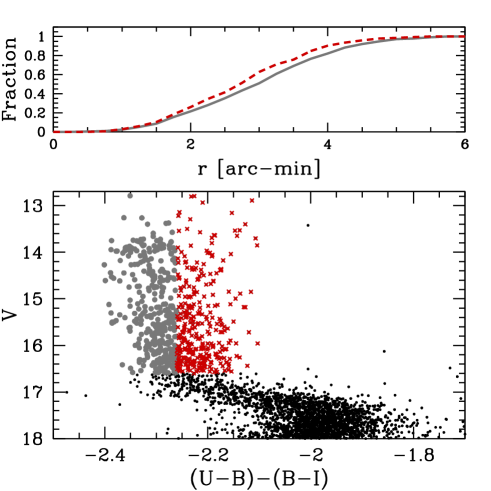
That M22 has a double RGB with different Ca abundances has been shown from by Lee et al. (2009) from the index of the - photometry. Joo & Lee (2013) also use Strömgren photometry to show that the RGB consists of two stellar populations. In Figure 14 we use the vs diagram, where = (U–B)-(B–I), to separate the blue and red RGB stars. Here, the red RGB stars are arbitrarily defined as those with 2.26 and the blue RGB stars have 2.26. The index was introduced by Monelli et al. (2013) and maximizes the separation among stars with different helium and light-elements content. This is because the U–B color is sensitive to light-element variations (Marino et al., 2008; Sbordone et al., 2011) and the B–I color is very efficient in disentangling stellar populations with different helium abundance (Piotto et al., 2007; di Criscienzo et al., 2011). The radial distributions of the blue and red RGB stars are shown in the top panel of Figure 14. and suggests that the red population is slightly more centrally concentrated than the blue RGB population. This is also confirmed from the results of a two-sided KS test, which indicates that the red and blue RGB stars trace the same radial distribution with KS-prob = 0.10. Such a KS-prob is just marginally greater than the default threshold KS-prob = 0.05 below which one rejects the null hypothesis.
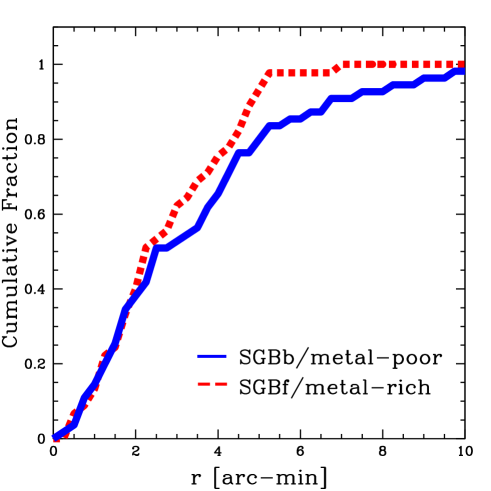
Similarly, Marino et al. (2012a) present an abundance analysis of 101 SGB stars in M22, finding that the faint SGB is populated by more metal-rich stars than the bright SGB. Marino et al. (2012a) classify their SGB stars as -poor and -rich based on the spectroscopic C, Sr and Ba abundances, and the cumulative radial distribution of their sample of SGB stars (their Table 3) is shown in Figure 15. Although the sample is small, the -poor and -rich stars appear to have different radial distributions beyond 3 arc minutes. The result of a two-sided KS test indicates that the faint SGB and bright SGB stars trace the same radial distribution with KS-prob = 0.19 beyond a radius of 3 arc minutes.
The faint SGB evolves in a redder RGB sequence whereas the brighter SGB evolves in a bluer branch.
Both the RGB (red/blue) and SGB (bright/faint) populations show hints of radial trends, but ultimately, cleaner and larger samples are needed to make firm conclusions of the long-term dynamical evolution of M22.
In general, GCs with strong E-BHBs, as seen in the HB of M22, are modeled by helium-enhanced second-generation subpopulations (e.g., Norris, 2004; Piotto et al., 2005; Lee et al., 2007). As the second generation of stars in M22 can be distinguished radially, as shown clearly with the M22 SGB and RGB stars, it is of interest to use radial plots to search for trends in the stars along the HB.
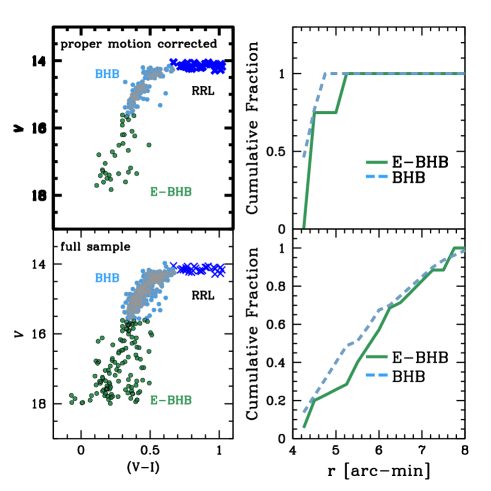
Figure 16 shows the radial distribution of the E-BHB stars, using our photometry and also using the proper-motion selected stars from Zloczewski et al. (2013). We limit our analysis to the stars at distances between =4′ and =6′ and to =18.0 mag, as we believe that this is the range where these samples show no magnitude bias (see Figure 11 and discussion). Both our sample and the Zloczewski et al. (2013) sample show that the E-BHB stars can not be distinguished from the rest of the HB stars in a radial plot. Unfortunately, the number of HB stars in the outer parts of M22 is significantly smaller than the number of stars closer to the central part of the cluster. For example, there are only 36 E-BHB stars in our sample at distances larger than =4′ from the cluster center. Therefore the significance of this finding might be somewhat biased. If confirmed, however, this would indicate that the most extreme BHB stars in M22 are formed alongside the reddest part of the HB. Because Marino et al. (2013) have shown that the reddest HB stars belong to the first generation of stars, this would then also suggest that the E-BHB stars in M22 belong to the first generation and are not He enhanced.
Our result of no strong radial separation of the HB components in M22 is in agreement with that found in the globular cluster NGC 2808 (Iannicola et al., 2009). They divide the NGC 2808 HB stars into three radial bins, and find that the relative fractions of cool, hot, and extreme HB stars do not change when moving from the center to the outskirts of the cluster. It was also found from high resolution spectra of hot HB stars in Cen, that a significant fraction of E-BHB stars are helium-poor (Moehler et al., 2011). They find that among the hottest stars in the E-BHB (in the temperature range 30 000 K to 50 000 K), 30% are actually helium-poor.
Our result is also in agreement with some of the M22 population models presented by Joo & Lee (2013) (see their Figure 13). For example, Joo & Lee (2013) show that if there is a difference in between the two SGB M22 subpopulations, as suggested for NGC 1851 (Cassisi et al., 2008; Salaris et al., 2008), both the E-BHB and the reddest HB will have a roughly equal mix of first and second generation stars. Additional theoretical models by Moehler et al. (2011) have shown that the presence of E-BHB stars can be explained as having formed by an independent evolutionary channel: hot helium flashers and a significant fraction of E-BHB stars may come from the above channel. Therefore, here we present additional observational results in contradiction to the generally accepted view on the formation of an E-BHB (e.g., Norris, 2004; Piotto et al., 2005; Lee et al., 2007; D’Antona & Caloi, 2008). Especially in this regard, radial studies involving wide-field photometry on a large sample of E-BHB clusters would be a worthwhile endeavor.
5. Conclusions
The first calibrated UBVI photometry is presented for 26 RR Lyrae variables in the chemically heterogeneous, split-SGB globular cluster NGC 6656 (M22). Four of these variables are newly discovered, which increases the specific RR Lyrae fraction of M22 to =10.4 where , and =8.50 (Harris, 1996, 2010 update) is the cluster’s integrated absolute magnitude in . The pulsational parameters of the variables suggest that 10 RR Lyrae variables are fundamental-mode pulsators with mean periods of = 0.660.02 days and 16 are first-overtone variables with mean periods of = 0.330.01 days. The number ratio of the RR-type variables to the total number of the RRL-type variables is = 0.61. Therefore M22 can be classified as an OoII cluster, which is expected considering the metallicity and horizontal branch morphology of the cluster.
The mean magnitude for the RRLs is = 14.15 0.02 mag, and the reddening from their minimum light colors was determined to be =0.360.02 mag, in agreement with previous studies (e.g., Monaco et al., 2004; Richter et al., 1999). Using both the recent recalibration of the RR Lyrae luminosity scale by Catelan & Cortés (2008) and the quadratic relation between RR Lyrae absolute magnitude and metallicity from Bono, Caputo, & di Criscienzo (2007), the RR Lyrae variables have absolute magnitudes of =0.570.13. This leads to an RR Lyrae distance of =13.580.13 and adopting =0.36 mag, =12.460.13 mag. We note, however, that a 70% brighter is found when using the Benedict et al. (2011) – relation, which would change the RR Lyrae distance modulus by 0.2 mag. A somewhat brighter is in accordance to the distance determination of =13.65 mag found by using theoretical Zero Age Horizontal Branch loci and accounting for the most recent spectroscopic analysis of the chemical composition of the cluster stars.
From the comparison of theoretical ZAHB sequences with observations, we find that most RRLs have a mass of M=0.64–0.68 if there is no non-canonical enhancement of CNO elements or helium. If such non-canonical enhancement is present, the mass range could be more like 0.60–0.61. We also find that, theoretically, if two populations of RR Lyrae variables existed in M22 with abundance ratios similar to the two populations of SGB stars (e.g., Marino et al., 2012a), it would be very difficult to distinguish between the more metal-rich and more metal-poor variables from their luminosities alone. This is because the -rich stars have higher C and N contents, so their luminosities would be comparable to the more metal-poor variables.
After correcting for completeness on the horizontal branch, (-)/(++)=+0.970.1 is obtained. This is one of the largest HB values for a GC with a substantial population of RR Lyrae stars, and combined with its and Oosterhoff type, is consistent with the classification of an old halo GC.
Different spatial distributions can be separated in the Marino et al. (2012a) sample of SGB stars as well as in the RGB, with the more metal-rich SGBf and the redder RGB being marginally more centrally concentrated than the SGBb and bluer RGB. Therefore a search of different radial distributions in the HB stars has been carried out. Although the E-BHB stars are usually explained as being a helium-enhanced second-generation subpopulation (e.g., Norris, 2004; Piotto et al., 2005; Lee et al., 2007), we are not able to radially distinguish the E-BHB from the rest of the stars on the horizontal branch. This may mean that the E-BHB stars are not exclusively a second-generation subpopulation, as also seen with the E-BHB of NGC 2808 (Iannicola et al., 2009) and the E-BHB of Cen (Moehler et al., 2011). However, the small numbers of E-BHB stars at large cluster radii limit the significance of this interpretation.
Combining our photometry with the proper-motion cleaned sample by Zloczewski et al. (2013), we find at least one “gap” and two over-densities on the blue HB. Although the gap is located in an unusual part of the HB, at =14.6 mag and in the middle of the so-called hot HB stars, the over-density at =26 is also seen in NGC 6273 (Piotto et al., 1999), suggesting that there may be some preference for stars to clump here.
References
- Alves-Brito et al. (2012) Alves-Brito, A., Yong, D., Meléndez, J., Vásquez, S., Karakas, A. I. 2012, A&A, 540, 3
- Anderson et al. (2003) Anderson, J., Cool, A., King, I. R. 2003, ApJ, 597, L137
- Arellano Ferro et al. (2012) Arellano Ferro, A., Bramich, D. M., Figuera Jaimes, R., Giridhar, S., & Kuppuswamy, K. 2012, MNRAS, 420, 1333
- Bailey (1902) Bailey, S. I. 1902, Harv. Ann., 38
- Bellazzini et al. (2008) Bellazzini, M., Ibata, R. A., Chapman, S. C., et al. 2008, AJ, 136, 1147
- Bellini (2009) Bellini, A., Piotto, G., Bedin, L. R., King, I. R., Anderson, J., Milone, A. P. & Momany, Y. 2009, A&A, 507, 1393
- Benedict et al. (2011) Benedict, G. F., McArthur, B. E., & Feast, M. W. et al. 2011, AJ, 142, 187
- Benkõ et al. (2010) Benkõ, J. M., Kolenberg, K., Szabó, R. et al. 2010, MNRAS, 409, 1585
- Blanco (1992) Blanco, V. 1992, AJ, 104, 734
- Blazhko (1907) Blazhko, S. 1907, Astr. Nachr., 175, 325
- Bono et al. (1997) Bono, G., Caputo, V., Castellani, V., & Marconi, M. 1997, A&AS, 121, 327
- Bono et al. (2007) Bono, G., Caputo, F., di Criscienzo, M. 2007, A&A, 476, 779
- Buchler & Kolláth (2011) Buchler, R.J. & Kolláth, Z. 2011, ApJ, 731, 24
- Butler (1973) Butler, D., Kraft, R.P., Miller, J.S. & Robinson, L.B. 1973, ApJ, 179, 73
- Buonanno (1993) Buonanno, R. 1993, in ASP Conf. Proc. 48, The Globular Cluster–Galaxy Connection, ed. G. H. Smith & J. P. Brodie (San Francisco: ASP), 131
- Cacciari et al. (2005) Cacciari, C., Corwin, T. M., & Carney, B. W. 2005, AJ, 129, 267
- Cardelli et al. (1992) Cardelli, J. A., Sembach, K. R., & Mathis, J. S. 1992, AJ, 104, 1916
- Cardelli et al. (1989) Cardelli, J.A., Clayton, G.C. & Mathis, J.S. 1989, ApJ, 345, 245
- Carretta & Gratton (1997) Carretta, E., & Gratton, R. G. 1997, A&AS, 121, 95
- Carretta et al. (2009a) Carretta, E., Bragaglia, A., Gratton, R. & Lucatello S. 2009a, A&A, 505, 117
- Carretta et al. (2009b) Carretta, E., Bragaglia, A., Gratton, R. & Lucatello S. 2009b, A&A, 505, 139
- Carretta et al. (2010a) Carretta, E., Bragaglia, A., Gratton, R. G., et al. 2010a, ApJ, 714, L7
- Carretta et al. (2010b) Carretta, E., Gratton, R. G., Lucatello, S. et al. 2010b, ApJ, 722, L1
- Cassisi et al. (2007) Cassisi, S., Potekhin, A.Y., Pietrinferni, A., Catelan, M. & Salaris, M. 2007, Apj, 661, 1094
- Cassisi et al. (2008) Cassisi, S., Salaris, M., Pietrinferni, A., Piotto, G., Milone, A. P., Bedin, L. R., & Anderson, J. 2008, ApJ, 672, L115
- Catelan et al. (1998) Catelan, M., Borissova, J., Sweigart, A.V. & Spassova, N. 1998, ApJ, 494, 265
- Catelan et al. (2004) Catelan, M., Pritzl, B.J., & Smith, H.A. 2004, ApJS, 154, 633
- Catelan & Cortés (2008) Catelan, M. & Cortés, C. 2008, ApJ, 676, L135
- Catelan (2009) Catelan, M. 2009, Ap&SS, 320, 261
- Cho et al. (1998) Cho, D.H., Lee, S.-W. & Sung, H. 1008 JKAS, 31, 67
- Clement & Walker (1991) Clement, C.M. & Walker, I.R. 1991, AJ, 101, 1352
- Clement & Shelton (1999) Clement, C.M. & Shelton, I. 1999, ApJ, 515, L85
- Clement et al. (2001) Clement, C.M. et al. 2001, AJ, 121, 2587
- Clementini et al. (2003) Clementini, G., Raffaele, G., Bragaglia, A., Carretta, E., Di Fabrizio, L & Maio, M. 2003, AJ, 125, 1309
- Cohen (2010) Cohen, J.G., Kirby, E.N., Simon, J.D. & Geha, M. 2010, ApJ, 725, 288
- Corwin (2003) Corwin, T.M., Catelan, M., Smith, H.A., Borissova, J., Ferraro, F.R. & Raburn, W.S. 2003, AJ, 125, 2543
- Corwin et al. (2008) Corwin, T.M., Borissova, J., Stetson, P.B. et al. 2008, AJ, 135, 1459
- Crocker (1988) Crocker D. A., 1988, AJ, 96, 1649
- Crocker (1988) Crocker, D. A., Rood, R. T., & O’Connell R.W. 1988, ApJ, 332, 236
- D’Antona & Caloi (2008) D’Antona, F. & Caloi, V. 2008, MNRAS, 390, 693
- D’Ercole et al. (2008) D’Ercole, A., Vesperini, E., D’Antona, F., McMillan, S. L. W., & Recchi, S. 2008, MNRAS, 391, 825
- Decressin et al. (2010) Decressin, T., Baumgardt, H., Charbonnel, C., & Kroupa, P. 2010, A&A, 516, A73
- Da Costa et al. (2009) Da Costa, G. S., Held, E. V., Saviane, I. & Gullieuszik, M. 2009, ApJ, 705, 1481
- di Criscienzo et al. (2011) di Criscienzo, M. et al., 2011, MNRAS, 414, 3381
- Dixon et al. (1996) Dixon,W. V. D., Davidsen, A. F., Dorman, B., & Ferguson, H. C. 1996, AJ, 111, 1936
- Fitch & Szeidl (1976) Fitch, W. S. & Szeidl, B. 1976, ApJ, 203, 616
- Ferraro et al. (1992) Ferraro, F. R., Clementini, G., Fusi Pecci, F., Sortino, R., & Buonanno, R. 1992, MNRAS, 256, 391
- Ferraro et al. (2009) Ferraro, F.R., Dalessandro, E., Mucciarelli, A. et al. 2009, Nature, 462, 483
- Freeman & Rodgers (1975) Freeman, K. C. & Rodgers, A. W. 1975, ApJ, 201, L71
- Gratton et al. (2011) Gratton, R. G., Lucatello, S., Carretta, E., Bragaglia, A., D’Orazi, V. & Momany, Y. 2011, A&A, 534, 123
- Gratton et al. (2012) Gratton, R.G. et al. 2012a, A&A, 539, 19
- Gratton et al. (2013) Gratton, R.G., Lucatello, S., Sollima, A., et al. 2013, A&A, 549, 41
- Grundahl et al. (1998) Grundahl, F., VandenBerg, D. A., & Andersen, M. I. 1998, ApJ, 500, L179
- Grundahl et al. (1999) Grundahl, F., Catelan, M., Landsman, W.B., Stetson, P.B., & Andersen, M.I. 1999, ApJ, 524, 242
- Guldenschuh et al. (2005) Guldenschuh, K. A. et al. 2005, PASP, 117, 721
- Johnson & Pilachowski (2012) Johnson, C.I. & Pilachowski, C.A. 2012, 754, 38
- Harris (1996) Harris, W. E. 1996, AJ, 112, 1487
- Harris & Racine (1979) Harris W. E., Racine R., 1979, ARA&A, 17, 241
- Hesser (1976) Hesser J. E., 1976, PASP, 88, 849
- Hesser et al. (1977) Hesser, J. E., Hartwick, F. D. A., & McClure, R. D. 1977, ApJS, 33, 471
- Hesser & Harris (1979) Hesser, J. E., & Harris, G. L. H. 1979, ApJ, 234, 513
- Hesser & Hartwick (1979) Hesser, J. E. & Hartwick, F.D.A. 1979 ApJ 234, 513
- Hoffleit (1972) Hoffleit, D. 1972, IBVS, 660
- Iannicola et al. (2009) Iannicola, G., Monelli, M., Bono, G. et al. 2009, ApJ, 696, 120
- Jurcsik et al. (2009) Jurcsik, J., et al. 2009, MNRAS, 400, 1006
- Kraft & Ivans (2003) Kraft, R. P. & Ivans, I. I. 2003, PASP, 115, 143
- Kaluzny & Thompson (2001) Kaluzny, J. & Thompson, I. B. 2001, A&A, 373, 899
- Kinman & Brown (2010) Kinman, T.D. & Brown, W.R. 2010, AJ, 139, 2014
- Klepikova (1956) Klepikova, L. A. 1956, Perem. Zvezdy (Var. Stars), 11, 1
- Kravtsov et al. (1994) Kravtsov, V V., Samus, N. N., Alcaino, G. & Liller, W. 1994, Ast. Letters, 20, 339
- Kolenberg (2011) Kolenberg, K. 2011, Carnegie Observatories Astroph. Ser., 5, 100
- Kuehn et al. (2011) Kuehn, C.A., Smith, H.A., Catelan, M., Pritzl, B.J., De Lee, N. & Borissova, J. 2011, AJ, 142, 107
- Kunder et al. (2008) Kunder, A., Popowski, P., Cook, K. H., Nikolaev, S., & Chaboyer, B. 2008, AJ, 135, 631
- Kunder et al. (2010) Kunder, A.M., Chaboyer, B. 2009, & Layden, A. 2010 AJ, 139, 415
- Kunder et al. (2011) Kunder, A.M., Walker, A.R., Stetson, P.B. et al. 2011, AJ, 141, 15
- Kunder et al. (2013a) Kunder, A., Salaris, M., Cassisi, S., de Propris, R., Walker, A., Stetson, P.B., Catelan, M. & Amigo, P. 2013, AJ, 145, 25
- Kunder et al. (2013b) Kunder, A., Stetson, P.B., Catelan, M., Walker, A. & Amigo, P., 2013, AJ, 145, 33
- Lardo et al. (2011) Lardo, C., Bellazzini, M., Pancino, E., Carretta, E., Bragaglia, A. & Dalessandro, E. 2011, A&A, 525, 114
- Landolt (1973) Landolt, A.U. 1973, AJ, 78, 959
- Landolt (1983) Landolt, A.U. 1983, AJ, 88, 439
- Landolt (1992) Landolt, A.U. 1992, AJ, 104, 340
- Layden (1998) Layden, A.C. 1998, AJ, 115, 193;
- Layden & Sarajedini (2000) Layden, A.C. & Sarajedini, A. 2000, AJ, 119, 1760
- Layden & Sarajedini (2003) Layden, A. & Sarajedini, A. 2003, AJ, 125, 208
- Le Borgne et al. (2007) Le Borgne, L. F., Vandenbroere, J., Poretti, E., Klotz, A., Boër, D. Y., Martignoni, M., & Acerbi, F. 2007, A&A, 476, 307
- Le Borgne et al. (2012) Le Borgne, J.-F., Klotz, A., Poretti, E. AJ, 144, 39
- Lee et al. (1994) Lee, Y.-W., Demarque, P., & Zinn, R. 1994, ApJ, 423, 248
- Lee et al. (2007) Lee, Y.-W., Gim, H.B., & Casetti-Dinescu, D.I. 2007, ApJ, 661, 49L
- Lee et al. (2009) Lee, J.-W., Kang, Y.-W., Lee, J., & Lee, Y.-W. 2009, Nature, 462, 480
- Joo & Lee (2013) Joo, S.-J. & Lee, Y.-W. 2013, ApJ, 762, 36
- Lloyd Evans (1978) Lloyd Evans, T. 1978, MNRAS, 182, 293
- Mackey & van den Bergh (2005) Mackey, A. D., & van den Bergh, S. 2005, MNRAS, 360, 631
- Mateo et al. (1995) Mateo, M., Udalski, A., Szymanski, M., Kaluzny, J., Kubiak, M., & Krzeminski, W. 1995, AJ, 109, 588
- Marconi (2009) Marconi, M. 2009, AIPC, 1170, 223
- Marconi et al. (2011) Marconi, M., Bono, G., Caputo, F., Piersimoni, A.M., Pietrinferni, A., Stellingwerf, R. F. 2011, ApJ, 738, 111
- Marino et al. (2008) Marino A. F., Villanova S., Piotto G., Milone A. P., Momany Y., Bedin L. R., Medling A. M., 2008, A&A, 490, 625
- Marino et al. (2009) Marino, A. F., Milone, A. P., Piotto, G., Villanova, S., Bedin, L. R., Bellini, A. & Renzini, A. 2009, A&A, 505, 1099
- Marino et al. (2011a) Marino, A. F., Sneden, C., Kraft, R. P., et al. 2011a, A&A, 532, 8
- Marino et al. (2011b) Marino, A. F., Villanova, S., Milone, A. P., Piotto, G.; Lind, K., Geisler, D. & Stetson, P. B., 2011b, ApJ, 730, 16
- Marino et al. (2012a) Marino, A. F., Milone, A. P., Sneden, C. et al. 2012a, A&A, 541, 15
- Marino et al. (2012b) Marino, A. F., Milone, A. P., Piotto, G., et al. 2012b, ApJ, 746, 14
- Marino et al. (2013) Marino, A. F., Milone, A. P. & Lind, L. 2013, accepted in ApJ, arXiv:1302.5870
- McCall (2004) McCall, M.L. 2004, AJ, 128, 2144
- Milone et al. (2009) Milone, A. P., Stetson, P. B., Piotto, G., Bedin, L. R., Anderson, J., Cassisi, S. & Salaris, M. 2009, A&A, 503, 755
- Milone et al. (2012a) Milone, A. P., Piotto, G., Bedin, L. R., Marino, A. F., Momany, Y. & Villanova, S. 2012a, MSAIS, 19, 173
- Milone et al. (2012b) Milone, A. P., Piotto, G., Bedin, L. R. et al. 2012b, ApJ, 744, 58
- Mironov (1972) Mironov, A. V. 1972, AZh, 49, 134
- Moehler et al. (2011) Moehler, S., Dreizler, S., Lanz, T. et al. 2011, A&A, 526, A136
- Monaco et al. (2004) Monaco, L., Pancino, E., Ferraro, F.R. & Bellazzini, M. 2004, MNRAS, 349, 1278
- Monelli et al. (2013) Monelli, M., Milone, A.P., Stetson, P.B. et al. 2013, arXiv:1303.5187
- Moskalik & Poretti (2003) Moskalik, P. P̂oretti, E. 2003, A&A, 398, 213
- Mucciarelli et al. (2012) Mucciarelli, A., Bellazzini, M., Ibata, R., Merle, T., Chapman, S. C., Dalessandro, E. & Sollima, A. 2012, MNRAS, 426, 2889
- Norris (2004) Norris J. E., 2004, ApJ, 612, L25
- Norris & Freeman (1983) Norris, J., & Freeman, K. C. 1983, ApJ, 266, 130
- Norris & Da Costa (1995) Norris, J. E. & Da Costa, G. S. 1995, ApJ, 447, 680
- Pancino et al. (2002) Pancino, E., Pasquini, L., Hill, V., Ferraro, F. R., & Bellazzini, M. 2002, ApJ, 568, L101
- Peniche et al. (1989) Peniche, R., Pena, J.H., Gomez, T. & Parrao, L. 1989, A&A, 209, 59
- Pietrinferni et al. (2004) Pietrinferni, A., Cassisi, S., Salaris, M., & Castelli, F. 2004, ApJ, 612, 168
- Pietrinferni et al. (2006) Pietrinferni, A., Cassisi, S., Salaris, M., & Castelli, F. 2006, ApJ, 642, 797
- Pietrinferni et al. (2009) Pietrinferni, A., Cassisi, S., Salaris, M., Percival, S. & Ferguson, J.W. 2009, ApJ, 697, 275
- Pietrukowicz & Kaluzny (2003) Pietrukowicz, P. & Kaluzny, J. 2003, AcA, 53, 371
- Pietrukowicz et al. (2005) Pietrukowicz, P., Kaluzny, J., Thompson, I. B., Jaroszynski, M., Schwarzenberg-Czerny, A., Krzeminski, W., Pych, W., 2005, Ac. Ast., 55, 261
- Pietrukowicz et al. (2012) Pietrukowicz, P., Udalski, A., Soszyński, I. et al. 2012, ApJ, 750, 169
- Piotto et al. (1999) Piotto, G., Zoccali, M., King, I.R., Djorgovski, S.G., Sosin, C., Rich, R.M. & Meylan, G. 1999, AJ, 118, 1727
- Piotto et al. (2005) Piotto G. et al., 2005, ApJ, 621, 777
- Piotto et al. (2007) Piotto G. et al., 2007, ApJ, 661, L53
- Piotto et al. (2012) Piotto, G., Milone, A. P., Anderson, J., et al. 2012, ApJ, 760, 39
- Pritzl et al. (2000) Pritzl, B. J., Smith, H. A., Catelan, M., & Sweigart, A. V. 2000, ApJ, 530, 41
- Pritzl et al. (2001) Pritzl, B. J., Smith, H. A., Catelan, M., & Sweigart, A. V. 2001, AJ, 122, 2600
- Pojmański (2000) Pojmański, G. Acta Astronomica 50, 177, 2000
- Richter et al. (1999) Richter, P.; Hilker, M.; Richtler, T. 1999, A&A, 350, 476
- Ripepi et al. (2007) Ripepi, V., Clementini, G., Di Criscienzo, M. et al. 2007, ApJ, 667, 61
- Robin et al. (2003) Robin, A.C., Reylé, C., Derrière, S. & Picaud, S. 2003, A&A, 409, 523
- Rood & Crocker (1989) Rood, R. T., & Crocker, D. A. 1989, in IAU Colloq. 111, The Use of Pulsating Stars in Fundamental Problems of Astronomy, ed. E. G. Schmidt (Cambridge: Cambridge Univ. Press), 103
- Salaris et al. (2008) Salaris, M., Cassisi, S., & Pietrinferni, A. 2008, ApJL, 678, L25
- Sandage (1990) Sandage, A. 1990, ApJ, 350, 603
- Saviane et al. (2012) Saviane, I., da Costa, G. S., Held, E. V., Sommariva, V., Gullieuszik, M., Barbuy, B. & Ortolani, S. 2012, A&A, 540, 27
- Sawyer (1944) Sawyer, H. B. 1944, DDO Publ., 1, No. 15
- Sbordone et al. (2011) Sbordone, L., Salaris, M., Weiss, A. & Cassisi, S. 2011, A&A, 534, 9
- Schlafly & Finkbeiner (2011) Schlafly, E.F. & Finkbeiner, D.P. 2011, ApJ, 737, 103
- Schlegel et al. (1998) Schlegel, D.J., Finkbeiner, D.P. & Davis, M. 1998, ApJ, 500, 525
- Schultz & Wiemer (1975) Schultz, G. V., & Wiemer, W. 1975, A&A, 43, 133
- Shapley (1927) Shapley, H. 1927, Harv. Bull., 848
- Sódor et al. (2012) S dor, A., Jurcsik, J., Molnár, L. et al. 2012, ASPC, 462, 228
- Sollima et al. (2006) Sollima, A., Borissova, J., Catelan, M., Smith, H. A., Minniti, D., Cacciari, C. & Ferraro, F. R. 2006, ApJ,L 640, 43
- Sollima et al. (2007) Sollima, A., Ferraro, F. R., Bellazini, M., et al. 2007, ApJ, 654, 915
- Sollima et al. (2010) Sollima, A., Cacciari, C., Bellazzini, M. & Colucci, S. 2010, MNRAS, 406, 329
- Stetson (1987) Stetson, P.B. 1987, PASP, 99, 191
- Stetson (1990) Stetson, P.B. 1990, PASP, 102, 932
- Stetson (1994) Stetson, P.B. 1994, PASP, 106, 250
- Stetson (2000) Stetson, P.B. 2000, PASP, 112, 925
- Stetson et al. (2003) Stetson, P.B., Bruntt, H. & Grundahl, F. 2003, PASP, 115, 41
- Stetson (2005) Stetson, P.B., Catelan, M. & Smith, H.A. 2005, PASP, 117, 1325
- Sturch (1966) Sturch, C. 1966, ApJ, 143, 774
- Szabo et al. (2010) Szabo et al. MNRAS, 409, 1244, 2010
- van Albada & Baker (1971) van Albada, T.S., & Baker, N. 1973, ApJ, 185, 477
- Walker (1990) Walker, A.R. 1990, AJ, 100, 1532
- Walker (1994) Walker, A.R. 1994, AJ, 108, 555
- Walker (1998) Walker, A.R. 1998, AJ, 116, 220
- Walker et al. (2011) Walker, A.R., Kunder, A.M. & Andreuzzi, G. 2011, MNRAS, 415, 643
- Wehlau & Sawyer Hogg (1977) Wehlau, A. & Sawyer Hogg, H. 1977, AJ, 82, 137
- Wehlau & Sawyer Hogg (1978) Wehlau, A. & Sawyer Hogg, H. 1978, AJ, 83, 946
- Zinn & West (1984) Zinn, T. & West, M.J. 1984, ApJS 55,45
- Zloczewski et al. (2013) Zloczewski, K., Kaluzny, J., Rozyczka, M., Krzeminski, W., Mazur, B. & Thompson, I. B. 2013, arXiv1301.1198
- Zoccali et al. (2009) Zoccali, M., Pancino, E., Catelan, M., et al. 2009, ApJ, 697, L22
- Zorotovic et al. (2010) Zorotovic, M. et al. 2010, AJ, 139, 357