Diagnosis of the Wavelength Stability of a Mid-Infrared Free-Electron Laser
Wavelength stability of free-electron lasers (FELs) is one of the important parameters for various applications. In this paper we describe two different methods to diagnose the wavelength stability of a mid-infrared (MIR) FEL. The first one is based on autocorrelation which is usually used to measure the pulse duration, and the second one is based on frequency upconversion through sum-frequency mixing (SFM).
PACS numbers: 41.60.Cr, 42.65.Ky, 06.60.Jn, 07.57.Ty
I INTRODUCTION
FELs have been deployed for various applications in the wide (from X-ray to microwave [1]) wavelength ranges, many of which are out of reach with conventional lasers. In the MIR region, the FELs are extensively utilized in spectroscopic applications such as molecular vibrational spectroscopy [2, 3]. In such applications, the spectral profile of FELs and its stability is one of the important concerns of scientists working in this field.
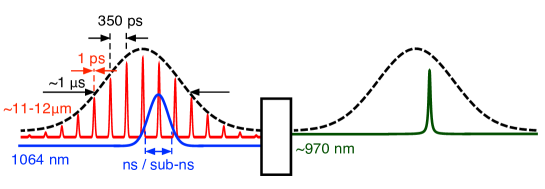
Unlike any conventional optical laser with gas, liquids, or solid-state lasing medium, FELs lase in use of electron beams as a gain medium. In Fig. 1 we schematically show the temporal structure of the emission from Kyoto University free-electron laser (KU-FEL), a MIR oscillator-type FEL that runs at 5-13 m wavelength [4], with an overall macropulse envelope of 1 s duration containing a continuous train of much shorter micropulses of 1 ps length each, separated from each other by 350 ps intervals.
To determine the spectra and the stability of the FEL in the MIR region, conventional approaches involve the use of array detectors or scanning monochromators in this spectral region. Employment of such instrument is typically costly, and the achievable spectral and temporal resolution is somehow limited. In order to obtain comparable or better results with more cost-effective instrumentation, we present two different methods in this paper, one of which is a method based on the retrieval of spectral information from intensity autocorrelation (IAC) and fringe-resolved autocorrelation (FRAC) measurements, and the other is based on upconversion of MIR pulse spectrum into the NIR region by SFM.
II AUTOCORRELATION-BASED METHOD
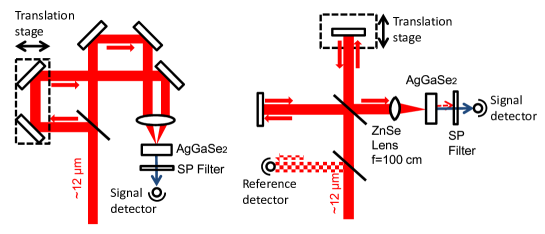
In this section we demonstrate the autocorrelation-based method. IAC and FRAC have long been used in measurements of ultrashort FEL pulses [5]. By investigating the overall envelope of the FRAC signal, we pointed out that we are able to derive the wavelength stability of the oscillator-type FEL [6]. Experimentally, we measure the pulse duration of the micropulses from KU-FEL by IAC for the first step, whose setup is shown in Fig. 2 together with the experimental setup of the FRAC measurement. The autocorrelation fringe is measured to be 0.90 ps wide. Under the assumption that the micropulse has a Gaussian temporal shape, the micropulse duration is calculated to be 0.64 ps. In the FRAC measurement, the FEL beam is split and recombined in the same way as in a Michelson interferometer. The length of one arm of the interferometer is subject to the fine adjustment by scanning a motorized translation stage with 2 m steps (round trip). As the KU-FEL runs at 12 m wavelength, this step length is much smaller than the wavelength and is able to resolve the interference fringes.The time-delayed pulse pair is focused by a ZnSe lens (f=100 mm) onto a piece of nonlinear (AgGaSe2) crystal of 1 mm thickness to generate the second harmonic (SH). A short-pass filter of 7.55 m cutoff wavelength blocks the fundamental wave and the transmitted SH at 6 m wavelength is detected by a joulemeter (Gentec. EO, model QE8SP-I-BL-BNC). To avoid the influence of shot-to-shot pulse energy fluctuation of the FEL, a small portion of the FEL pulse is split by a pellicle beam splitter and is recorded by another identical joulemeter as a reference signal. We define the autocorrelation signal as .
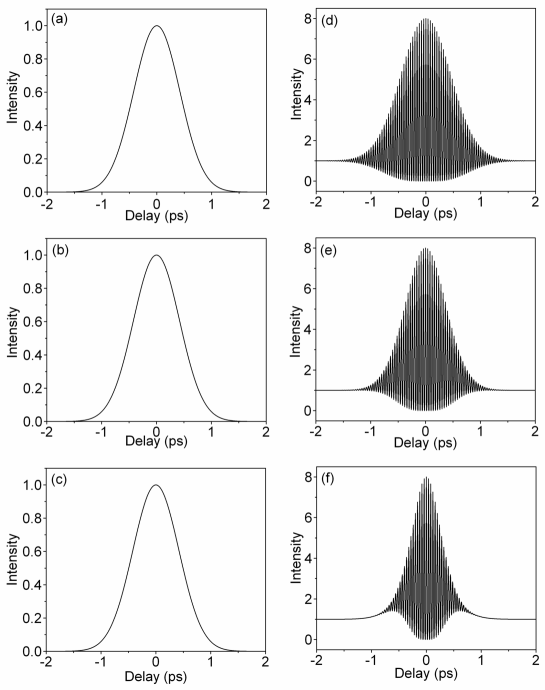
We notice that the deviation of wavelength from the mean FEL wavelength changes the autocorrelation signals. The modulation period of the FRAC signal is a direct measure of the optical period corresponding to the laser wavelength. If various wavelength components exist, they induce various modulation periods in their own FRAC signals and the summation of such modulated FRAC signals averages out the fringes except for those around the center of the signal, where the delay is 0. Larger variation of wavelength induces more narrowing-down on the FRAC signal, so that it is possible to retrieve the degree of wavelength fluctuation from the narrowing down of the measured FRAC signal width. For visualization of this effect, we present in Fig. 3 three sets of representative calculated IAC and FRAC results with the micropulse duration assumed to be 0.7 ps and the central wavelength to be 12 m. These calculations are done with relative wavelength fluctuations () of 0, 1%, and 2%, respectively.
To extract the fluctuation information, we make assumptions that,
1. the spectral shape of each FEL micropulse is Gaussian.
2. the distribution of the FEL wavelength is Gaussian.
3. each micropulse is linearly chirped with unknown chirp rate .
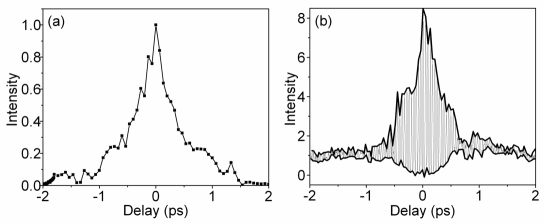
In Fig. 4 we present preliminary results for the IAC and FRAC signals obtained at 12 m with KU-FEL. At present the quality of the signals is rather low, and we must make efforts to improve the signal quality. But in principle, with the knowledge of micropulse duration obtained via IAC measurement, we should be able to fit the upper and lower envelopes of the measured FRAC signals to estimate the wavelength stability of KU-FEL, which is the way we proposed in Ref. [6]. Upon trying the fitting for wavelength stability and chirp rate with the measurement data, we find that the chirp and the wavelength fluctuation affects the narrowing-down of the FRAC signal in much the same manner, so that it is difficult to separate which contribution is how much. Nevertheless, it is feasible to make a conservative estimation of wavelength fluctuation among micropulses by assuming the chirp to be negligible. By fitting the obtained envelopes of the FRAC signal under the no chirp assumption, we find the upper limit of micropulse wavelength fluctuation to be 1.4% of the mean central wavelength of the FEL.
III FREQUENCY-UPCONVERSION-BASED METHOD
In this section we demonstrate the spectroscopic analysis of the FEL spectrum by utilizing the method based on upconversion of the MIR spectrum into the NIR region, where commercial spectrometers are readily available at low cost. The upconversion is realized by the SFM process to mix the FEL pulse with another NIR laser pulse. Upconversion-based techniques [7, 8] have been used in MIR spectroscopy [9, 10, 11, 12], and upconversion by mixing the THz FEL pulses with a continuous-wave laser has recently been reported [13]. In our case, however, it is not a priori obvious whether we can apply this technique for the KU-FEL pulses because of the complication of the temporal structure of oscillator-type FELs, i.e., the dual pulse structure as shown in Fig. 1. The train of ultrashort micropulses may damage the nonlinear crystal even if the peak intensity of one isolated micropulse is below the damage threshold. Also the ultrashort duration of micropulses brings difficulty in synchronization between the two lasers. To overcome the effect of timing jitter, we use much longer nanosecond or sub-nanosecond NIR laser for the SFM process, tolerating the loss of most of the NIR pulse energy due to mismatching of the pulse durations.
The experimental setup for SFM is similar to our recent work presented in Ref. [14], and shown in Fig. 5. The KU-FEL is synchronized to the Q-switch trigger of an external NIR laser, so that both lasers run at 1Hz repetition rate. The delay between the FEL and NIR laser pulses is controlled by a delay generator (SRI, model DG645), so that the NIR laser pulse coincides with the FEL pulse on the crystal. A pellicle beam splitter reflects a small portion of the FEL pulse onto a mercury cadmium telluride (MCT) detector which measures the macropulse shape of the FEL. The pulse shape is monitored and recorded on an oscilloscope together with the emission synchronization signal from the NIR laser, which gives the information of which specific micropulses overlap with the NIR pulse. The recorded pulse shape is also used in the offline analysis afterwards. We have two choices for the NIR laser source, namely a Q-switched multi-mode Nd:YAG laser (LOTIS TII, model LS-2136) and an actively Q-switched single-mode microchip laser (Standa, model STANDA-Q1). The parameters of the NIR laser employed in the experiment are shown in Table 1. For clarity, all the parameters and results presented in this paper involve only the YAG laser as an NIR source unless otherwise stated.
| YAG laser | microchip laser | |
|---|---|---|
| emission jitter (ns) | 50 | 0.35 |
| pulse duration (ns) | 20 | 0.8 |
| pulse energy (mJ) | 5 | 0.1 |
| diameter on the crystal (mm) | 1 | 0.5 |
| intensity at focus (MW/cm2) | 25 | 50 |
| linewidth (nm) | 0.45 |
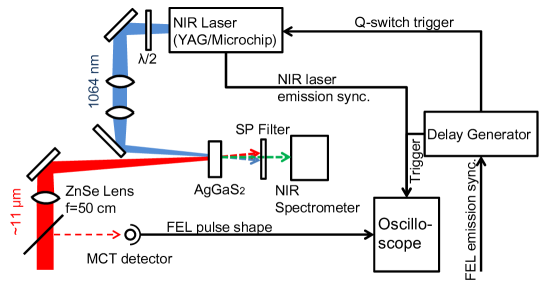
To match the polarization of the FEL and NIR lasers for type I SFM, a half-wave plate rotates the linear polarization of the NIR laser to vertical direction, identical to that of the FEL. The FEL pulse is focused by a ZnSe lens (f = 50 cm), and the NIR pulse is also focused by a BK7 lens of the same focal length and reflected at right angle to be almost parallel with the FEL, leaving 0.9∘ angle between the two. In order to avoid damage on the crystal, the crystal is placed at off-focus so that the beam diameter on the entrance facet is 1 mm. The nonlinear crystal we use is a piece of silver thiogallate (AgGaS2) of 2 mm thickness, cut at 37∘ angle, which guarantees 0.7 m wavelength bandwidth and 6.5∘ angular bandwidth for the 11 m FEL light in the type I SFM process. The upconverted pulses at 970 nm wavelength exit from the opposite facet of the crystal and is collected and detected by a commercial VIS-NIR spectrometer (OceanOptics, model HR4000CG-UV-NIR). The spectrometer has a 5 m entrance slit and 300 grooves/mm gratings, resulting in 0.75 nm spectral resolution. The 10 s exposure (shortest hardware exposure) of the spectrometer is triggered by the delay generator, so that the SFM pulses are always detected and the stray light from the surroundings is kept minimum, whose contribution to the background noise is conveniently subtracted by the built-in data processing of the spectrometer itself. In order to prevent the undesired laser pulses at both 11 m and 1064 nm from interfering with the spectral measurement, a short-pass filter of 1000 nm cut-off wavelength is placed between the exit facet of the crystal and the spectrometer.

Because of the 0.75 nm spectral resolution of the spectrometer, the measured raw spectra of the upconverted 970 nm pulses look wider than they actually are. In order to retrieve the actual spectra, we measure the spectrum of another narrow-bandwidth laser with the spectrometer to obtain its instrumental function, and use it for deconvolution of the raw spectra data. After the deconvolution, the upconverted spectra in the NIR region is easily transferred back to the MIR FEL spectra by the wavelength transformation
| (1) |
Although the 0.75 nm spectral broadening caused by the spectrometer resolution is reduced by the deconvolution processing, the 0.45 nm linewidth of the multi-mode YAG laser cannot be removed from the measurement results, which remains as the main limitation of the spectral resolution of the SFM-based measurements with conventional multi-mode YAG laser as the NIR light source. However, the nearly transform-limited microchip laser, which is single-mode and has much smaller linewidth (3.710-3 nm), can be used in place of the multi-mode YAG laser and makes this broadening effect negligible.
In Fig. 6 we present the raw and deconvolved SFM spectra (left column), and the retrieved FEL spectra (right column) for three different FEL macropulses. The NIR pulse emission delay was fixed so that the NIR pulse arrives at 1.2 s after the intensity maximum of the FEL macropulse for these measurements. Although the 50 ns emission jitter of the YAG laser makes it difficult to cover exactly the same group of micropulses from one macropulse to another, and the 20 ns YAG laser pulse results in the SFM spectrum contributed by about 57 micropulses which is much more than a single micropulse, it is still acceptable because this SFM-based technique is intended to be used in investigating the relatively slow evolution of FEL emission conditions in s temporal scale, which is more than one order of magnitude larger than the temporal uncertainty brought by the jitter of YAG laser or the pulse duration. The microchip laser which has much smaller emission jitter and pulse duration (See Table 1) can solve the issues when precise knowledge of the timing is required and when single-micropulse spectra are under investigation.
The overall spectral resolution of the system is limited to 10 cm-1 with the YAG laser, and is improved to 7 cm-1 if the transform-limited narrow bandwidth microchip laser is used as the NIR source. The major limiting factor of the spectral resolution is the resolution of the spectrometer itself. By changing to a high-resolution NIR spectrometer which is available at a reasonable cost, the overall resolution can be improved to 1.2 cm-1.
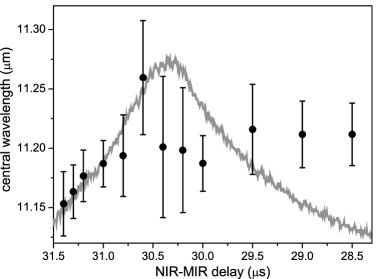

We characterize the FEL wavelength stability by the fluctuation of its central wavelength (defined by center-of-mass), and investigate the wavelength fluctuation by making repeated measurements with different delays between the FEL and NIR lasers. The results are shown in Fig. 7. We see that even at a fixed timing, the FEL central wavelength has large fluctuations, which is in the order of 0.1 m, or 1% of the central wavelength. This measured value of wavelength stability is in consistency with the evaluation made by the autocorrelation-based method, which estimates the fluctuation of the central wavelength to be 1.4% of the mean central wavelength. As the stability value is estimated based on measurements of fixed timing, it corresponds only to the wavelength fluctuation of the temporally selected 50 micropulses out of several thousands of micropulses in a single macropulse. Fluctuation estimated this way is reasonably smaller than the FRAC evaluation, which retrieves the fluctuation over the whole macropulse.
To find the reason of large fluctuation, we now fix the NIR pulse timing at the intensity maximum of the FEL macropulse, and plot the measured central wavelength with respect to the macropulse energy. The results are shown in Fig. 8. Because the fluctuation of FEL macropulse energy results in large error bar, we do not find any significant correlation between the central wavelength and the macropulse energy. Nevertheless, it is clear that the temporal selectivity of the SFM-based analysis would provide promising means for further investigation to clarify the correlation between the electron beam quality and FEL beam quality, etc., which will help understanding the lasing mechanisms of FELs.
IV CONCLUSIONS
In this paper we have described two different methods to diagnose the wavelength stability of KU-FEL, which is an oscillator-type FEL. The first method is an autocorrelation-based method, and the FEL wavelength fluctuation is extracted through the analysis on the FRAC signals. The second method is a frequency-upconversion-based method, which converts the FEL spectra in MIR region into the NIR region through SFM processes. Neither of these methods requires the use of costly instruments which are often used for the MIR spectral analysis, such as scanning MIR monochromators and array MIR detectors. Although we will have to make some efforts to improve the data quality taken by the first method, we are close to the stage where we are able to estimate the wavelength stability of KU-FEL based on the principle reported in our previous work [6]. The employment of the diagnosis methods we have described in this paper will help the understanding of the lasing mechanisms.
Acknowledgements
We acknowledge Professor Tetsuo Sakka for the loan of the VIS-NIR spectrometer. We also acknowledge Tokyo Instruments Inc. for the loan of the Nd:YAG laser.
References
- [1] P. G. O’Shea and H. P. Freund, Science 292, 1853 (2001).
- [2] D. Zimdars, A. Tokmakoff, S. Chen, S. R. Greenfield, M. D. Fayer, T. I Smith, and H. A. Schwettman, Phys. Rev. Lett. 70, 2718 (1993).
- [3] J. C. Tully, Science 312, 1004 (2006).
- [4] H. Ohgaki, T. Kii, K. Masuda, H. Zen, S. Sasaki, T. Shiiyama, R. Kinjo, K. Yoshikawa, and T. Yamazaki, Jpn. J. Appl. Phys. 47, 8091 (2008).
- [5] J. C. M. Diels, J. J. Fontaine, I. C. McMichael, and F. Simoni, Appl. Opt 24, 1270 (1985)
- [6] Y. Qin, T. Nakajima, T. Kii, and H. Ohgaki, Jpn. J. Appl. Phys. 51, 102704 (2012).
- [7] J. Shah, IEEE J. Quantum Elect. 24, 276 (1988).
- [8] E. J. Heilweil, Opt. Lett. 14, 551 (1989).
- [9] K. J. Kubarych, M. Joffre, A. Moore, et al., Opt. Lett. 30, 1228 (2005).
- [10] M. DeCamp and A. Tokmakoff, Opt. Lett. 30, 1818 (2005).
- [11] C. Baiz and K. Kubarych, Opt. Lett. 36, 187 (2011).
- [12] J. Zhu, T. Mathes, A. D. Stahl, J. T. M. Kennis, and M. L. Groot, Opt. Express 20, 10562 (2012).
- [13] F. J. P. Wijnen, G. Berden, and R. T. Jongma, Opt. Express 18, 26517 (2010).
- [14] X. Wang, T. Nakajima, H. Zen, T. Kii, and H. Ohgaki, Opt. Lett. 37, 5148 (2012).