A synchrotron jet from a post-AGB star.
Abstract
The evolution of low- and intermediate-initial-mass stars beyond the asymptotic giant branch (AGB) remains poorly understood. High-velocity outflows launched shortly after the AGB phase are thought to be the primary shaping mechanism of bipolar and multipolar planetary nebulae (PNe). However, little is known about the launching and driving mechanism for these jets, whose momentum and energy often far exceed the energy that can be provided by radiation pressure alone. Here, we report direct evidence of a magnetically collimated jet shaping the bipolar morphology of the circumstellar envelope of a post-AGB star. We present radio continuum observations of the post-AGB star IRAS 154455449 (OH 326.50.4) which has water masers tracing a fast bipolar outflow. Our observations confirm the earlier observed steep negative spectral index of the spectral energy distribution (SED) above GHz, and resolve, for the first time, the emission to originate from a radio jet, proving the existence of such jets around a post-AGB star. The SED is consistent with a synchrotron jet embedded in a sheath of thermal electrons. We find a close correspondence between the extent and direction of the synchrotron jet and the bipolar shape of the object observed at other wavelenghts, suggesting that the jet is responsible for the source morphology. The jet is collimated by a magnetic field of the order of mG at almost 7000 AU from the central star. We recover observations from the ATCA archive that indicate that the emission measure of the thermal component has increased by a factor of three between 1998 and 2005 after which it has remained constant. The short timescale evolution of the radio emission suggests a short lifetime for the jet. The observations of a synchrotron jet from a post-AGB star with characteristics similar to those from protostars and young stellar objects, for instance, suggest that magnetic launching and collimation is a common feature of astrophysical jets.
keywords:
stars: AGB and Post-AGB – late-type – circumstellar matter– magnetic field – acceleration of particles.1 Introduction
Synchrotron radiation is commonly detected towards relativistic jets emerging in high-energy astrophysical sources such as active galactic nuclei and quasars. It also has been detected towards a magnetized jet from a young stellar object (YSO) (Carrasco-González et al., 2010), where owing to density and temperature conditions, relativistic outflows were thought to be unlikely. The mechanism that leads to synchrotron emission involves the interaction between relativistic particles moving in a region where the dynamics are controlled by a magnetic field. Highly collimated outflows, similar to those seen toward YSOs, have also been found in the vicinity of post-Asymptotic Giant Branch (post-AGB) stars (Bujarrabal et al., 2001). If these high-velocity outflows are launched under the influence of strong magnetic fields, synchrotron emission could be expected. However, to date, no direct evidence of synchrotron radio emission exists from these high-velocity sources.
Post-AGB stars are thought to represent the group of stars that recently left the asymptotic giant branch (AGB) phase and will develop into a planetary nebula (PN) (van Winckel, 2003). During the evolution of low- and intermediate-initial-mass stars ( 1-8 M⊙) on the AGB, high mass-loss rates ( M⊙ yr-1) together with an acceleration mechanism, which drives the ejected material outwards, lead to the formation of a dense and extended circumstellar envelope (CSE). The CSE expands outwards in radial directions with constant velocity of order 10 km s-1. Generally, it is assumed that the mass-loss process is spherically symmetric during the AGB (Habing & Olofsson, 2003) and that asymmetries form in a short timescale before entering the PNe phase (e.g. Sahai et al. 2007). Therefore, the post-AGB is a key phase for the understanding of the evolution of the CSE, where the mechanism(s) responsible for shaping asymmetric PNe must become important. Binary systems, large-scale magnetic fields and interactions with substellar companions are among the proposed mechanisms that can generate aspherical CSEs (Balick et al., 2002). The evolution of the CSEs beyond the AGB often involves the interaction between a fast collimated wind, which could be created during the very last thermal pulses of the central star, and the steadily expanding CSE formed during the AGB. Strong evidence of this interaction and of the generation of strong shocks within the CSE, is the detection of post-AGB sources with water maser emission spread over unusually large velocity ranges ( km s-1) the so called water fountains (Likkel & Morris, 1988; Gómez et al., 2011). The peculiar H2O maser emission is thought to trace regions that have been swept up by a high-velocity outflow. Polarized H2O maser emission has also been detected towards water fountains, suggesting that the high-velocity outflow of at least one of the water fountain sources is collimated by the magnetic field (Vlemmings et al., 2006). Nevertheless, the lauching mechanism of high-velocity outflows in post-AGB stars, as well as the origin of the collimating magnetic field, are still under debate.
One of the 20 detected water fountains is IRAS 154455449, which has been classified as an evolved post-AGB star according to the MSX two-color diagram (Sevenster, 2002; Deacon et al., 2004). Observations have revealed H2O maser emission spread over km s-1, with the spectral features redshifted with respect to the systemic velocity of the source. Based on both satellite- and main-line OH maser observations, Deacon et al. (2007) suggested that km s-1. We note however, that the source has also been classified as a massive YSO candidate in the RMS survey, where radio continuum was detected at 3 cm (Urquhart et al., 2007), a classification that could be supported by the detection of relatively strong line emission of 13CO centered at kms-1 (Urquhart et al., 2007). However, if the 13CO is associated with IRAS 154455449, the central velocity of the line emission will define the of the source, and in that case, both the H2O and OH maser emission would arise from a blue-shifted outflow. Specifically, this would imply that the OH emission centered at km s-1 and spread over km s-1, originates in an outflow with velocity km s-1. This would correspond to the highest velocity Galactic OH maser and is very unlikely. Additionally, strong Galactic CO emission is known to occur around km-1, leading us to conclude that the 13CO emission is likely Galactic in origin and not associated with 154455449. Although a YSO classification cannot yet be ruled out, its classification as a post-AGB star is more likely.
The projected spatial distribution of the detected H2O maser features resemble a bow-shock structure at the red-shifted lobe, which is likely caused by a collimated outflow that pierces the steady-expanding CSE of the AGB phase (Pérez-Sánchez, Vlemmings & Chapman, 2011). Additionally, mid-infrared images confirm the bipolar morphology of this source (Lagadec et al., 2011). Finally, strong and seemingly non-thermal radio emission was detected and thought to arise from either the star itself or a shocked interaction region between the AGB envelope and a fast wind (Bains et al., 2009). Here we report observations indicating the radio continuum to originate from a jet.
2 Observations and results
2.1 Recent and archive observations
We performed observations of IRAS 154455449 with the Australia Telescope Compact Array (ATCA) on 2012 September 2. The 12-h observation run was carried out with the 6A array configuration, using 2 GHz bandwidths at 1.3 cm, 3 cm, 6 cm, and 16 cm. The observations with the 1.3 cm and 16 cm bands were carried out using the Compact Array Broadband Backend (CABB) mode 1 M-0.5 k, whereas the 3 cm and 6 cm bands were set up simultaneously with CABB mode 64 M-32 k. The four bands were set up in full polarization mode. The calibration and the imaging of the data were done using the package MIRIAD (Sault, Teuben & Wright, 1995). Bandpass and flux calibration were performed on the standard calibrator 1934638 and phase calibration was performed on 1613586. The flux densities for 1934638 were taken from the available models of this calibrator. The flux densities of 1613586 were determined in order to check the absolute flux calibration accuracy. The measured flux densities for this source are in agreement with the values presented in the ATCA calibrators database, within an uncertainty of less than . The bands at 3 cm, 6 cm, and 16 cm were split in two sub-bands each, in order to confirm a potential steep spectral index over the large fractional bandwidth at these wavelength. After calibration, the imaging of the source was performed using multifrequency synthesis. The different maps were deconvolved using the MIRIAD task MFCLEAN, with which Stokes I, Q, U and V images were produced. No linear or circular polarization was detected. Maps of smaller frequency ranges were created in order to test if the lack of linear polarization was due to a large rotation measure across the individual bands, but the emission was found to be unpolarized. We also retrieved radio continuum observations of IRAS 154455449 from the Australia Telescope Online Archive, the results of which are included in Table LABEL:tb:two.
2.2 Maps and spectral energy distribution
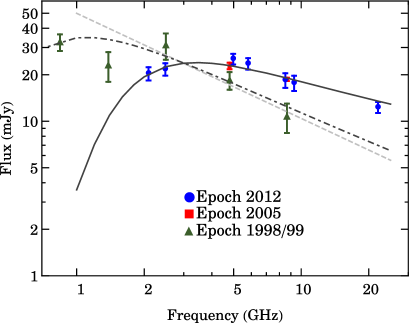
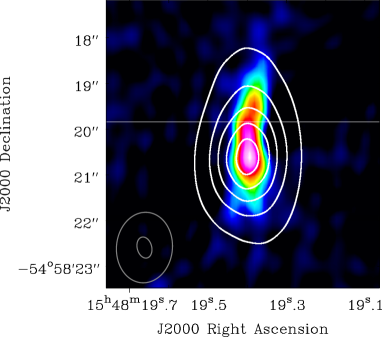
The derived flux densities, the beam size, and the rms of each map of IRAS 154455449 are listed in Table LABEL:tb:two for our observations in 2012, the observations in 2005 reported by Bains et al. (2009), and the data taken from the ATCA archive. The source was detected in 1998 at 0.84 GHz (D. Hunstead, private comunication; Murphy et al. (2007)). It was also detected during another survey between 2002 and 2004 at 8.6 GHz, with a flux density of 11.9 mJy (Urquhart et al., 2007). The observed spectral energy distribution (SED) of IRAS 154455449 at radio frequencies is characterized by a turn-over around GHz (Fig. 1) with a steep negative spectral index at higher frequencies. Between GHz and GHz the continuum emission has a spectral index . At 22 GHz we resolved the dense continuum emission along the north-south direction (Fig. 2) extending about 1.9 arcsec, which is consistent with the bipolar morphology seen in the mid-infrared image of the source (Fig. 3).
3 Analysis
| Epoch 2012a | Epoch 2005b | Epoch 1998/99 | ||||||
|---|---|---|---|---|---|---|---|---|
| Frequency | Flux | Beam | Frequency | Flux | Beam | Frequency | Flux | Beam |
| (GHz) | (mJy) | (arcsec2) | (GHz) | (mJy) | (arcsec2) | (GHz) | (mJy) | (arcsec2) |
| - | - | - | - | - | - | 0.84 | 32.54.1c | - |
| 2.1 | 20.360.14 | 5.63.0 | - | - | - | 1.4 | 23.05.3 | 7.64.9d |
| 2.5 | 21.720.05 | 4.72.6 | - | - | - | 2.5 | 31.26.2 | 3.33.0e |
| 5.0 | 25.410.04 | 1.91.5 | 4.8 | 22.811.11 | 5.62.1 | 4.8 | 18.42.4 | 2.01.6e |
| 5.8 | 23.590.05 | 1.61.3 | - | - | - | - | - | - |
| 8.5 | 18.450.05 | 1.10.9 | 8.6 | 18.670.47 | 3.01.2 | 8.6 | 10.72.3 | 1.20.8e |
| 9.3 | 17.700.03 | 1.00.8 | - | - | - | - | - | - |
| 22.0 | 12.310.03 | 0.480.34 | - | - | - | - | - | - |
3.1 Model
The shape of the SED indicates that the radio continuum is a superposition of a foreground thermal component, which is optically thick for , and a non-thermal component, which dominates the radio continuum flux when the thermal component becomes optically thin, i.e., for . We model the observations as arising from non-thermal emission in a cylindrical region surrounded by a sheath of thermal electrons with constant density ( cm-3) and temperature ( K) and a thickness of approximately AU. The thickness is limited by the unresolved width of the emission at 22 GHz. The brightness temperature of the non-thermal jet implies its width to be less than AU. For this configuration the emission has two regimes: at low frequencies the thermal emission becomes optically thick, which causes the emission from the non-thermal electrons to be absorbed, and the SED to exhibit a positive spectral index. On the other hand, since at high frequencies the thermal emission becomes optically thin, the contribution from the non-thermal electrons becomes dominant, resulting in the negative spectral index. Although the spectral index indicates synchroton emission, polarized emission was not detected. This is a direct consequence of depolarization due to the thermal electrons surrounding the region where the synchrotron emission arises.
3.2 Fermi acceleration and magnetic field
Our best fit to the observed SED implies a spectral index for the non-thermal component. As the stellar temperature is approximately K (Bains et al., 2009), ionization by the star is unlikely to provide many free electrons. But, if we assume a strong shock (J-shock) between the magnetically collimated outflow and the slow AGB wind, then ionized material will propagate downstream throughout the shock-front. Eventually, a fraction of the electrons will be accelerated to relativistic speeds through the Fermi shock acceleration mechanism. Hence, Fermi accelerated electrons interacting with the magnetic field lines that collimate the outflow generate the observed non-thermal emission. Within this framework, we can assume that the total internal energy of the shocked region is split between the particles (electrons and protrons) and the magnetic field. When the total energy density is minimized with respect to the magnetic field, the energy density of the particles becomes nearly equal to the energy density of the magnetic field, and we can assume equipartition of the energy. This assumption enables us to estimate the strength of the minimum-energy magnetic field interacting with the relativistic electrons. This minimum-energy magnetic field and the minimum total energy can be calculated from
| (1) | |||||
| (2) |
where is the size of the source, is the integrated radio luminosity, is the ratio between the energy of heavy particles (protons) and the electrons, is the volume filling factor of the emitting region, and and are functions of both the spectral index, and the maximum and minimum frequencies considered for the integration of the spectral energy distribution (Pacholczyk, 1970). The distance to the source is not known, and only its (near) kinematic distance has been reported kpc. From the measured extent we estimate that the size of the source is kpc AU. Integrating the radio luminosity between Hz and Hz, assuming a spectral index of , a volume filling factor kpc (for a cylinder of 500 AU radius), and (which is an appropriate value for electrons undergoing Fermi shock acceleration in a non-relativistic jet (Beck & Krause, 2005)), we obtain kpc mG and kpc erg. Since we have not detected any linear polarization, we cannot determine if the synchrotron radiation traces either the poloidal () or the toroidal () component of the magnetic field. However, since , this component can likely be neglected at AU compared to the toroidal field, which has . Therefore, assuming that the measured magnetic field strength corresponds to the toroidal component at kpc AU, the magnetic field at AU is kpc G, which is similar to the extrapolated magnetic field strengths towards other (post-)AGB stars from maser observations (e.g. Vlemmings et al., 2006).
3.3 Variability and lifetime
A negative spectral index was obtained from the archive observations towards IRAS 154455449 (Table LABEL:tb:two). The spectral index below cm, of the SED observed in 1998/1999, is , with a turn-over frequency shifted toward a lower frequency compared with the SED observed in 2012. Additionally, radio continuum observation at cm and cm carried out in 2005 yielded a spectral index (Bains et al., 2009). Because it is a single data point taken between epochs 1998/99 and 2005, the observation at cm reported by Urquhart et al. (2007), which yielded a similar flux density to that reported by Bains et al. (2009), is not included in our fit. Since the time between the two observations is negligible compared with the synchrotron life time of relativistic electrons, we can assume that the flux of the synchrotron emission remained nearly constant between 1998 and 2012 and fit all observations considering a single synchrotron component and an increasing emission measure of the surrounding sheath of thermal electrons (Fig. 1). An increase of the emission measure by a factor of 3 between 1998 and 2005, and stable thereafter, can fit all three observational epochs. This implies that, assuming the dimensions of the surrounding sheath of thermal electrons remained the same, the electron density increased by a factor of two in seven years, likely by the same shock-ionization process that produces the electrons that are accelerated to relativistic velocities by the Fermi mechanism. In recent years, the production rate of thermal electrons is in equilibrium with their recombination rate. The stability of the non-thermal component over almost 15 years indicates that this emission is unlikely to originate from the colliding winds of binary systems such as observed around, for example, binary Wolf-Rayet stars (e.g. Chapman et al., 1999).
The rapid initial increase of emission measure between 1998 and 2005 likely implies the jet, responsible for the ionizing fast shocks, to have been launched only shortly before. Additionally, as the synchrotron flux depends on the effectiveness of the Fermi shock acceleration mechanism, once the shock front reaches outer layers where the strength of and the density of the CSE decrease, the synchrotron component would no longer be observable. This also suggest that the magnetically collimated outflow was launched recently. Thus, the lifetime of the synchrotron radiation toward post-AGB sources will most likely be determined by the time of propagation of the collimated outflow throughout regions of the CSE where the shock conditions enable the Fermi shock acceleration mechanism. Consequently, the time scale for the synchrotron radiation would at most be a few hundred years. Depending on the initial mass of the star, the synchrotron radiation time scale would be shorter than, or almost comparable with, the time scale of the post-AGB phase (van Winckel, 2003, and references therein). The fact that the source is a water fountain suggests that, in principle, this kind of source would have conditions required to trigger the Fermi shock acceleration mechanism. Nevertheless, a larger sample of confirmed water fountains and further observations are necessary to directly correlate both phenomena.
3.4 Implications for post-AGB outflows
The physical processes responsible for shaping the asymmetrical envelopes observed towards PNe have been subject of intense debate along the last three decades. Recently, it has been suggested that the bipolar structures observed towards post-AGB stars and young PNe are associated with low-density axisymmetric regions that are illuminated by a central star obscured by a dense equatorial torus (e.g. Koning, Kwok & Steffen, 2013). These low-density regions are assumed to be formed as a result of the propagation of high-momentum, collimated outflows that emerge from the inner regions of the CSE, creating cavities along the axis defined by its propagation direction. Nevertheless, the actual formation process of such cavities is not yet clear. On the other hand, observations of molecular outflows traced by CO lines towards a large sample of post-AGB stars revealed the existence of very fast collimated outflows (Bujarrabal et al., 2001). The momentum carried by most of these fast, highly collimated outflows cannot be explained considering a radiatively driven wind only, but the minimum energy calculated for the jet of IRAS 154455449 is within the typical range of the kinetic energy measured from the observation of these molecular outflows ( erg). Magnetohydrodynamical simulations have shown that magnetic fields can be an important agent in the collimation of the outflows observed towards PNe (García-Segura et al., 1999). Dust polarization observations have been carried out in order to trace the magnetic field morphology. But so far the observational study of the properties of magnetic fields towards AGB and post-AGB stars and PNe has relied on the detection of dust polarization and polarized maser emission arising in their CSEs and high-velocity outflows (e.g. Sabin et al. (2007); Vlemmings et al. (2006)). Our results provide strong observational evidence that indicates that the magnetic field is an important source of energy and is thus of great importance for the launching and driving mechanisms of the high-velocity jets from post-AGB stars. Furthermore, it will now be possible to directly test which class of magnetic launching models fits the observations (e.g Huarte-Espinosa et al., 2012).
4 Discussion
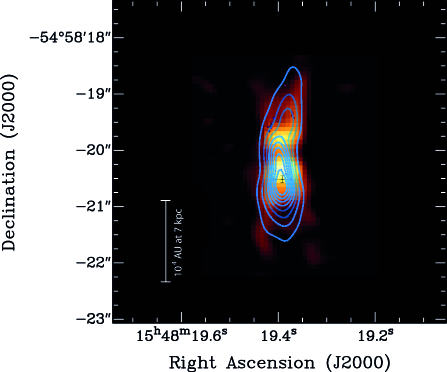
For the first time, we resolve a synchrotron jet towards a post-AGB star. The resolved radio continuum emission is consistent with the bipolar morphology of IRAS 154455449 observed at the infrared, reported by Lagadec et al. (2011), and suggests the jet is responsible for shaping the CSE. Although both theoretical models and previous H2O maser observations have been used to infer the presence of magnetically collimated outflows towards post-AGB stars, our result represents a direct observational evidence and the first unambiguous proof that magnetic fields are a key agent to explain the asymmetries observed towards PNe. Still, the source of the stellar magnetic field remains unclear. A large scale magnetic field could arise from (convective) dynamo action in a single star or require a binary (or planetary) system to be maintained. In one of the binary scenarios, the bipolar outflows are launched from a low-mass companion accreting mass ejected by the more evolved star. In this case, the collimation of the outflow might occur via a mechanism similar to that collimating the bipolar outflows from protostars, for example a disc-wind or an X-wind (Blandford & Payne 1982; Shu et al. 1994). Our results cannot yet discern which is the most likely scenario for IRAS 154455449, although a hint of curvature might point to a binary ejection mechanism. Finally, our detection of synchotron radiation towards IRAS 154455449 also demonstrates that the conditions for the Fermi shock acceleration of electrons can be attained at the final stages of the evolution of intermediate-initial-mass stars.
5 Acknowledgments
This research was supported by the Deutsche Forschungsgemeinschaft (DFG) through the Emmy Noether Research grant VL 61/3-1. The authors also thank the referee Albert Zijlstra as well as Bruce Balick for insightful comments that improved the manuscript. The Australia Telescope Compact Array is part of the Australia Telescope National Facility which is funded by the Commonwealth of Australia for operation as a National Facility managed by CSIRO. This paper includes archived data obtained through the Australia Telescope Online Archive (http://atoa.atnf.csiro.au).
References
- Bains et al. (2009) Bains, I., Cohen, M., Chapman, J. M., Deacon, R. M., & Redman, M. P. 2009, MNRAS, 397, 1386
- Balick et al. (2002) Balick, B., & Frank, A. 2002, Ann. Rev. A&A, 40, 439
- Beck & Krause (2005) Beck, R., & Krause, M. 2005, Astronomische Nachrichten, 326, 414
- Blandford & Payne (1982) Blandford, R. D., & Payne, D. G. 1982, MNRAS, 199, 883
- Bujarrabal et al. (2001) Bujarrabal, V., Castro-Carrizo, A., Alcolea, J., & Sánchez Contreras, C. 2001, A&A, 377, 868
- Carrasco-González et al. (2010) Carrasco-González, C., Rodríguez, L. F., Anglada, G., et al. 2010, Science, 330, 1209
- Chapman et al. (1999) Chapman, J. M., Leitherer, C., Koribalski, B., Bouter, R., & Storey, M. 1999, ApJ, 518, 890
- Deacon et al. (2004) Deacon, R. M., Chapman, J. M., & Green, A. J. 2004, ApJS, 155, 595
- Deacon et al. (2007) Deacon, R. M., Chapman, J. M., Green, A. J., & Sevenster, M. N. 2007, ApJ, 658, 1096
- García-Segura et al. (1999) García-Segura, G., Langer, N., Różyczka, M., & Franco, J. 1999, ApJ, 517, 767
- Gómez et al. (2011) Gómez, J. F., Rizzo, J. R., Suárez, O., et al. 2011, ApJL, 739, L14
- Habing & Olofsson (2003) Habing, H. J., & Olofsson, H. 2003, Asymptotic giant branch stars, Astronomy and astrophysics library, New York, Berlin: Springer, 2003.
- Huarte-Espinosa et al. (2012) Huarte-Espinosa, M., Frank, A., Blackman, E. G., et al. 2012, ApJ, 757, 66
- Koning, Kwok & Steffen (2013) Koning, N., Kwok, S., & Steffen, W. 2013, ApJ, 765, 92
- Lagadec et al. (2011) Lagadec, E., Verhoelst, T., Mékarnia, D., et al. 2011, MNRAS, 417, 32
- Likkel & Morris (1988) Likkel, L., & Morris, M. 1988, ApJ, 329, 914
- Murphy et al. (2007) Murphy, T., Mauch, T., Green, A., et al. 2007, MNRAS, 382, 382
- Pacholczyk (1970) Pacholczyk, A. G. 1970, Series of Books in Astronomy and Astrophysics, San Francisco: Freeman, 1970,
- Pérez-Sánchez, Vlemmings & Chapman (2011) Pérez-Sánchez, A. F., Vlemmings, W. H. T., & Chapman, J. M. 2011, MNRAS, 418, 1402
- Sabin et al. (2007) Sabin, L., Zijlstra, A. A., & Greaves, J. S. 2007, MNRAS, 376, 378
- Sahai et al. (2007) Sahai, R., Morris, M., Sánchez Contreras, C., & Claussen, M. 2007, AJ, 134, 2200
- Sault, Teuben & Wright (1995) Sault, R. J., Teuben, P. J., & Wright, M. C. H. 1995, Astronomical Data Analysis Software and Systems IV, 77, 433
- Sevenster (2002) Sevenster, M. N. 2002, AJ, 123, 2772
- Shu et al. (1994) Shu, F., Najita, J.,Ostriker, E., et al. 1994, ApJ, 429, 781
- Urquhart et al. (2007) Urquhart, J. S., Busfield, A. L., Hoare, M. G., et al. 2007, A&A, 461, 11
- Urquhart et al. (2007) Urquhart, J. S., Busfield, A. L., Hoare, M. G., et al. 2007, A&A, 474, 891
- van Winckel (2003) van Winckel, H. 2003, Ann. Rev. A&A, 41, 391
- Vlemmings et al. (2006) Vlemmings, W. H. T., Diamond, P. J., & Imai, H. 2006, Nature, 440, 58