Article 36 in eConf C1304143
Are GRBs the same at high and low redshift?
Owen Littlejohns1,2, Nial Tanvir2, Richard Willingale2, Paul O’Brien2, Phil Evans2, Andrew Levan3
1School of Earth and Space Exploration
Arizona State University, Tempe, AZ 85281, USA
2 Department of Physics and Astronomy,
University of Leicester, University Road, Leicester, LE1 7RH, UK
3 Department of Physics, University of Warwick, Coventry,
CV4 7AL, UK
Due to their highly luminous nature, gamma-ray bursts (GRBs) are useful tools in studying the early Universe (up to 10). We consider whether the available subset of Swift high redshift GRBs are unusual when compared to analogous simulations of a bright low redshift sample. By simulating data from the Burst Alert Telescope (BAT; Barthelmy et al. 2005) the light curves of these bright bursts are obtained over an extensive range of redshifts, revealing complicated evolution in properties of the prompt emission such as .
PRESENTED AT
GRB 2013
the Seventh Huntsville Gamma-Ray Burst Symposium
Nashville, Tennessee, 14–18 April 2013
1 Introduction
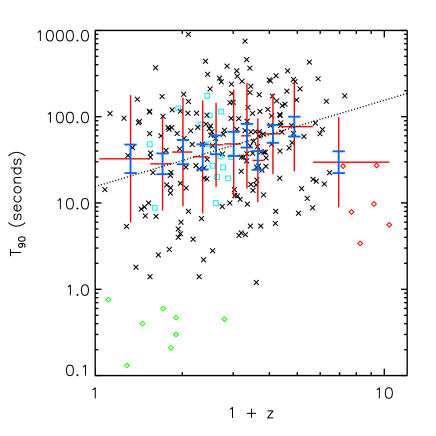
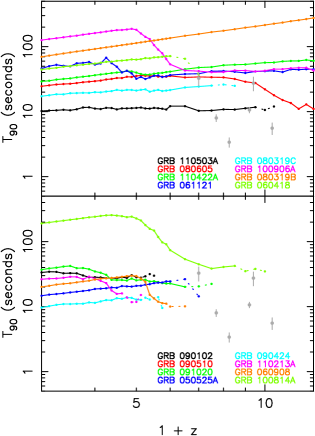
An important question in the field of GRBs is whether their populations change with redshift. This, in principle, might be reflected in the typical prompt behaviour. Beyond the dearth of higher redshift short ( 2 s) bursts, the only tentative evidence for an evolution in the population of long-GRBs is that a majority (6/7) of the highest redshift ( 6) GRBs found to-date have apparently rather short durations, 5 s (see Figures 1 & 2). Such values are of particular interest as they approach the classical value of 2 seconds used as a crude estimate of whether a burst is long or short (Kouveliotou et al. 1993, although see also Bromberg et al. 2013).

2 Method
The creation of the simulated light curves required accounting for the effects of cosmological time dilation; of band shifting, as individual photons are redshifted (this included consideration of the BAT response and change in background as a function of energy); and of declining flux due to increased luminosity distance.
We used model fits obtained using the methodology with which Willingale et al. (2010) applied the pulse model of Genet & Granot (2009). The characteristic times, energies and normalising fluxes for each pulse were calculated at the simulated redshift using Equations 1 to 3.
| (1) |
| (2) |
| (3) |
where denotes a characteristic time, is redshift, is the peak energy of each pulse spectrum, is the normalising flux, is the k-correction and is the luminosity distance.
Noise was added to the light curves, before using a rate-triggering algorithm designed to establish whether BAT would trigger on the observed flux. Those bursts which were bright enough to create a trigger were then run through the standard battblocks software to obtain .
3 Results
Example simulated light curves for GRB 100814A are shown in Figure 3. The top three panels show an increase in measured with redshift. At higher redshifts late-time structure is no longer detectable, thus reduces.

Unlike previous work (Kocevski & Petrosian, 2013) the simulated GRBs contained multiple pulses. As such three effects were apparent in the evolution: the time dilation of pulses and intervening quiescent periods, the gradual loss of the emission “tail” of individual pulses and the total loss of fainter (often late-time) pulses.
Figure 4 shows the impact of these competing effects on duration and also provides a good comparison between the observed high-redshift sample and simulations of the bright low-redshift bursts. Even taking the 16 bursts with the brightest features at low-redshifts, only approximately half of these remain detected at 6. This confirms that the detected high-redshift bursts only represent the luminous tail of the total population.
The observed high-redshift sample contains four bursts in the 5 10 s regime and now also two with 30 s. For those simulated bursts which are still visible at 6, the typical duration is 30 70 s. This suggests the two populations are different, although the analysis is limited by a small sample size.
4 Conclusions
Predicting the evolution of with redshift is complicated. It is a combination of cosmological time dilation of structure and intervening quiescence, gradual loss of the pulse “tails” and the total loss of fainter structure.
Simulating bright low-redshift bursts at high redshifts show that only the very brightest structure is detected. While the two most recent high-redshift candidates are longer in duration, the simulations typically have longer values.
Using the simulation technique developed with more GRBs detected at high-redshift will allow us to fully answer whether GRBs are the same at high-redshift.
ACKNOWLEDGEMENTS
This work is supported at the University of Leicester by the STFC.
References
- Barthelmy et al. (2005) Barthelmy S. D., et al., 2005, Space Sci. Rev., 120, 143
- Bromberg et al. (2013) Bromberg O., Nakar E., Piran T., Sari R., 2013, ApJ, 764, 179
- Gehrels et al. (2004) Gehrels N., et al., 2004, ApJ, 611, 1005
- Genet & Granot (2009) Genet F., Granot J., 2009, MNRAS, 399, 1328
- Kocevski & Petrosian (2013) Kocevski D., Petrosian V., 2013, ApJ, 765, 116
- Kouveliotou et al. (1993) Kouveliotou C., Meegan C. A., Fishman G. J., Bhat N. P., Briggs M. S., Koshut T. M., Paciesas W. S., Pendleton G. N., 1993, ApJL, 413, L101
- Willingale et al. (2010) Willingale R., Genet F., Granot J., O’Brien P. T., 2010, MNRAS, 403, 1296