A Research Framework for the Clean-Slate Design of Next-Generation Optical Access
Abstract
A comprehensive research framework for a comparative analysis of candidate network architectures and protocols in the clean-slate design of next-generation optical access is proposed. The proposed research framework consists of a comparative analysis framework based on multivariate non-inferiority testing and a notion of equivalent circuit rate taking into account user-perceived performances, and a virtual test bed providing a complete experimental platform for the comparative analysis. The capability of the research framework is demonstrated through numerical results from the study of the elasticity of hybrid TDM/WDM-PON based on tunable transceivers.
Index Terms:
Next-generation optical access, comparative analysis, equivalent circuit rate (ECR), statistical hypothesis testing, non-inferiority testing, quality of experience (QoE).I Introduction
While investigating the issues of quality of experience (QoE), elasticity111It means the ability to manage overall performances to a certain level by fast provisioning of network resources based on user demands., and energy efficiency in next-generation optical access (NGOA) as part of research programs since 2009 [1, 2, 3] with a major focus on the solutions beyond 10-Gbit/s Ethernet passive optical network (10G-EPON) and 10-Gigabit-capable PON (XG-PON) (e.g., NG-PON2 [4] by ITU-T), we have noted that the progress in the clean-slate design of NGOA is impeded by the absence of a comprehensive research framework for a comparative analysis of candidate network architectures and protocols. In fact, many NGOA network architectures have been proposed by both academia and industry and are now under extensive study (e.g., [5, 6, 7, 8]). Unfortunately, most of the existing works lack a systematic comparison of these candidate architectures under realistic operating environments; they are based on the comparison of network-level performances (e.g., packet delay and throughput), reaches, splitting ratios, and energy consumptions under static or limited statistical traffic configurations without taking into account the actual performances perceived by end-users that reflect the impact of higher-layer protocols including transmission control protocol (TCP) flow and congestion control.
Because of the complexity of protocols and the interactive nature of traffic involved in the study of network architectures, researchers now heavily depend on experiments with simulation models or test beds implementing proposed architectures and relevant protocols, rather than traditional mathematical analyses under simplifying assumptions. In this regard, a research framework for the comparative analysis of NGOA architectures and protocols should specify how to generate traffic and measure performances during the experiment, together with a systematic comparison of the measured performances from the experiments. Note that, due to the shift toward experiments, comparison procedures should be able to take into account the statistical variability in measured data from the experiments.
In this paper a new research framework for the clean-slate design of NGOA architectures and protocols is proposed. The proposed research framework consists of two major components, i.e., a comparative analysis framework and a virtual test bed for experiments.
The comparative analysis framework is based on a multivariate non-inferiority testing procedure [9, 10] and a notion of equivalent circuit rate (ECR) [11]. In this framework user-perceived performances of representative services — including web browsing (i.e., hypertext transfer protocol (HTTP)), file downloading (i.e., file transfer protocol (FTP)), and streaming video (i.e., H.264/advanced video coding (AVC) with user datagram protocol (UDP)) — are compared in an integrated way using statistical hypothesis testing procedures.
The virtual test bed is basically simulation models of the proposed architectures and protocols. Unlike many existing works in the area of optical access that mainly focus on the issues up to the data link layer (e.g., [12, 13, 14, 15]), the virtual test bed provides a complete experimental environment with session-level traffic generation (based on user behaviors) and performance gathering (as measures for user-perceived performances) as well as models for the whole network protocol stack (including TCP/Internet protocol (IP)).
The rest of the paper is organized as follows: Section II describes the comparative analysis framework based on the multivariate non-inferiority testing and the ECR. Section III provides an overview of the current implementation of the virtual test bed and discusses plans and strategies for its improvement in the next version. Section IV presents results from the study of the elasticity of hybrid time division multiplexing (TDM)/wavelength division multiplexing (WDM)-PON to demonstrate the capability of the proposed research framework. Section V concludes the discussions in this paper.
II A Comparative Analysis Framework
Fig. 1 illustrates an example of comparison between two delay curves at a certain value of load (i.e., ), which is typical in the performance analysis of a new proposed system with respect to an existing one.
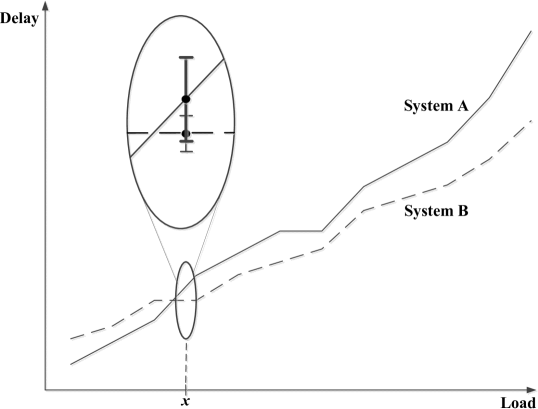
At first glance, the comparison seems straightforward; one can say from the curves that the system B provides a lower delay than the system A at load . Once taking into account the statistical variability in measured data (i.e., the overlapped confidence intervals in the enlarged part), however, we can find that the comparison is no longer straightforward and that a statistical approach is needed in this regard.
Note that most of the works in networking area lack a statistical approach in the performance comparison and just provide observations on certain trends. For example, “the system B provides a better delay performance than the system A when the load is greater than ” is a typical observation for Fig. 1, and the exact value of is not that critical. As we will discuss shortly in this section, however, the strict comparison of performances at a certain input value is quite critical to comparison frameworks like the ECR. Also, considering other performance measures (e.g., throughput) as well as delay curves for multiple services (e.g., HTTP and FTP) altogether, the performance comparison between the systems becomes even more complicated.
As we are at an early stage of the clean-slate design of NGOA, we therefore need to establish a new framework for comparing candidate network architectures and protocols which meets the following requirements:
-
•
A comparison procedure should take into account the statistical variability in measured data resulting from the experiments.
-
•
Multiple performance measures should be compared together in an integrated way.
-
•
Measures for the comparison should be user-oriented. In other words, they should reflect the quality of experience (QoE), rather than the quality of service (QoS).
To meet these requirements, we have been working on a new comparative analysis framework based on the non-inferiority testing for the comparison procedure and the ECR for the quantification of the resulting performance. The non-inferiority testing is a one-sided variant of the equivalence testing that is frequently used in Medicine and Biology for the establishment of the equivalence (often called bioequivalence) between two different clinical trials or drugs [16, 17, 10]. The ECR, on the other hand, was originally proposed for the quantification of the bandwidth of hybrid fiber coaxial (HFC) cable-based shared access network with respect to that of the digital subscriber line (DSL)-based dedicated access network in terms of web page delay as a measure for user-perceived performances [11]. The ECR framework has been extended for a quantitative comparison of optical access architectures in [1, 2].
Combining these two frameworks, we can meet the aforementioned requirements: The non-inferiority testing procedure is based on statistical hypothesis testing and as such takes into account the statistical variability inherent in measurements as well as experiments. To compare multiple performance measures in an integrated way, we extend the non-inferiority testing with the intersection-union testing (IUT) as described in [16]. The third requirement is met by the ECR which enables us to quantify the relative capacity of a candidate system with respect to a reference one based on user-perceived performances at the application level.
Fig. 2 shows the comparative analysis framework based on the ECR for the investigation of NGOA architectures and protocols, where , , , and denote backbone, feeder, distribution, and user network interface (UNI) rates and the line rate connecting the optical line terminal (OLT) and the optical network unit (ONU) of a reference architecture.
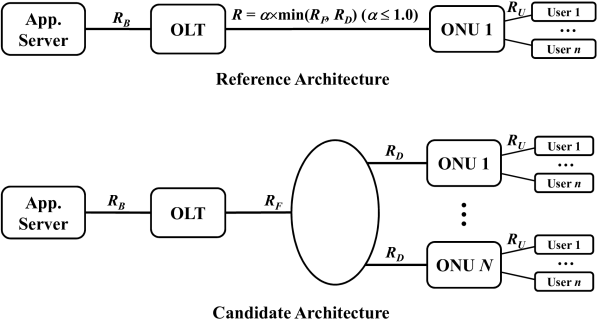
In this framework we compare the user-perceived performances of both the candidate and the reference architectures and find the value of (i.e., ECR) for the reference architecture which gives user-perceived performances statistically equivalent to those of the candidate architecture. In case of a shared architecture, for instance, because of contention for a feeder capacity among multiple ONUs and for a distribution capacity among multiple users connected to the same ONU, each user’s share of capacity cannot be greater than the minimum of the feeder and the distribution capacities. Therefore the user-perceived performance would be similar to that of the reference architecture with the line rate equal to or less than the minimum of the feeder and the distribution rates of the shared architecture.
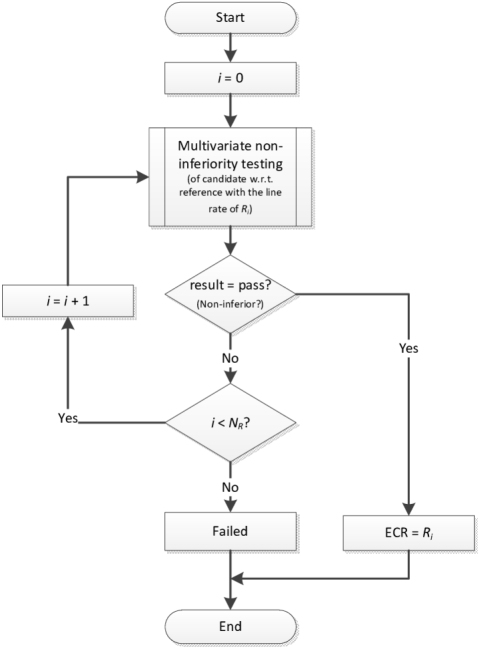
Note that the original ECR framework [11] is based on a single performance measure of web page delay and does not provide any systematic comparison procedure taking into account the statistical variability in measured data. Fig. 3 shows the new procedure for calculating ECR based on multivariate non-inferiority testing (i.e., non-inferiority testing extended by the IUT), where and denote the number of performance measures adopted and the number of values for (i.e., ’s) used for comparison, respectively.

(a)
(b)
First, we need to obtain measures of the user-perceived performances for representative applications/services (i.e., ) — e.g., web page delay defined as the average time taken to download an entire web page [11] and the fraction of decodable frames per group of pictures (GoP) (also called “decodable frame rate (DFR)”) for streaming video [18] — of the reference architecture for the line rates of where , , and for .222Note that the resolution of the ECR depends on the number of ’s (i.e., ) and proper choice of their values.
Second, using the procedure shown in Fig. 3, we find a value for the line rate of the reference architecture for which the measures of the candidate architecture are statistically non-inferior to those of the reference architecture. The null and the alternative hypotheses of the non-inferiority testing for measure (e.g., web page delay) are given by
| (1) |
where and denote population means of for the candidate and the reference architectures, respectively, and represents the tolerance for the measure . The null hypothesis () is rejected if the limit of one-sided confidence interval for the difference (i.e., ) is less than the tolerance [19]. This means that the candidate architecture is “at least as good as” the reference architecture for the given measure . Note that for each measure , we need to determine an appropriate tolerance value () and, if needed, change the hypotheses accordingly. For example, we need to change the hypotheses for the DFR of streaming video (i.e., the higher, the better) as follows:
| (2) |
III Virtual Test Bed for Experiments
To support the new comparative analysis framework described in Section II, we need a flexible, yet computationally powerful experimental platform; to carry out the statistical hypothesis testing in the proposed ECR calculation procedure, we need a sample of performance measures big enough to compute a reliable test statistic. In case of simulation experiments, this means that we have to repeat a simulation many times with a different random number seed per run, which is quite challenging for large-scale simulations.
The experimental platform also should be able to capture the interaction of many traffic flows through a complete protocol stack, which are generated either by actual users or, as a practical alternative, based on user behavior models. A real, physical test bed in this regard is hardly a viable option, considering a long cycle of design and performance evaluation of new architectures and protocols, at least at the stage of the clean-slate design.
In this regard, we decided to implement a virtual test bed composed of detailed simulation models based on OMNeT++ [20] and INET framework [21] which provide models for end-user applications as well as a complete TCP/IP protocol stack.333The implemented simulation models are available at “http://github.com/kyeongsoo/inet-hnrl”. Note that simulation studies in optical networking area usually focus on the issues at the physical and/or the data link layer only but neglect the issues at higher layers due to the limit in computing power. The recent introduction of high-performance computing (HPC) clusters and the cloud computing [22], however, brings enormous computing power at a much lower cost and, in case of the cloud computing, on-demand basis; this enables researchers to carry out a series of large-scale network simulations in a realistic environment, which was neither practical nor economically feasible in the past. Specifically, we are using Amazon elastic compute cloud (Amazon EC2)444http://aws.amazon.com/ec2/ as a running platform for the virtual test bed, while we are developing programs at a local HPC cluster for ease of testing and debugging processes.
Fig. 4 shows the overview of the virtual test bed where major building blocks are identified in addition to the system under test between the service node interface (SNI) and the UNI. For the reference architecture model, the OLT and the ONU are implemented using a general IP router and an Ethernet switch. For the candidate architectures, the hybrid TDM/WDM-PON under the SUCCESS-HPON architecture [15] has been already implemented, and the implementation of 10G-EPON is currently underway.
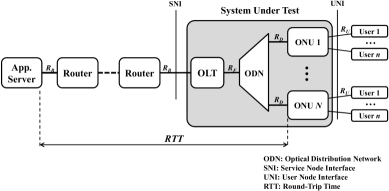
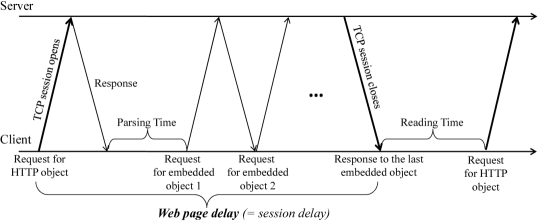
Fig. 5 shows our multi-level approach to traffic modelling and generation in the virtual test bed; as indicated by the dotted line in the figure, a user-level behavioural model governing underlying applications/services is still missing in the current implementation, while session-level and packet-level models have already been implemented for HTTP, FTP, and UDP steaming video [23].
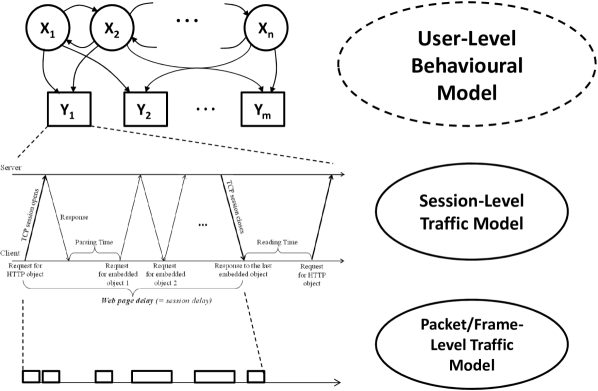
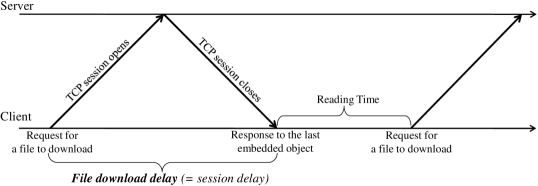
We adapt the model proposed in [24] for HTTP traffic generation at the client side above TCP layer and without caching and pipelining in a browser, while we use the FTP model from [25] without any modification. For both the traffic types, the virtual test bed provides a capability of measuring session-level delay, throughput, and transfer rate as indirect measure of user-perceived performances.
In addition to HTTP and FTP traffic, we also implemented a high-rate, HD-TV-quality streaming video traffic for the virtual test bed, which is considered one of killer applications for the NGOA. The implemented traffic module can generate frames based on trace files from the ASU video trace library [26]. As a measure of user-perceived quality of video stream, we adopt the DFR which is defined as the ratio of successfully decoded frames at a receiver to the total number of frames sent by a video source [18]: The larger the value of DFR, the better the video quality perceived by the end-user. For details of the implemented traffic models, readers are referred to [23, 2].
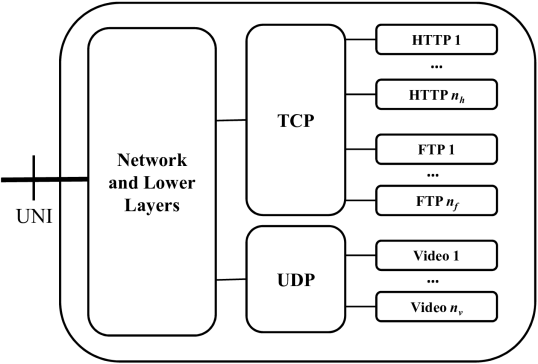
Fig. 6 shows a model for an end-user node which is connected to the ONU through UNI.
Currently, the number of traffic sessions (i.e., , , and ) is static and configured at the beginning of a simulation through an input file. Once we implement a user-level behavior model, however, the number of traffic sessions will be dynamically controlled by it during the simulation.
III-A Issues and Challenges
Here are the lessons from our initial work reported in [2]: Because we need to run multiple simulations for given parameters in order to compute a test statistic for the ECR calculation, we repeated each simulation five times with different random number seeds. Each simulation ran for 3 hours in simulation time (much longer in real time), and the data were gathered after a warmup period of 20 minutes; the warmup period should be long enough to reduce the transient effects from the PON ranging procedure and start-up delays introduced by streaming video encoding/decoding processes as well as networking protocols like TCP.555We indirectly determined the warmup period of 20 minutes by investigating the total number of scheduled events in the future-event list; we observed that after 20 minutes, the number of scheduled events throughout the system goes into a steady state for all the simulations considered. The total number of simulation runs for the initial work is more than 1000 (i.e., 780 and 250 for the reference and the shared architectures, respectively), and it took several months to finish the whole simulations with a Linux HPC cluster with 22 computing nodes, each with 8-GB memory and an 8-core Intel Xeon CPU running at 2 GHz.
As we discussed before, the cloud computing could be a solution in this regard; we can run 1000+ simulations simultaneously with the equal number of virtual computers (or cores) in principle. To reduce the run time of each individual simulation, however, we need another approach on top of cloud computing: Parallelization. Fortunately, the OMNeT++ supports parallel simulation through message passing interface (MPI) [27] library, and we are currently extending the implemented models for parallel simulation. Once the virtual test bed is ready for parallel simulation, we can increase the number of virtual computers (e.g., 2000 for 1000 simulations) to speed up run times.
As for the user-level behavioral model currently missing, we will build a demographic and behavioural user profile by focusing on groups for initial exploration and surveying large-scale data collection. Note that, because there is no NGOA network deployed now, the use of demographic and behavioural profile obtained from the survey for the architectural study is the only practical option. Then we will build the user-level behavioural model governing underlying application-level traffic models based on the developed profile, which can capture the difference between business and residential users and temporal aspects of end-user behaviours [3].
IV Preliminary Results: Elasticity of Hybrid TDM/WDM-PON with Tunable Transceivers
In this section, as a demonstration of the capability of the proposed research framework, we present preliminary results of an ongoing study of the elasticity of NGOA architectures. As of this writing, we have carried out a simulation study of hybrid TDM/WDM-PON under SUCCESS-HPON architecture with sequential scheduling with schedule-time framing () [15], whose block diagram is shown in Fig. 7.
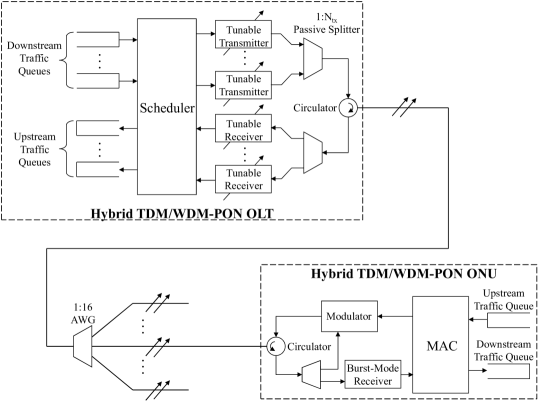
The line rates , and are set to 1 Tb/s, 10 Gb/s and 10 Gb/s, respectively, to 10 ms, and (i.e., the number of ONUs) to 16.
Because a user can interact with only one web page at a time, we set the number of HTTP sessions to one, (i.e., in Fig. 6). The same is the case for a streaming video (i.e, ). On the other hand, a user can run multiple FTP sessions in the background. Therefore we set to 10, especially to get a higher combined rate for 10-Gb/s access out of well-established, lower-rate FTP parameters from 3GPP2 [25].
Fig. 8 shows behavioral models for HTTP and FTP traffic. The parameter values are summarized in Table I.
(a)
(b)
| Parameters/Measurements | Best Fit (Parameters) |
|---|---|
| HTTP Model [24] | |
| HTML Object Size [Byte]: | Truncated Lognormal: |
| Mean=11872, SD=38036, | =7.90272, =1.7643, |
| Max=2M | Max=2M |
| Embedded Object Size [Byte]: | Truncated Lognormal: |
| Mean =12460, SD=116050, | =7.51384, =2.17454, |
| Max=6M | Max=6M |
| Number of Embedded Objects: | Gamma: |
| Mean=5.07, Max=300 | =0.141385, =40.3257 |
| Parsing Time [sec]: | Truncated Lognormal: |
| Mean=3.12, SD=14.21, | =-1.24892, =2.08427, |
| Max=300 | Max=300 |
| Reading Time [sec]: | Lognormal: |
| Mean=39.70, SD=324.92, | =-0.495204, =2.7731 |
| Max=10K | |
| Request Size [Byte]: | Uniform: |
| Mean=318.59, SD=179.46 | =0, =700 |
| FTP Model [25] | |
| File Size [Byte]: | Truncated Lognormal: |
| Mean=2M, SD=0.722M, | =14.45, =0.35, |
| Max=5M | Max=5M |
| Reading Time [sec]: | Exponential: |
| Mean=180 | =0.006 |
| Request Size [Byte]: | Uniform: |
| Mean=318.59, SD=179.46 | =0, =700 |
| Property/Statistic | Value |
|---|---|
| Video Clip | “Terminator2 [26]” |
| Encoding | VBR-coded H.264/AVC |
| Encoder | H.264 FRExt |
| Duration | 10 min |
| Frame Size | HD 1280x720p |
| GoP Size | 12 |
| Number of B Frames | 2 |
| Quantizer | 10 |
| Mean Frame Bit Rate | 28.6 Mb/s |
As for streaming video traffic, we use HD-TV-quality “Terminator 2” VBR-coded H.264/AVC clip from ASU video trace library [26] as summarized in Table II. Frames are encapsulated by real-time transport protocol (RTP) and UDP before being carried in IP packets. Considering that Ethernet frames are used in data link and physical layers, the total overhead in this case is 66 octets (=RTP(12)+UDP(8)+IP(20)+Ethernet(26)). The starting frame is selected randomly from the trace at the beginning of simulation, and the whole trace is cycled throughout the simulation.
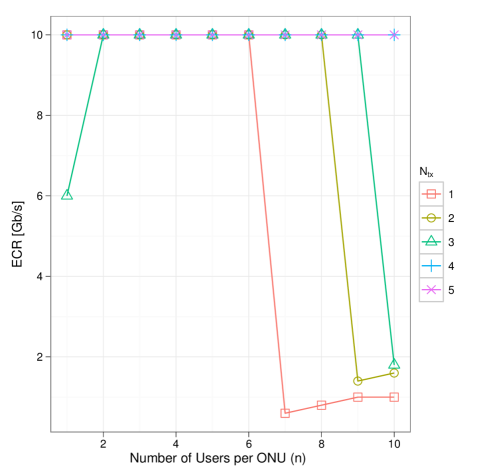
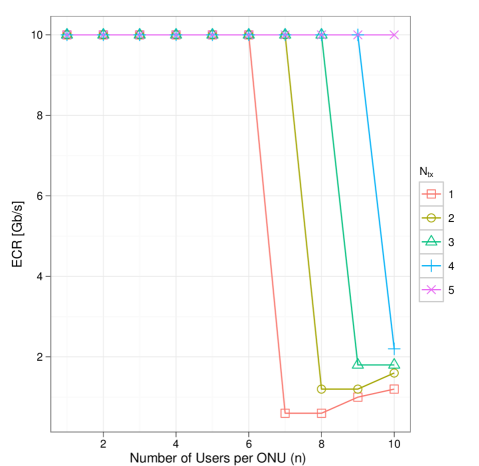
Based on the performance measures obtained from the simulation results and the ECR calculation procedure described in Section II, we obtained ECRs of hybrid TDM/WDM-PON as shown in Fig. 9.666Due to space limitation, we provide various performance measures for all three types of traffic from the simulation in [2]. Note that, because the results for FTP traffic was unreliable, especially when the load is high (probably due to the rather large number of sessions per user), we based the ECR calculation on the web page delay of HTTP traffic and the DFR of UDP streaming video only. In this case we can consider FTP traffic as background traffic, while the other two as test traffic. We set the tolerance value to 10% of the sample mean of performance measure for the dedicated architecture in non-inferiority testing with the significance level () of 0.05. As expected, adding more transceivers greatly improves the ECR as increases. For example, even with one more transceiver (i.e., ), we can achieve ECR of 10 Gb/s at , while the corresponding ECR with just one transceiver drops below 1 Gb/s for both the results. On the other hand, it is remarkable that the hybrid TDM/WDM-PON with just one transceiver can achieve ECR of 10 Gb/s until reaches 6; when , streaming video traffic alone pushes about 180-Mb/s stream into ONU and 2.88-Gb/s multiplexed stream into OLT (out of 16 ONUs). By the way, we found that the ECR based on web page delay with in Fig. 9 (a) shows a rather strange value for . In fact, the sample mean of web page delay in this case is 2.6242 sec (with a confidence width of 0.19 sec) and just slightly higher than those for which are in the range of [2.4958 sec, 2.5751 sec]. This anomaly is gone when we increase the tolerance value to 20% of the sample mean. Longer simulation run and a bigger sample size could eliminate this anomaly. Also, the ECR values for suddenly increase once they reach the bottom. This is because the performance measures are unreliable when the system is highly overloaded.
(a)
(b)
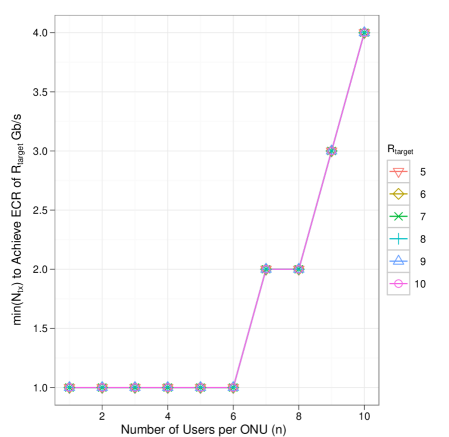
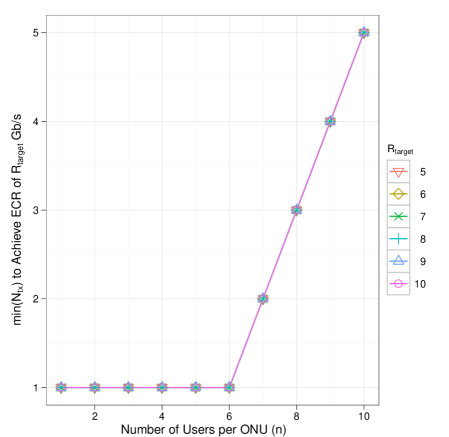
The same results are plotted in a different way in Fig. 10 which shows the minimum number of tunable transmitters () to achieve different ECR target rates. shows monotone increasing curve as increases. It is clear from the figure that we can achieve at least ECR of 10 Gb/s with just one receiver until . Note that, if we consider both the performance measures together in ECR calculation (i.e., through IUT), the resulting curves would follow those based on the DFR of UDP streaming video in Fig. 10 (b).
(a)
(b)
V Concluding Remarks
We have reported the current status of our work on a new research framework for the clean-slate design of NGOA architectures and protocols, which is composed of the comparative analysis framework and the virtual test bed for experiments. We described our proposed comparative analysis framework based on the multivariate non-inferiority testing and the ECR, which is capable of statistically comparing multiple performance measures in an integrated way and providing quantification of the effective bandwidth for users of a candidate architecture with respect to a reference architecture. Then we reviewed the current status of the virtual test bed implementation and discussed the issues and challenges we met during initial studies together with plans and strategies to address them in the next version. To demonstrate the capability of the proposed research framework, we also presented preliminary results from the ongoing study of the elasticity of NGOA architectures, which show that the hybrid TDM/WDM-PON can manage the same user-perceived performances as those of the dedicated point-to-point architecture with the same line rate by varying the number of tunable transceivers for a wide range of traffic load.
Note that there is a major implication of the proposed research framework: The way of comparing network architectures and protocols and presenting their performances would be dramatically changed. For instance, using the ECR as a reference (i.e., under the same ECR by adjusting network configurations like the number of users), we can objectively compare the issues of cost and energy efficiency of candidate architectures, which is critical for the clean-slate design of NGOA. In addition, the proposed research framework could greatly help network service providers do proper dimensioning of their NGOA before the actual deployment in the field, especially because the notion of ECR is based on user-perceived performances.
Although the mix of traffic and their parameters in the proposed research framework could be a good starting point, we need to further refine them later based on the data from large-scale simulations and/or, if possible, field trials in order to have a standard set of traffic models for NGOA — like those for wireless networking [28, 25]. Other important topics not discussed in this paper are the inclusion of upstream traffic (e.g., peer-to-peer applications) and the use of high-speed variants of TCP [29] in the virtual test bed.
VI Acknowledgment
The author would like to thank Dr Karin Ennser for fruitful discussions in getting and presenting preliminary results in Section IV. The author would also like to thank Amazon for its support on this work through Amazon Web Services (AWS) in Education Research Grant.
References
- [1] K. S. Kim, “An equivalent circuit rate-based study of next-generation optical access architectures,” in Proc. of the 3rd international conference on simulation tools and techniques (SIMUTools ’10), Torremolinos, Malaga, Spain, Mar. 2010, pp. 1–6.
- [2] ——, “An equivalent circuit rate-based study of 10-gb/s next-generation optical access architectures,” College of Engineering, Swansea University, Tech. Rep., Sep. 2010. [Online]. Available: http://iat-hnrl.swan.ac.uk/~kks/publications/ecr_study_ngoa_arxiv.pdf
- [3] K. S. Kim, K. Ennser, and Y. K. Dwivedi, “Clean-slate design of next-generation optical access,” in Proc. of the 13th International Conference on Transparent Optical Networks (ICTON) (invited paper), Stockholm, Sweden, Jun. 2011.
- [4] J. ichi Kani, F. Bourgart, A. Cui, A. Rafel, R. Davey, and S. Rodrigues, “Next-generation PON-Part I: Technology roadmap and general requirements,” IEEE Commun. Mag., vol. 47, no. 11, pp. 43–49, Nov. 2009.
- [5] F. Aurzada, M. Scheutzow, M. Reisslein, N. Ghazisaidi, and M. Maier, “Capacity and delay analysis of next-generation passive optical networks (NG-PONs),” IEEE Trans. Commun., vol. 59, no. 5, pp. 1378–1388, May 2011.
- [6] K. Grobe, M. Roppelt, , J.-P. Elbers, and M. Eiselt, “Cost and energy consumption analysis of advanced WDM-PONs,” IEEE Commun. Mag., vol. 49, no. 2, pp. S25–S32, Feb. 2011.
- [7] H. Song, B.-W. Kim, and B. Mukherjee, “Long-reach optical access networks: A survey of research challenges, demonstrations, and bandwidth assignment mechanisms,” IEEE Commun. Surveys Tuts., vol. 12, no. 1, pp. 112–123, 2010.
- [8] A. Lovrić and S. Aleksicć, “Power efficiency of extended reach 10G-EPON and TDM/WDM PON,” in OFC 2010, San Diego, CA, Mar. 2010, pp. 1–3, NMC4.
- [9] L. L. Laster and M. F. Johnson, “Non-inferiority trials: The ‘at least as good as’ criterion,” Statistics in Medicine, vol. 22, no. 2, pp. 187–200, 2003.
- [10] U. Meier, “Nonparametric equivalence testing with respect to the median difference,” Pharmaceutical Statistics, vol. 9, no. 2, pp. 142–150, 2010.
- [11] N. K. Shankaranarayanan and Z. J. P. Mishra, “User-perceived performance of web-browsing and interactive data in HFC cable access networks,” in Proc. of ICC’01, vol. 4, Jun. 2001, pp. 1264–1268.
- [12] J. Nakagawa, “Key technologies of GE-PON burst-mode receivers and future PON systems,” in OFC/NFOEC 2007 Technical Digest Series, Anaheim, CA, Mar. 2007, pp. 1–3, wU2.
- [13] M. Noda, N. Suzuki, S. Yoshima, E. Igawa, K. Ishii, M. Nogami, and J. Nakagawa, “Burst-mode transceiver technology for 10G-EPON systems,” in 9th International Conference on Optical Internet (COIN), Jeju, Korea, Jul. 2010, pp. 1–3.
- [14] D. Qian, N. Cvijetic, J. Hu, and T. Wang, “108 Gb/s OFDMA-PON with polarization multiplexing and direct detection,” J. Lightw. Technol., vol. 28, no. 4, pp. 484–493, 2010.
- [15] K. S. Kim, D. Gutierrez, F.-T. An, and L. G. Kazovsky, “Design and performance analysis of scheduling algorithms for WDM-PON under SUCCESS-HPON architecture,” J. Lightw. Technol., vol. 23, no. 11, pp. 3716–3731, Nov. 2005.
- [16] R. L. Berger and J. C. Hsu, “Bioequivalence trials, intersection-union tests, and equivalence confidence sets,” Statistical Science, vol. 11, no. 4, pp. 283–319, 1996.
- [17] H. Quan, J. Bolognese, and W. Yuan, “Assessment of equivalence on multiple endpoints,” Statistics in Medicine, vol. 20, no. 21, pp. 3159–3173, 2001.
- [18] A. Ziviani, B. E. Wolfinger, J. F. Rezende, O. C. Duarte, and S. Fdida, “Joint adoption of QoS schemes for MPEG streams,” Multimedia Tools Appl., vol. 26, no. 1, pp. 59–80, 2005.
- [19] GraphPad Software. Statistical tests for equivalence. [Online]. Available: http://www.graphpad.com/library/BiostatsSpecial/article_182.htm
- [20] A. Varga. OMNeT++: Discrete event simulation system. [Online]. Available: http://www.omnetpp.org/
- [21] A. Varga et al. INET framework for OMNeT++ 4.0. [Online]. Available: http://inet.omnetpp.org/
- [22] M. Armbrust, A. Fox, R. Griffith, A. D. Joseph, R. H. Katz, A. Konwinski, G. Lee, D. A. Patterson, A. Rabkin, I. Stoica, and M. Zaharia, “Above the clouds: A Berkeley view of cloud computing,” Dept. of EECS, UC Berkeley, Tech. Rep. UCB/EECS-2009-28, Feb. 2009.
- [23] K. S. Kim, “Integration of OMNeT++ hybrid TDM/WDM-PON models into INET framework,” OMNeT++ Workshop 2011 code contribution, Barcelona, Spain, Mar. 2011. [Online]. Available: http://www.omnet-workshop.org/2011/uploads/slides/OMNeT_WS2011_S5_C2_Kim.pdf
- [24] J. J. Lee and M. Gupta, “A new traffic model for current user web browsing behavior,” Research@Intel, Sep. 2007. [Online]. Available: http://blogs.intel.com/research/HTTP\%20Traffic\%20Model\_v1\%201\%20white\%20paper.pdf
- [25] cdma2000 Evaluation Methodology, 3GPP2 C.R1002-B, 3GPP2 Std., Rev. B, Dec. 2009.
- [26] G. V. der Auwera, P. T. David, and M. Reisslein, “Traffic and quality characterization of single-layer video streams encoded with H.264/AVC advanced video coding standard and scalable video coding extension,” IEEE Trans. Broadcast., vol. 54, no. 3, pp. 698–718, Sep. 2008.
- [27] Message passing interface forum. [Online]. Available: http://www.mpi-forum.org/
- [28] WiMAX system evaluation methodology, WiMAX Forum Std., Rev. 2.1, Jul. 2008.
- [29] S. Ha, Y. Kim, L. Le, I. Rhee, and L. Xu, “A step toward realistic performance evaluation of high-speed TCP variants,” in Fourth International Workshop on Protocols for Fast Long-Distance Networks (PFLDnet2006), Nara, Japan, Feb. 2006. [Online]. Available: http://www4.ncsu.edu/~rhee/export/bitcp/asteppaper.htm