Stringent constraints on the H i spin temperature in two Damped Lyman- systems from redshifted 21 cm absorption studies
Abstract
Physical properties of Damped Lyman- absorbers and their evolution are closely related to galaxy formation and evolution theories, and have important cosmological implications. H i 21 cm absorption study is one useful way of measuring the temperature of these systems. In this work, very strong constraints on the temperature of two Damped Lyman- absorbers at are derived from low radio frequency observations. The H i spin temperature is found to be greater than K for both the absorbers. The high spin temperature of these high-redshift systems is in agreement with the trend found in a compilation of temperatures for other Damped Lyman- absorbers. We also argue that the temperature – metallicity relation, reported earlier in the literature, is unlikely to be a spurious line of sight effect, and that the redshift evolution of the spin temperature does not arises due to a selection effect. All of these are consistent with a redshift evolution of the warm gas fraction in Damped Lyman- systems.
keywords:
galaxies: high-redshift – galaxies: ISM – ISM: evolution – ISM: general – radio lines: ISM.1 Introduction
Damped Lyman- (DLA) absorbers are very important probes of neutral hydrogen (H i) in the distant Universe. These high H i column density structures ( cm-2), seen against the quasar continuum emission, are believed to contain most of the neutral gas at high redshift, and are supposed to be the main sites of star formation and the precursors of galaxies. A detailed study of the physical conditions of these high column density systems is, therefore, necessary for understanding galaxy formation and evolution and the large scale structure of the Universe. DLAs are also useful tools to address cosmological problems (e.g., the evolution of fundamental constants; Wolfe et al., 1976; Srianand et al., 2010).
In spite of the significant amount of work already done on this subject, properties of DLAs, such as density, H i temperature, structure and size, are still unsettled (e.g., Wolfe, Gawiser & Prochaska, 2005). The issue of redshift evolution of these properties is also controversial (Kanekar & Briggs, 2004; Wolfe, Gawiser & Prochaska, 2005; Kanekar, Chengalur & Lane, 2007). One particular interesting issue in this regard is the temperature of the absorbing gas. Radio frequency observations of redshifted H i 21 cm absorption lines from DLAs, against suitable background radio continuum sources (e.g. radio loud quasars), are widely used to constrain the spin temperatures (). It has been argued that the derived values show a trend of high at higher , but both high and low value of are observed at low . Processes like collision and resonant scattering of Lyman- photons generally couple with the kinetic temperature, (Field, 1958). So a higher implies a higher average of the neutral gas, or equivalently a smaller fraction of cold gas, at high . If true, this may be a very important constraint in galaxy evolution models. However, this trend is so far deduced mostly from low redshift measurements and a few lower limits of based on non-detection of H i 21 cm absorption at higher redshift (e.g., Kanekar & Chengalur, 2003; Kanekar, Chengalur & Lane, 2007). It is also possible that the compact reservoirs of H i observed against large radio continuum sources have covering factors smaller than the assumed value of unity, so smaller than those reported (Curran et al., 2005; Curran & Webb, 2006). Alternatively, the optical and radio lines of sight could be drastically different (Wolfe, Gawiser & Prochaska, 2003). Moreover, there are contradicting evidences of both cold and warm gas in high redshift DLAs (e.g., Carilli et al., 1996; de Bruyn, O’Dea & Baum, 1996; Briggs, Brinks & Wolfe, 1997; Wolfe, Gawiser & Prochaska, 2003; Howk, Wolfe & Prochaska, 2005; Kanekar, Chengalur & Lane, 2007; York et al., 2007; Howk, Wolfe & Prochaska, 2005; Srianand et al., 2010; Carswell et al., 2012; Kanekar et al., 2013), which are not consistent with any strong trend. Given the importance of these results in galaxy evolution models, it is necessary to address these issues critically and in much greater details.
Naturally, the main problem here is the lack of H i 21 cm absorption studies and detections at higher redshift. Most such studies are focused on low redshift (e.g., Chengalur & Kanekar, 2000; Kanekar & Chengalur, 2001). To our knowledge, there are only four reported detections of 21 cm absorption at (Wolfe et al., 1985; Kanekar et al., 2006; York et al., 2007; Kanekar et al., 2009b, 2013) and just two cases of confirmed detection at : towards PKS (, de Bruyn, O’Dea & Baum, 1996; Briggs, Brinks & Wolfe, 1997; Kanekar, Chengalur & Lane, 2007) and towards J (, Srianand et al., 2010, 2012). In light of this, we have started a program of very deep observations of high redshift DLAs with the Giant Meterwave Radio Telescope (GMRT; Swarup et al., 1991) in an attempt to increase the number of such observations at ; our goal is to constrain and to address some of the above mentioned issues systematically. High sensitivity of the telescope, and the spatial and spectral resolution of the instrument make GMRT suitable for this project. Note that the GMRT 325 MHz receiver covers the H i 21 cm line for a redshift range of . The Sloan Digital Sky Survey (SDSS) damped Lyman- survey catalogue (Prochaska, Herbert-Fort & Wolfe, 2005; Prochaska & Wolfe, 2009) is used to identify a total of sources in this redshift range and . Out of these, have radio continuum counterpart detected in the NRAO VLA Sky Survey (NVSS; Condon et al., 1998), so are suitable for H i 21 cm absorption studies. In this Letter we report results for two sources from this sample for which we have carried out deep GMRT observations and analysis. These sources are J and J. In §2, the details of the observations and data analysis are outlined, while the results are in §3. A brief discussion on the implications of the results are in §4, and the conclusions are presented in §5.
2 Targets, Observations and data analysis
J is a quasar at , with a 1.4 GHz flux density of mJy (from NVSS). The DLA system towards this background source is at a redshift of with . The second source, J is at with NVSS mJy, and the DLA system is at with . For the first source, the flux density at MHz from the Westerbork Northern Sky Survey (WENSS; Rengelink et al., 1997) is mJy, but the field of the second source was not covered by WENSS.
The GMRT observations were carried out during observing cycle 20 (Project ID 20_026) on 2011 May 20-27. A total of 72 hours of observing time was scheduled for these two sources, but some of the observing runs were affected by bad weather. As a result, additional 24 hours of reobservation time was scheduled on 2012 February 7-8. The effective on-source time was hours per source, and the rest (about ) was spent on observation setup and calibration overheads.
For these observations, we used the GMRT 325 MHz receiver with a baseband bandwidth of 1 MHz (centred at the redshifted H i frequency for the corresponding value) divided into 256 spectral channels. This resulted in a spectral resolution of km s-1 and a total bandwidth coverage of km s-1. Standard calibrators, 3C 147, 3C 286, and 3C 48, were observed to calibrate the flux density scale. Two more calibrator sources, and , were also observed as phase calibrators for J and J respectively.
Standard data reduction and analysis were carried out using the Astronomical Image Processing System of the National Radio Astronomy Observatory (NRAO AIPS). Bad data were carefully flagged before flux, phase and bandpass calibrations. A very stable spectral bandshape is required to detect any weak H i absorption line. Hence, the strong phase calibrators, along with all the flux calibrators, were also used for bandpass calibration, and an interpolated bandpass solution was applied to the target source data. The flagged and calibrated data for the same source from multiple days of observing runs were then combined together and self-calibrated using the initial continuum image. The final continuum flux density was found to be mJy, in good agreement with the WENSS flux density, for J. For J, however, we found two more point sources very close to the target (within the NVSS synthesized beam, and hence unresolved by NVSS); the flux density of the target quasar is only mJy. The continuum subtracted data were then used to produce the spectral image cubes, and the spectra were extracted for both the lines of sight from the corresponding positions of the unresolved continuum sources. Finally, the measured continuum flux densities were used to convert the flux density spectra to optical depth spectra assuming a covering factor of unity.
3 Results
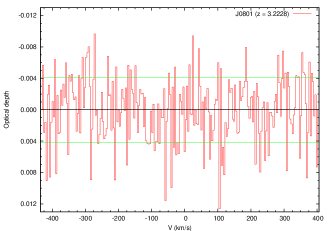
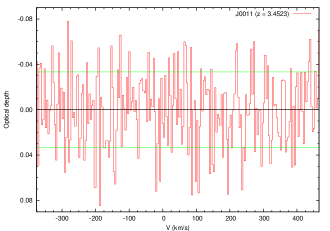
The final spectra for both the lines of sight are shown in Figure 1. With the long integration time on each source, we reached very good (sub mJy per km s-1) RMS noise sensitivity limits, but H i 21 cm absorption is not detected towards either of these lines of sight. The spectral RMS noise values are mJy per km s-1 for J, mJy (May 2011) and mJy (Feb. 2012) per km s-1 for J. The final RMS optical depths at these velocity resolutions are and for J and J respectively. Based on the known H i column densities from SDSS for these DLA systems, one can now constrain the spin temperature . We use the standard relation
| (1) |
where is the covering factor, and assume that the integral is over a Gaussian profile with a full width at half maximum (FWHM) of km s-1. The RMS optical depths finally translate to limits of and K for J and J respectively.
Neither of the target sources, unfortunately, have reported Very Long Baseline Interferometry (VLBI) observations, which are critical to measure and break the degeneracy between and . However, based on a sample of background radio sources with foreground DLAs, Kanekar et al. (2009a, 2013) reported a median covering factor of , with a minimum value of and no significant trend with . Adopting and km s-1, the current non-detection limits will imply and K for these two systems. Even for , for both the systems are above K. Note that an FWHM km s-1 corresponds to pure thermal broadening for K gas.
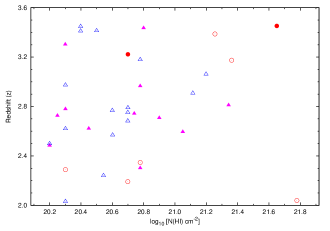
To compare the present limits with measurements or limits of from earlier similar observations, we have compiled information from the literature reporting the redshifted H i 21 cm absorption studies of high redshift () DLAs. In the redshift range of (that is, the age of the universe Gyr for standard cosmological parameters H km s-1Mpc-1, and ), we found reported detections and (including the two from this work) non-detections of H i absorption (Wolfe et al., 1985; Carilli et al., 1996; de Bruyn, O’Dea & Baum, 1996; Briggs, Brinks & Wolfe, 1997; Kanekar & Chengalur, 2003; Kanekar et al., 2006; Kanekar, Chengalur & Lane, 2007; York et al., 2007; Kanekar et al., 2009b; Curran et al., 2010; Srianand et al., 2010, 2012; Kanekar et al., 2013) with the value (or the limit) of (or ) in the literature. For all six cases of detection and of the non-detections, the covering factor is also available. The median value of is for this sample of sources, and there is, again, no statistical trend with redshift. For the other sources, we used the median value of to estimate, in a statistical sense, the expected limits from the limits. If, for a given source, multiple estimates are available in the literature, we used the most updated, sensitive and best estimate. Figure 2 shows the redshift and column density distribution of the whole sample. We note a selection trend here, though based on a small number statistics: radio observations for H i absorption studies appear to have targeted low N(H i) systems at the lower end of the redshift range, but both low and high N(H i) systems at higher redshifts. It is worth remembering that the target selection criteria are very different in different studies, and hence the collated sample is expected to be significantly heterogeneous as well as incomplete.
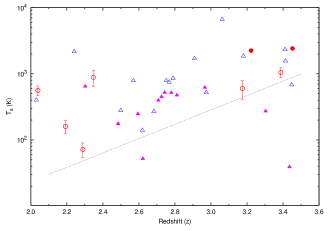
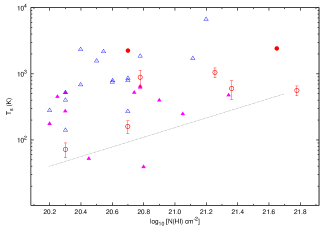
A comparison of our limits with other measurements and limits are shown in Figure 3. The values with redshifts and H i column densities are shown in the left and the right panel respectively. The two filled circles, showing the limits from the present work, near the top right corner of the left panel are evidently very strong constraints on at the high end. The dotted lines in both the panels of Figure 3 approximately mark the lower envelope of the measured values and limits; this suggests that the minimum increases with both and N(H i). However, this conclusion comes dominantly from H i non-detections, and only few measurements. More such deep observations to constrain tightly for more DLAs and to improve the statistical significance are certainly required to draw any definitive conclusions.
Finally, we note that in near future the new and upcoming low frequency telescopes will mediate a significant progress in this field. In particular, in about an year, the ongoing upgradation of the GMRT will offer a seamless frequency coverage of MHz, and a slightly better sensitivity at MHz due to improved low noise amplifiers (LNAs). These will make a larger redshift window available for H i 21 cm observations of DLAs, and will expand the horizon of DLA studies.
4 Discussions
4.1 Redshift evolution or local origin?
Redshift evolution of physical properties of the gas in DLAs has been a topic of much discussion. If real, the observed trend of higher average at high will imply a lower fraction of cold gas at high redshift (e.g., Kanekar et al., 2009b), and may have important implications regarding cosmic evolution of properties/morphologies of DLA host galaxies. Thus, the issue is also related to the hierarchical galaxy formation models. Alternatively, Curran et al. (2005) attributed it to a lower covering factor at high . On the other hand, based on C ii∗ observations, Wolfe, Gawiser & Prochaska (2003) argued for the presence of a large fraction of cold gas in high DLAs, and suggested that the radio and optical lines of sight are completely different. However, Kanekar et al. (2009a, b) argue that the observed trend is most likely not caused by the above two reasons, and is due to a real evolution of the cold gas fraction.
One crucial argument in this context comes from the observed anti-correlation between and metallicity (e.g., Kanekar et al., 2009b; Curran et al., 2010; Ellison et al., 2012). Srianand et al. (2012), however, find no such anti-correlation, either due to possible redshift evolution or due to a small range of metallicity in their sample. Kanekar et al. (2009b) noted that a mass-metallicity relation in DLAs (see, e.g., Neeleman et al., 2013, for details) can naturally result in a larger cold gas fraction due to efficient cooling via metal line transitions for high metallicity systems, and leads to the observed anti-correlation. While this reinforces the evidence for an evolution of the cold gas fraction, Kanekar et al. (2009b) can not completely rule out the possibility of a local origin of the relation due to significant metallicity gradients – a “line-of-sight effect” of higher metallicity and lower temperature for sightlines passing through the central regions and vice versa.
In this local origin scenario (i.e. if DLA hosts are large galaxies with internal metallicity and/or temperature gradients), one would expect to see an anti-correlation between the H i column density and the spin temperature as well. For example, in diffuse H i of the Milky Way, is higher for lower N(H i) sightlines. This has been reported recently by Kanekar, Braun & Roy (2011) from Galactic H i observations along lines of sight. A similar anti-correlation is also evident for a larger sample of lines of sight from the millennium Arecibo 21 cm absorption-line survey (Heiles & Troland, 2003). We do not see such anti-correlation for DLAs. Rather, we see a weak correlation between N(H i) and (see Figure 3 right panel), which, we argue below, is probably a “secondary correlation”. The number of measurements, particularly at the high N(H i) end, in the current sample is too small to draw any stronger conclusion at this point. However, the lack of any N(H i) – anti-correlation indicates that local origin is an incorrect explanation (for the reported anti-correlation between and metallicity).
4.2 Primary vs. secondary correlations
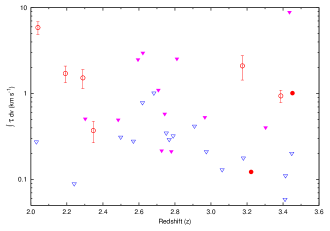
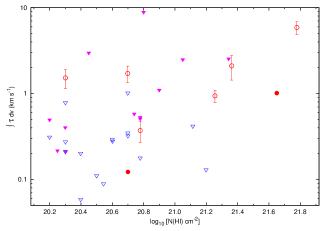
While discussing N(H i) – correlation, it is important to remember that is a derived quantity. In Figure 4 we instead show the measurements or upper limits of directly observed quantities, equivalent velocity width (), with and N(H i). There is a weak indication of lower equivalent width at higher redshift, but no significant correlation with N(H i) is evident in this plot. So, the observed N(H i) – “correlation” is consistent with random equivalent velocity widths, and is most likely a secondary correlation that arises because is derived from observables and also N(H i) itself. Note that for a sample with a similar redshift range, Srianand et al. (2012) also found no – N(H i) correlation, while Curran et al. (2010) reported a correlation for a sample with a larger redshift range.
Is it possible that the redshift evolution of is also a secondary correlation due to some selection effects? We have noted from Figure 2, that the current sample consists of both low and high N(H i) DLAs at high , but selectively only low N(H i) DLAs at low . The SDSS full sample does not have this selection effect. If is approximately constant over the redshift range, one would then, for this sample, expect a lower value of equivalent width at low , but a higher mean (and larger spread) at high . In the data, we see an opposite trend – a weak indication of an anti-correlation between redshift and equivalent width. So, it seems that the redshift evolution of the spin temperature (and/or of the equivalent width) is real, and not merely a selection effect. We note that the interdependence N(H i) makes it hard to decide, from the very limited sample, whether one of these correlations (spin temperature and equivalent width with redshift) is “primary”, and the other one arises only as a secondary effect, or if both have real physical significance. There is some discussion in this regard by Kanekar et al. (2009b) based on the argument that a primary correlation is expected to have higher significance. More observations and careful comparison with theoretical models (e.g. with predicted spin temperature and velocity spread from the hierarchical galaxy formation models) are certainly required to address these issues.
5 Conclusions
We have presented results from low frequency radio observations of two DLAs at . Based on non-detections of redshifted 21 cm absorption, the spin temperature limits are K for both the systems. These are very strong limits for DLAs at such high redshift. A compilation from the literature of measurements and limits for DLAs at shows a clear indication of higher average gas temperature at high redshift. From the absence of N(H i) – anti-correlation, we conclude that the reported anti-correlation between and metallicity is unlikely to be a local, line of sight effect. We also argue that the observed trend of higher at high is neither a selection effect nor a derived secondary correlation, but a true, physical evolution. This implies a smaller fraction of cold gas in DLAs at high redshift, likely because of lower metallicity at high redshift. Access to a larger redshift range in near future for such studies will definitely be very useful.
Acknowledgments
We thank Aritra Basu, Rahul Basu, Prasun Dutta, and the staff of the GMRT who have made these observations possible. GMRT is run by the National Centre for Radio Astrophysics of the Tata Institute of Fundamental Research. We are grateful to Jayaram N. Chengalur, Nissim Kanekar and Divya Oberoi for useful discussions. We also thank the editor and the anonymous reviewer for prompting us to improve this paper. NR acknowledges support from the Alexander von Humboldt Foundation and the Jansky Fellowship Program of the National Radio Astronomy Observatory (NRAO). The NRAO is a facility of the National Science Foundation operated under cooperative agreement by Associated Universities, Inc.
References
- Briggs, Brinks & Wolfe (1997) Briggs F. H., Brinks E., Wolfe A. M., 1997, AJ, 113, 467
- Carilli et al. (1996) Carilli C. L., Lane W. M., de Bruyn A. G., Braun R., Miley G. K., 1996, AJ, 111, 1830
- Carswell et al. (2012) Carswell R. F., Becker G. D., Jorgenson R. A., Murphy M. T., Wolfe A. M., 2012, MNRAS, 422, 1700
- Chengalur & Kanekar (2000) Chengalur J. N., Kanekar N., 2000, MNRAS, 318, 303
- Condon et al. (1998) Condon J. J., Cotton W. D., Greisen E. W., Yin Q. F., Perley R. A., Taylor G. B., Broderick J. J., 1998, AJ, 115, 1693
- Curran et al. (2005) Curran S.J., Murphy M., Pihlström Y., Webb J., Purcell C., 2005, MNRAS, 356, 1509
- Curran et al. (2010) Curran S. J. et al., 2010, MNRAS, 402, 35
- Curran & Webb (2006) Curran S. J., Webb J. K., 2006, MNRAS, 371, 356
- de Bruyn, O’Dea & Baum (1996) de Bruyn A. G., O’Dea C. P., Baum S. A., 1996, A&A, 305, 450
- Ellison et al. (2012) Ellison S. L., Kanekar N., Prochaska J. X., Momjian E., Worseck G. 2012, MNRAS, 424, 293
- Field (1958) Field G. B., 1958, Proc. I.R.E., 46, 240
- Heiles & Troland (2003) Heiles C., Troland T. H., 2003, ApJS, 145, 329
- Howk, Wolfe & Prochaska (2005) Howk J. C., Wolfe A. M., Prochaska J. X., 2005, ApJ, 622, L81
- Howk, Wolfe & Prochaska (2005) Jorgenson R. A., Wolfe A. M., Prochaska J. X., Carswell R. F., 2009, ApJ, 704, 247
- Kanekar, Braun & Roy (2011) Kanekar N., Braun R., Roy N., 2011, ApJ, 737, L33
- Kanekar & Briggs (2004) Kanekar N., Briggs F. H., 2004, New Astron. Rev., 48, 1259
- Kanekar & Chengalur (2001) Kanekar N., Chengalur J. N., 2001, A&A, 369, 42
- Kanekar & Chengalur (2003) Kanekar N., Chengalur J. N., 2003, A&A, 399, 857
- Kanekar, Chengalur & Lane (2007) Kanekar N., Chengalur J. N., Lane W. M., 2007, MNRAS, 375, 1528
- Kanekar et al. (2013) Kanekar N., Ellison S. L., Momjian E., York B. A., Pettini M., 2013, MNRAS, 428, 523
- Kanekar et al. (2009a) Kanekar N., Lane W. M., Momjian E., Briggs F. H., Chengalur J. N., 2009a, MNRAS, 394, L61
- Kanekar et al. (2009b) Kanekar N., Smette A., Briggs F. H., Chengalur J. N., 2009b, ApJ, 705, L40
- Kanekar et al. (2006) Kanekar N., Subrahmanyan R., Ellison S. L., Lane W. M., Chengalur J. N., 2006, MNRAS, 370, L46
- Neeleman et al. (2013) Neeleman M., Wolfe A. M., Prochaska J. X., Rafelski M., 2013, ApJ, 769, 54
- Prochaska, Herbert-Fort & Wolfe (2005) Prochaska J. X., Herbert-Fort S., Wolfe A. M., 2005, ApJ, 635, 123
- Prochaska & Wolfe (2009) Prochaska J. X., Wolfe A. M., 2009, ApJ, 696, 1543
- Rengelink et al. (1997) Rengelink R. B., Tang Y., de Bruyn A. G., Miley G. K., Bremer M. N., Roettgering H. J. A., Bremer M. A. R., 1997, A&AS, 124, 259
- Srianand et al. (2010) Srianand R., Gupta N., Petitjean P., Noterdaeme P., Ledoux C., 2010, MNRAS, 405, 1888
- Srianand et al. (2012) Srianand R., Gupta N., Petitjean P., Noterdaeme P., Ledoux C., Salter C. J., Saikia, D. J., 2012, MNRAS, 421, 651
- Swarup et al. (1991) Swarup G., Ananthakrishnan S., Kapahi V. K., Rao A. P., Subrahmanya C. R., Kulkarni V. K., 1991, Curr. Sci., 60, 95
- Wolfe et al. (1985) Wolfe A. M., Briggs F. H., Turnshek D. A., Davis M. M., Smith H. E., Cohen R. D., 1985, ApJ, 294, L67
- Wolfe et al. (1976) Wolfe A. M., Broderick J. J., Condon J. J., Johnston K. J., 1976, ApJ, 208, L47
- Wolfe, Gawiser & Prochaska (2003) Wolfe A. M., Gawiser E., Prochaska J. X., 2003, ApJ, 593, 235
- Wolfe, Gawiser & Prochaska (2005) Wolfe A. M., Gawiser E., Prochaska J. X., 2005, ARA&A, 43, 861
- York et al. (2007) York B. A., Kanekar N., Ellison S. L., Pettini M., 2007, MNRAS, 382, L53