Multifrequency studies of the narrow-line Seyfert 1 galaxy SBS 0846513
Abstract
The narrow-line Seyfert 1 galaxy SBS 0846513 was first detected by the Large Area Telescope (LAT) on-board Fermi in 2011 June–July when it underwent a period of flaring activity. Since then, as Fermi continues to accumulate data on this source, its flux has been monitored on a daily basis. Two further -ray flaring episodes from SBS 0846513 were observed in 2012 May and August, reaching a daily peak flux integrated above 100 MeV of (5012)10-8 ph cm-2 s-1, and (7314)10-8 ph cm-2 s-1 on May 24 and August 7, respectively. Three outbursts were detected at 15 GHz by the Owens Valley Radio Observatory 40-m telescope in 2012 May, 2012 October, and 2013 January, suggesting a complex connection with the -ray activity. The most likely scenario suggests that the 2012 May -ray flare may not be directly related to the radio activity observed over the same period, while the two -ray flaring episodes may be related to the radio activity observed at 15 GHz in 2012 October and 2013 January. The -ray flare in 2012 May triggered Swift observations that confirmed that SBS 0846513 was also exhibiting high activity in the optical, UV and X-ray bands, thus providing a firm identification between the -ray source and the lower-energy counterpart. We compared the spectral energy distribution (SED) of the flaring state in 2012 May with that of a quiescent state. The two SEDs, modelled as an external Compton component of seed photons from a dust torus, could be fitted by changing the electron distribution parameters as well as the magnetic field. No significant evidence of thermal emission from the accretion disc has been observed. Interestingly, in the 5 GHz radio luminosity vs. synchrotron peak frequency plot SBS 0846513 seems to lie in the flat spectrum radio quasar part of the so-called ‘blazar sequence’.
keywords:
galaxies: active – galaxies: nuclei – galaxies: Seyfert – galaxies: individual: SBS 0846513 – gamma-rays: general1 Introduction
Narrow-line Seyfert 1 (NLSy1) galaxies are an extreme class of active galactic nuclei (AGNs) with lower black hole (BH) masses (106–108 M⊙) and higher accretion rates (close to or above the Eddington limit) than those observed in quasars. The strong and variable radio emission, and the flat radio spectrum suggest the presence of a relativistic jet in some of them (e.g. Yuan et al., 2008). The detection by the Large Area Telescope (LAT) on-board the Fermi satellite of variable -ray emission from 5 radio-loud NLSy1 galaxies brings to three the classes of AGN detected at -ray energies (Abdo et al., 2009; D’Ammando et al., 2012a), the other two being blazars and radio galaxies. The discovery that NLSy1 host relativistic jets poses intriguing questions about the nature of these objects, the onset of relativistic jets, the mechanisms of high-energy emission, and the evolution of radio-loud AGNs.
Considering the fact that radio-loud NLSy1s are usually hosted in spiral galaxies (e.g. Deo et al., 2006; Zhou et al., 2006) the presence of a relativistic jet seems to challenge the firm belief that the formation of relativistic jets can happen only in elliptical galaxies (Böttcher & Dermer, 2002; Marscher, 2010). However, it is worth noting that the NLSy1 Mrk 1239 may be hosted in an early type elliptical/S0 galaxy (Markarian et al., 1989) and a possible residual of a galaxy merger was observed in 1H 0323342 (Anton et al., 2008), one of the five NLSy1s detected by Fermi-LAT.
One of the key questions is the maximum power released by the jets of radio-loud NLSy1, and for this reason -ray flaring episodes from these sources have catalyzed a growing interest in the astrophysical community. The first clues came in 2010 July and 2011 June when PMN J09480022 underwent a high -ray flaring activity with daily peak flux integrated above 100 MeV of 110-6 ph cm-2 s-1 (Foschini et al., 2011; D’Ammando Ciprini, 2011). Recently, a new -ray flare from this source was detected by Fermi-LAT (D’Ammando & Orienti, 2013). A strong -ray flare was observed also from SBS 0846513 in 2011 June–July, reaching an apparent isotropic -ray luminosity of 1048 erg s-1, comparable to that of the bright flat spectrum radio quasars (FSRQs) (D’Ammando et al., 2012a). This could be an indication that a few radio-loud NLSy1s are able to host relativistic jets as powerful as those in blazars, despite the lower BH masses (e.g. Yuan et al., 2008).
The -ray all-sky monitoring by Fermi-LAT provides us with the opportunity to follow the daily behaviour of these -ray NLSy1s thus enabling us to identify flaring episodes. A new period of high -ray activity from SBS 0846513 was detected by Fermi-LAT beginning at the end of 2012 April with two peaks in May and August.
The aims of this paper are to discuss the connection between the radio and -ray activity of SBS 0846513, to study the spectral energy distribution (SED) of the source in the quiescent and flaring state, and to compare the characteristics of this NLSy1 with those of the -ray blazars. The paper is organized as follows. In Section 2, we report the LAT data analysis and results. The results of the Swift observations are presented in Section 3. Radio data collected by the Owens Valley Radio Observatory (OVRO) 40-m, Medicina, and Effelsberg 100-m telescopes are summarised in Section 4. In Section 5, we present the SED modelling of the flaring activity in 2012 May and the quiescent state in 2011. Finally, we discuss the radio variability and proper motion of SBS 0846513, the connection with the -ray emission, and draw our conclusions about the comparison with the -ray blazars in Section 6.
Throughout the paper, the photon index, , is defined as , and a cold dark matter (CDM) cosmology with = 71 km s-1 Mpc-1, , and is adopted. The corresponding luminosity distance at the source redshift (Abazajian et al., 2004) is d Gpc, and 1 milliarcsecond corresponds to a projected linear size of 6.6 pc.
2 Fermi-LAT Data: Selection and Analysis
The Fermi-LAT is a pair-conversion telescope operating from 20 MeV to 300 GeV. It has a large peak effective area ( 8000 cm2 for 1 GeV photons), an energy resolution of typically 10%, and a field of view of about 2.4 sr with single-photon angular resolution (68% containment radius) of 0.6∘ at E = 1 GeV on-axis. Further details about the Fermi-LAT are given in Atwood et al. (2009).

The LAT data reported in this paper were collected from 2011 December 1 (MJD
55896) to 2013 January 31 (MJD 56323). During this time, the Fermi observatory operated almost entirely in survey mode.
The analysis was performed
with the ScienceTools software package version v9r27p1. The LAT data
were extracted within a region of interest centred at the
radio location of SBS 0846513. Only events belonging to the ‘Source’ class
were used. The time intervals when the rocking angle of the LAT was greater
than 52∘ were rejected. In addition, a cut on the
zenith angle () was applied to reduce contamination from
the Earth limb rays, which are produced by cosmic rays interacting with the upper atmosphere.
The spectral analysis was performed with the instrument response functions
P7SOURCE_V6 using an unbinned maximum-likelihood method implemented
in the Science tool gtlike. A Galactic diffuse emission model and isotropic component, which is the sum of
an extragalactic and residual cosmic ray background were used to model the background111http://fermi.gsfc.nasa.gov/ssc/data/access/lat/Background
Models.html. The normalizations of both components in the background model were allowed to vary freely during the spectral fitting.
We evaluated the significance of the -ray signal from the sources by means of the maximum-likelihood test statistic TS = 2log(likelihood) between models with and without a point source at the position of SBS 0846513 (Mattox et al., 1996). The source model used in gtlike includes all of the point sources from the second Fermi-LAT catalogue (2FGL; Nolan et al., 2012) that fall within of the source. The spectra of these sources were parametrized by power-law functions, except for 2FGL J0920.94441 for which we used a log-parabola as in the 2FGL catalogue. A first maximum-likelihood analysis was performed to remove from the model the sources having TS 10 and/or the predicted number of counts based on the fitted model . A second maximum-likelihood analysis was performed on the updated source model. In the fitting procedure, the normalization factors and the photon indices of the sources lying within 10∘ of SBS 0846513 were left as free parameters. For the sources located between 10∘ and 20∘, we kept the normalization and the photon index fixed to the values from the 2FGL catalogue.
As already shown in D’Ammando et al. (2012a), SBS 0846513 alternates between periods of low and high -ray activity and therefore was not consistently detected in rays during the Fermi mission to date. In particular, significant -ray activity was observed in 2011 June–July after a quiescent state extending back at least to the start of the Fermi mission. Integrating over the period 2011 December 1–2012 March 31 (MJD 55896–56017) the fit yielded a TS = 4. The 2 upper limit is 1.210-8 ph cm-2 s-1 in the 0.1–100 GeV energy range, assuming a photon index of . On the contrary, the fit with a power-law model to the data integrated over the period 2012 April 1–August 31 (MJD 56018–56170) in the 0.1–100 GeV energy range results in a TS = 851, with an integrated average flux of (12.0 0.9) 10-8 ph cm-2 s-1 and a photon index of = 2.13 0.05. Finally, over the period 2012 September 1–2013 January 31 (MJD 56171–56323) a TS of only 10 was obtained, with a 2 upper limit of 2.010-8 ph cm-2 s-1 in the 0.1–100 GeV energy range.
In order to test for curvature in the -ray spectrum of SBS 0846513 during 2012 April–August time frame we used a log-parabola (LP), (Landau et al., 1986; Massaro et al., 2004), as an alternative spectral model to the power law (PL). We obtained a spectral slope = 1.92 0.11 at the reference energy = 300 MeV, a curvature parameter around the peak = 0.09 0.04, with a 0.1–100 GeV flux of (11.0 0.8) 10-8 ph cm-2 s-1 and a TS = 888. We used a likelihood ratio test to check the PL model (null hypothesis) against the LP model (alternative hypothesis). These values may be compared, following Nolan et al. (2012), by defining the curvature test statistic TScurve=(TSLP - TSPL)= 37 corresponding to a 6 difference, indicating a significant curvature in the -ray spectrum of SBS 0846513 during 2012 April–August. A spectral curvature was also observed during the high activity state in 2011 June (D’Ammando et al., 2012a).
Fig. 1 shows the -ray light curve for the period 2012 April 1–August 28 using a log-parabola model and 1-week time bins. For the highest significance periods we also reported fluxes in 1-day time intervals. For each time bin, the spectral parameters for SBS 0846513 and for all the sources within 10∘ from it were frozen to the value resulting from the likelihood analysis over the entire period. If TS 10, 2 upper limits were evaluated. The systematic uncertainty in the flux measurement is energy dependent: it amounts to at 100 MeV, decreasing to at 560 MeV, and increasing to above 10 GeV (Ackermann et al., 2012).
The first emission peak was observed on 2012 May 24 (MJD 56071), with an average flux for that day of (50 12)10-8 ph cm-2 s-1 in the 0.1–100 GeV energy range, corresponding to an apparent isotropic -ray luminosity of 5 1047 erg s-1, a factor of 2 lower than the peak value observed in 2011 June (D’Ammando et al., 2012a). A second peak at higher flux with respect to the first one, (73 14)10-8 ph cm-2 s-1 (corresponding to an apparent isotropic -ray luminosity of 8 1047 erg s-1), was detected on 2012 August 7 (MJD 56146). In both of the flares, a doubling time scale of 1-2 days was observed. By means of the gtsrcprob tool we estimated that the highest energy photon detected from SBS 0846513 was observed on 2012 August 8 at a distance of 0.08∘ from the source with an energy of 16.1 GeV. Interestingly, this highest energy photon was detected at the peak of the 2012 flaring activity.
| Date | Date | Net exposure time | Net count rate | Photon index | Flux 0.3–10 keVa |
|---|---|---|---|---|---|
| (MJD) | (UT) | (sec) | (10-2 cps) | () | (10-13 erg cm-2 s-1) |
| 55915-55929 | 2011-12-20/2012-01-03 | 6291 | 1.7 0.2 | ||
| 56075 | 2012-05-27 | 1968 | 2.4 0.3 | ||
| 56085 | 2012-06-07 | 2782 | 1.5 0.2 | ||
| 56230 | 2012-10-30 | 4815 | 0.7 0.1 | ||
| 56261 | 2012-11-30 | 4815 | 0.7 0.1 | ||
| 56291 | 2012-12-30 | 4810 | 0.7 0.1 | ||
| 56322 | 2013-01-30 | 4700 | 1.2 0.2 |
3 Swift Data: Analysis and Results
The Swift satellite (Gehrels et al., 2004) performed ten observations of SBS 0846513 between 2011 December and 2013 January. The observations were performed with all three on-board instruments: the X-ray Telescope (XRT; Burrows et al., 2005, 0.2–10.0 keV), the Ultraviolet/Optical Telescope (UVOT; Roming et al., 2005, 170–600 nm) and the Burst Alert Telescope (BAT; Barthelmy et al., 2005, 15–150 keV).
The hard X-ray flux of this source is below the sensitivity of the BAT instrument for the short exposure of these observations and therefore the data from this instrument are not used. Moreover, the source was not present in the Swift BAT 70-month hard X-ray catalogue (Baumgartner et al., 2013).
The XRT data were processed with standard procedures (xrtpipeline v0.12.6), filtering, and screening criteria using the HEAsoft package (v6.12). The data were collected in photon counting mode for all of the observations. The source count rate was low ( 0.5 counts s-1); thus pile-up correction was not required. The data collected during the four observations performed between 2011 December 20 and 2012 January 3 were summed in order to have enough statistics to obtain a good spectral fit. Source events were extracted from a circular region with a radius of 20 pixels (1 pixel 2.36), while background events were extracted from a circular region with radius of 50 pixels away from the source region. Ancillary response files were generated with xrtmkarf, and account for different extraction regions, vignetting and point-spread function corrections. We used the spectral redistribution matrices v013 in the Calibration data base maintained by HEASARC222http://heasarc.nasa.gov/. Considering the low number of photons collected ( 200 counts) the spectra were rebinned with a minimum of 1 count per bin and we used the Cash statistic (Cash, 1979). We fitted the spectrum with an absorbed power-law using the photoelectric absorption model tbabs (Wilms et al., 2000), with a neutral hydrogen column density fixed to its Galactic value (2.91020cm-2; Kalberla et al., 2005). The fit results are reported in Table 1. As was seen in previous XRT observations (see D’Ammando et al., 2012a) the X-ray spectrum of SBS 0846513 is harder than the other NLSy1s (, e.g. Grupe et al., 2010), suggesting a significant contribution of inverse Compton radiation from a relativistic jet, similar to for FSRQs. We noted an increase of in the net count rate (and flux) observed on 2012 May 27 with respect to 2011 December–2012 January and up to a factor of 3 with respect to 2012 October–December, in agreement with the increase of the -ray activity observed by the Fermi-LAT on the same days. Unfortunately no simultaneous Swift observations are available during the 2012 August -ray flare. No significant change of the photon index was observed during the entire year 2012.
UVOT data in the , , , , , and filters were reduced with the HEAsoft package v6.12 and the 20120606 CALDB-UVOTA release. We extracted the source counts from a circle with 5 arcsec radius centred on the source and the background counts from a circle with 10 arcsec radius in a near, source-free region. As in D’Ammando et al. (2012a), we calculated the effective wavelengths, count-to-flux conversion factors, and amount of Galactic extinction in the UVOT bands by convolving the physical quantities with a power-law fit to the source flux and with the filter effective areas. The results are shown in Table 2. The differences with respect to D’Ammando et al. (2012a) are due to the new versions of both software and calibration files, as well as to the re-calibration of dust reddening by Schlafly & Finkbeiner (2011). For this reason we also re-analyse the observation performed on 2011 September 15, already presented in D’Ammando et al. (2012a).
| Filter | |||
|---|---|---|---|
| (Å) | ( Å-1) | (mag) | |
| 5437 | 2.60 | 0.072 | |
| 4374 | 1.47 | 0.095 | |
| 3489 | 1.65 | 0.110 | |
| 2676 | 4.40 | 0.160 | |
| 2270 | 8.35 | 0.200 | |
| 2136 | 5.99 | 0.190 |
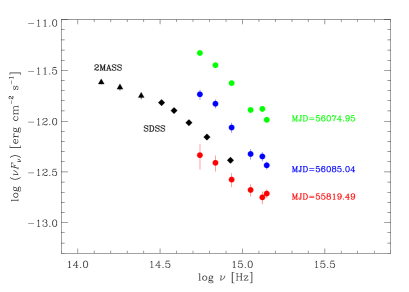
The UVOT photometry is reported in Table 3. We note a significant increase of more than 2 mag (a factor of 10 in flux density) in all of the UVOT filters on 2012 May 27 with respect to the observations performed on 2012 January 3. This high optical/UV activity is followed by a decrease of 1 mag (a factor of 2.5 in flux density) in 10 days. On October 30 the source returned to a low state, comparable to the level observed in 2012 January. These large variations in optical/UV are most likely due to a variation in the jet emission. In Fig. 2 we display the SEDs from 2012 May and June as well as the one from 2011 September, which was already presented in D’Ammando et al. (2012a). Archival Two Micron All Sky Survey (2MASS) and Sloan Digital Sky Survey (SDSS) data, collected on 1999 December 23 and 2000 November 23 respectively, are also shown. The comparison between the SEDs collected during different activity states confirms a significant increase in the synchrotron emission on 2012 May 27, soon after the first peak of the -ray activity, together with a small UV bump. We investigate the possibility that this is a hint of the contribution of the accretion disc emission. The signature of the accretion disc has been observed in FSRQs during both low activity states (e.g. 3C 454.3; Raiteri et al., 2011) and high activity states (e.g. PKS 1510089; D’Ammando et al., 2011), but in the second case that signature was also well detected during the low state. Therefore, the lack of this feature during the low state of SBS 0846513 in 2011 makes it unlikely that we are detecting accretion disc emission.
| Date (MJD) | Date (UT) | ||||||
|---|---|---|---|---|---|---|---|
| 55819 | 2011-09-15 | 19.180.30 | 19.750.19 | 19.290.17 | 19.470.15 | 19.620.15 | 19.620.10 |
| 55915 | 2011-12-20 | 18.81 | 19.89 | 19.57 | 20.430.27 | 19.69 | 20.140.31 |
| 55922 | 2011-12-27 | – | 20.11 | 19.650.33 | 20.11 | 19.780.21 | 20.480.38 |
| 55923 | 2011-12-28 | 18.88 | 19.84 | 19.420.36 | 20.140.16 | 19.83 | 20.130.29 |
| 55929 | 2012–01-03 | – | – | – | – | – | 20.42 |
| 56074 | 2012-05-27 | 16.660.07 | 17.340.06 | 16.920.06 | 17.500.07 | 17.440.03 | 17.800.06 |
| 56085 | 2012-06-07 | 17.680.12 | 18.300.11 | 18.010.12 | 18.590.13 | 18.620.11 | 18.920.09 |
| 56230 | 2012-10-30 | 19.18 | 20.21 | 19.850.38 | 19.690.26 | 19.980.11 | 20.360.29 |
| 56261 | 2012-11-30 | 18.86 | 19.780.28 | 19.81 | 19.880.32 | 19.560.26 | 20.220.16 |
| 56291 | 2012-12-30 | 19.010.27 | 20.270.34 | 20.03 | 20.060.13 | 20.190.31 | 20.450.25 |
| 56322 | 2013-01-30 | 19.300.35 | 20.32 | 19.97 | 20.31 | 20.110.29 | 20.550.28 |
4 Radio Data: Analysis and Results
4.1 OVRO

As part of an ongoing blazar monitoring programme, the OVRO 40-m radio telescope has observed SBS 0846513 at 15 GHz regularly since the end of 2007 (Richards et al., 2011). This monitoring programme includes about 1700 known and likely -ray loud blazars above declination . The sources in this program are observed in total intensity twice a week with a 4 mJy (minimum) and 3% (typical) uncertainty on flux densities. Observations are performed with a dual-beam (each 2.5 arcmin FWHM) Dicke-switched system using cold sky in the off-source beam as the reference. Additionally, the source is switched between beams to reduce atmospheric variations. The absolute flux density scale is calibrated using observations of 3C 286, adopting the flux density (3.44 Jy) from Baars et al. (1977). This results in about a 5% absolute scale uncertainty, which is not reflected in the plotted errors. SBS 0846513 was highly variable at 15 GHz during the OVRO 40-m telescope monitoring (Fig. 3), with a flux density rising from 145 mJy (at MJD 55976) to 384 mJy (at MJD 56044).
4.2 Medicina and Effelsberg 100-m
SBS 0846513 was observed at 8.4 GHz with the Medicina radio telescope on 2012 June 18 (MJD 56096), August 2 (MJD 56141), and October 4 (MJD 56204). The new Enhanced Single-dish Control System (ESCS) acquisition system, which provides increased sensitivity and supports observations with the cross scan technique was used. The typical on-source time was 1.5 minutes and the flux density was calibrated with respect to 3C 286, 3C 48, and NGC 7027. Since the signal-to-noise ratio in each scan across the source was low (typically ), a stacking analysis of the scans was performed. A slight increase of the 8.4 GHz flux density from 0.200.02 Jy to 0.260.02 Jy was observed between 2012 June and October. The observation on October 4 was carried out also at 5 GHz and, together with the OVRO data collected at 15 GHz on October 7, a spectral index of 0.60.2 was estimated between 5 and 15 GHz.
The radio spectra of SBS 0846513 were also observed with the Effelsberg 100-m telescope from 2.64 GHz to 32 GHz on 2012 July 1 (MJD 56109), August 5 (MJD 56144), and August 20 (MJD 56159) within the framework of a Fermi-related monitoring programme of -ray blazars (F-GAMMA programme; Fuhrmann et al., 2007; Angelakis et al., 2010). Further details about observation mode and data reduction are reported in Fuhrmann et al. (2008) and Angelakis et al. (2008). The flux density at 32 GHz increased from 0.320.03 Jy on 2012 July 1 to 0.410.05 Jy on August 20, consistent with the behaviour observed by OVRO at 15 GHz. In Fig. 4 we compare the radio spectrum collected by Effelsberg on 2011 April 30 (MJD 55681; already presented in D’Ammando et al., 2012a) to the spectra collected by Effelsberg on 2012 August 20 (MJD 56159), and OVRO and Medicina on 2012 October 4–7 (MJD 56204–56207). See the discussion in Section 6.3.

5 SED modeling
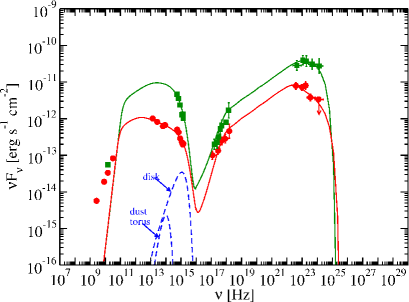
The lack of multi-wavelength data simultaneous with the 2011 June–July -ray flare observed by LAT did not allow us to investigate the SED of this source during a high state in D’Ammando et al. (2012a). Thanks to the Swift observations performed in 2012 May, soon after the new -ray flare, we are now able to characterize the flaring state of the source and compare it with a quiescent state. In Fig. 5, we plot the SED during a quiescent state in 2011 from D’Ammando et al. (2012a), and a simultaneous SED based on the flare in 2012 May. The flaring state includes the LAT spectrum built with data centred on 2012 May 20 to 29 (MJD 56067–56076), the Swift (UVOT and XRT) data collected on 2012 May 27 (MJD 56074) and the OVRO 40-m data closest to the -ray peak, collected on 2012 May 17 (MJD 56064). In addition to the quiescent state presented in D’Ammando et al. (2012a), we modelled the 2012 May flaring state with a combination of synchrotron, synchrotron self-Compton (SSC), and external Compton from dust torus emission. The description of the model can be found in Finke et al. (2008) and Dermer et al. (2009) and jet powers were calculated assuming a two-sided jet. The modelling results are presented in Fig. 5 and Table 4. For some FSRQs, it has been found that the fits to the flaring and quiescent states can be made by varying just the electron distribution, while keeping the other parameters fixed (e.g. PKS 0537441, D’Ammando et al., 2013a). Our first attempts to fit the 2012 flaring state by varying only the electron distribution parameters failed. We subsequently adjusted the dust torus parameters, the Lorentz factor, and the magnetic field in order to reproduce the flaring state. We then attempted to reproduce the 2011 quiescent state by varying only the electron distribution parameters from the flaring state fit. These attempts also failed. Finally, we found that by varying the magnetic field as well as the electron distribution parameters we could reasonably model the quiescent state. It has been suggested that some flares from FSRQs require a change in the magnetic field strength (e.g. PKS 0208512, Chatterjee et al., 2013), and this result is consistent with that suggestion.
The dust component used in this paper is significantly fainter than that used for the SED modeling of the quiescent state in D’Ammando et al. (2012a), but it is compensated for by the higher Lorentz factor. Both the quiescent and flaring state models shown in Table 4 are near equipartition between the electron and the magnetic field energy densities. We noted a significant shift of the synchrotron peak () to higher frequencies from 21012 Hz during the quiescent state to 21013 Hz during the flaring state, similar to FSRQs (e.g. PKS 1510089, D’Ammando et al., 2011). The flaring state has higher jet powers in terms of both electrons and magnetic field. Also, for both the flaring and quiescent states, a super-exponential cutoff at high energies in the electron distribution () was required so that the observed SEDs could be reasonably reproduced. If the jet is conical and the emitting region takes up the entire cross section of the jet, the jet half-opening angle will be , consistent with the opening angles measured from VLBI for many blazars (e.g. Jorstad et al., 2005). In Fig. 5, the blue bump from the accretion disc is also plotted, assuming a conservative value for the BH mass of (see the discussion on the BH mass of this source in D’Ammando et al., 2012a) and a luminosity about 10 times that of the dust torus. The disc luminosity is radiating at of the Eddington luminosity, quite a low value. This value is constrained by the lack of a blue bump observed from this source in the quiescent state, and could not, therefore, be significantly higher.
The considered synchrotron component is self-absorbed below 1011 Hz. A larger radius of the blob is necessary to also fit the radio data, but this is not compatible with the rapid variability observed in rays during the flaring state. An alternative solution is that a small compact region responsible for the -ray flare is nearly co-spatial with the region producing the radio outburst, as proposed e.g. by Marscher & Jorstad (2010).
| Parameter | Symbol | 2011 Quiescent State | 2012 Flaring State |
|---|---|---|---|
| Redshift | 0.5835 | 0.5835 | |
| Bulk Lorentz Factor | 40 | 40 | |
| Magnetic Field [G]****Parameters changed between the quiescent and the flaring state. | 0.20 | 0.25 | |
| Variability Time-Scale [s] | 1 | 1 | |
| Comoving radius of blob [cm] | R | 7.61016 | 7.61016 |
| Jet Height [cm] | |||
| Low-Energy Electron Spectral Index | 2.4 | 2.4 | |
| High-Energy Electron Spectral Index****Parameters changed between the quiescent and the flaring state. | 3.3 | 3.0 | |
| Minimum Electron Lorentz Factor | |||
| Break Electron Lorentz Factor****Parameters changed between the quiescent and the flaring state. | |||
| Maximum Electron Lorentz Factor****Parameters changed between the quiescent and the flaring state. | |||
| Dust Torus luminosity [erg s-1] | |||
| Dust Torus temperature [K] | |||
| Dust Torus radius [cm] | |||
| Jet Power in Magnetic Field [erg s-1] | |||
| Jet Power in Electrons [erg s-1] |
6 Discussion and conclusions
After the spatial association between the -ray source and the counterpart at lower energies presented in D’Ammando et al. (2012a), the significant increase of activity detected by Swift and Fermi almost simultaneously in the optical, UV, X-ray and -ray bands in 2012 May (see Fig. 7) has enabled us to firmly identify the -ray source with the NLSy1 SBS 0846513. The radio-to--ray data collected between 2011 December and 2013 January allowed us also to investigate some properties of this source.
6.1 Radio variability and proper motion

Contrary to what was observed in 2011 during the first -ray flaring event of SBS 0846513 detected by Fermi-LAT (D’Ammando et al., 2012a), three outbursts are clearly seen in the 15 GHz light curve, between 2012 May and 2013 January (see Figs. 3 and 7). These data indicate a significant increase of the flux density at 15 GHz starting close in time to the 2012 May -ray flare. In particular, an increase by a factor of 2.5 was observed between 2012 February 19 (MJD 55976) and 2012 May 7 (MJD 56054). The peak flux density of 384 mJy reached during the outburst is the highest value observed at 15 GHz for this source by the OVRO 40-m telescope since 2011 January. Previously, at the end of 2009, a strong radio flare was detected at 15 GHz, reaching a peak flux density of 517 mJy on 2009 December 9 (see D’Ammando et al., 2012a). Following the procedure described in Orienti et al. (2013) the analysis of the 6-epoch data-set collected by the Monitoring Of Jets in Active galactic nuclei with VLBA Experiments (MOJAVE) programme333The MOJAVE data archive is maintained at http://www.physics.purdue.edu/MOJAVE during 2011–2013 indicates that a superluminal jet component is moving away from the core with an apparent angular velocity of (0.270.02) mas yr-1, which corresponds to (9.30.6) (Fig. 6). This velocity estimate is more accurate than the value derived in D’Ammando et al. (2012b) thanks to the larger number of observing epochs available spanning a longer time interval. The time of zero separation estimated by means of a linear regression fit is = 2009.646 (2009 August 24). This suggests a strict connection between the 2009 radio flare and the ejection of this component. However, the uncertainty in the velocity does not allow us to accurately constrain the precise time of zero separation, which could be between 2009.445 (i.e. 2009 June 11) and 2009.821 (i.e. 2009 October 27) (Fig. 6). Interestingly, no significant -ray activity from SBS 0846513 was detected simultaneously to the radio outburst and the ejection of this knot (see D’Ammando et al., 2012a). This is different from what is observed in many bright blazars like PKS 1510089, where -ray flares occur close in time with the ejection of superluminal knots and an increase of both the total and polarized radio flux (see e.g. Marscher et al., 2010, 2012; Orienti et al., 2013). On the contrary, a tentative detection of a new feature at about 0.25 mas from the core was obtained in the last two epochs of MOJAVE observations. This new component is separating from the core with an angular velocity of 0.23 mas yr-1, corresponding to an apparent velocity of 7.7. This gives a time of zero-separation of 2011.70 (2011 September 12). The new feature should have been ejected close in time with the -ray flare in 2011 June–July. The availability of only two observing epochs, and the large uncertainties on the blob position do not allow us to confirm this result so far. If this new component is confirmed by further MOJAVE epochs, it will be an indication of a different relation between the knot ejection and the -ray activity for SBS 0846513 in 2009 and 2011.
6.2 Radio and -ray connection in 2012

The -ray activity observed in 2011 and 2012 for SBS 0846513 could be related to different flaring episodes. No significant -ray emission was detected during 2011 December–2012 March (see Fig. 7) or during 2011 September–November (D’Ammando et al., 2012a). It is unlikely that the 2012 May radio flare is related to the 2011 June -ray flare previously observed by Fermi-LAT. Therefore, a different connection between radio and -ray emission is possible for the two high activity periods, as has been observed for some blazars (e.g. PKS 1510089; Orienti et al., 2011, 2013). In the case of the high activity observed in 2012 May, we first consider a common origin for the radio and -ray emission (with the -ray and radio peaks labelled with (a) and (I), respectively, in Fig. 7). The flux increase in these bands occurs close in time, suggesting that the radio and -ray emission may originate in the same part of the jet, likely at large distance from the central engine, where the opacity effects should be less severe. No new superluminal component has been detected so far that is likely related to this flare. Further high spatial resolution observations of the source are necessary to detect a possible new component ejected at that period. A second radio peak was observed on 2012 October 7 (MJD 56207; labelled with (II) in Fig. 7) with a similar flux density of that observed in May. This peak is delayed by 2 months with respect to the -ray flare observed on 2012 August 7 (MJD 56146; labelled with (b) in Fig. 7). This could be an indication that the second -ray flaring activity was produced close to the BH, where the opacity effects should be more severe, causing a time delay at radio wavelengths.
The presence of a third radio outburst during 2012 December–2013 January peaking on 2012 December 30 (MJD 56291; labelled with (III) in Fig. 7) suggests an alternative scenario where the first -ray flare in 2012 May is not directly connected with the radio activity observed by OVRO 40-m in the same period. In this case, the 2012 May and August -ray flaring episodes are related to the radio activity observed at 15 GHz on 2012 October and 2013 January, respectively. In both cases the peak of the radio emission is delayed with respect to the -ray one by 4.5 months. This delay may be due to opacity in the core region of the source at radio frequencies, suggesting that the -ray emission is produced relatively close to the BH in both the 2012 May and August -ray flares. On the basis of the delay between -ray emission and radio emission at 15 GHz usually observed in blazar-like objects (see e.g. Pushkarev et al., 2010), this second scenario seems to be favoured. Taking into account the lack of significant -ray emission from SBS 0846513 between 2011 December and 2012 April, it is difficult to associate the radio activity observed in 2012 May with a previous -ray flare. This further suggests a complex relation between the radio and -ray emission in this source.
The 15 GHz light curve is highly variable (see Fig. 3). For this reason we can estimate the variability Doppler factor on the basis of the radio data collected during an outburst in a similar manner to that proposed by Valtaoja et al. (1999). Given the frequent time sampling during the first part of the OVRO light curve we can estimate the rise time () of the first flaring episode. However, the second and third outbursts were not well sampled by the observations, precluding a reliable determination of its variability time-scale. We consider as the time interval of the flux density variation between the maximum and minimum flux density of a single outburst . This assumption implies that the minimum flux density corresponds to a stationary underlying component and that the variation is due to a transient component. On the basis of the causality argument we can derive the brightness temperature and then the variability Doppler factor. Following D’Ammando et al. (2013b) we compute the variability brightness temperature by means of
| (1) |
where is the Boltzmann constant, is the observing frequency, and is the spectral index. In the case of the first outburst we have d and mJy. If in equation 1 we consider these values and we assume , we obtain K, which is much larger than the value derived for the Compton catastrophe (see e.g. Kellermann & Pauliny-Toth, 1969). Assuming that such a high value is due to Doppler boosting, we can estimate the variability Doppler factor , by means of
| (2) |
where is the intrinsic brightness temperature. We assume a typical value for the intrinsic brightness temperature of 1011 K (see e.g. Lähteenmäki & Valtaoja, 1999), close to the “equipartition” value of 51010 K suggested by Readhead (1994). Considering = 1011 K in equation 2 we obtain 11 for SBS 0846513, which is in agreement with the variability Doppler factor derived for blazars (see e.g. Hovatta et al., 2009). Note that the radio emission used to derive the and the optical through -ray SED may originate from different regions of the jet which could have different Doppler factors.
6.3 Comparison with -ray blazars
The simultaneous spectrum of SBS 0846513 collected by Effelsberg during quiescent state in 2011 April showed a flat spectrum ( 0) up to 32 GHz. After the -ray flaring activity occurred in 2012 May and August, significant radio spectral variability was observed (Fig. 4), with the spectrum turning out to be inverted ( 0.6). This is a typical blazar-like behaviour, which has already been seen in other -ray emitting NLSy1s (see e.g. Angelakis et al., 2013). We also found that the SED of SBS 0846513 in both the flaring and quiescent states is rather typical for a FSRQ, with a Compton dominance (i.e. the ratio between the luminosity of the high and low-energy peak) of 5 as well as an X-ray spectrum with a photon index = 1.5–1.6, in agreement with what was pointed out in D’Ammando et al. (2012a). The high-energy part of the source spectrum can be modelled by an external Compton component of seed photons from a dust torus, similar to FSRQs. Unlike some FSRQs (e.g. PKS 0537441; D’Ammando et al., 2013a), the SEDs of the flaring and quiescent state cannot be modelled by changing only the electron distribution; a change of the magnetic field strength is also required. Although the fits are not unique, this is consistent with the modeling of different activity states of PKS 0208512, where a change in magnetic filed also seemed to be required (Chatterjee et al., 2013). A significant shift of the synchrotron peak to higher frequencies was observed during the 2012 May flaring episode, similar to FSRQs (e.g. PKS 1510089; D’Ammando et al., 2011).
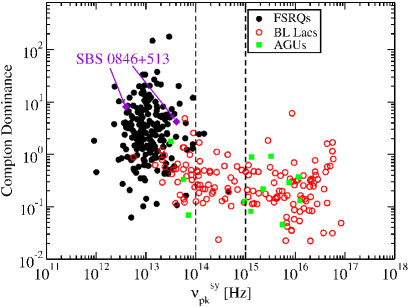
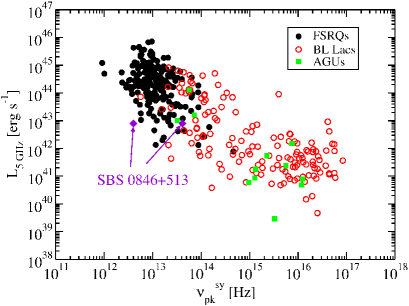
During the -ray flaring episodes in 2011–2012 SBS 0846513 reached an apparent isotropic -ray luminosity of 51047– 1048 erg s-1, comparable to those of the bright FSRQs. Recently, a correlation between Compton dominance () and synchrotron peak frequency in blazars was found by Finke (2013). Considering 21012 Hz and 21013 Hz (see Fig. 5) for the quiescent and flaring activity state of SBS 0846513, respectively, the source seems to lie in the vs plot in the region occupied by the FSRQs (see Fig. 8; adapted from Finke, 2013). This suggests that external Compton scattering is the dominant mechanism for producing high-energy emission in SBS 0846513. From the observation performed by the Effelsberg telescope on 2012 July we derived a 5 GHz radio luminosity 81042 erg s-1. Considering the estimated during the flaring state, SBS 0846513 occupies the transition region between FSRQs and BL Lac objects in the vs plot, originally proposed by Fossati et al. (1998) in the context of the blazar sequence, and then applied by Finke (2013) to all blazars detected during the first two years of Fermi operation (Fig. 9). It is interesting to note that considering the estimated during the low state, SBS 0846513 seems to lie slightly outside the blazar sequence. However, we point out that the determination of the depends on the amount of data available across the electromagnetic spectrum and the SED modeling, implying uncertainties on .
The main difference with the powerful FSRQs seems to be the lack of clear evidence for the accretion disc emission, usually detectable at least during the low state. However, it is worth mentioning that the accretion disc emission is not visible in all FSRQs (see e.g. D’Elia et al., 2003) and -ray emitting NLSy1 (e.g. PKS 2004447, Abdo et al., 2009).
Five radio-loud NLSy1s have been detected by the Fermi-LAT (Abdo et al., 2009; D’Ammando et al., 2012a), stimulating interest in this class of AGN and in their detection in rays. Until now however, none of the new candidate -ray emitting NLSy1s were detected with high significance (see e.g. D’Ammando et al., 2013c; Foschini, 2013). SBS 0846513 was detected only when it entered a high activity state, having not been detected during the first two years of Fermi operation. This suggests that the flux variability is a key consideration when searching for NLSy1s in rays. However, the discoveries of NLSy1s did not always occur during high -ray activity states (e.g. PKS 1502036 and PKS 2004447; Abdo et al., 2009; D’Ammando et al., 2013b). Investigating the radio properties of the first sample of 23 radio-loud NLSy1 presented by Yuan et al. (2008) we note that the object with the highest radio-loudness, B3 1044476, has not been detected in rays by Fermi-LAT. This indicates that the radio-loudness could be a useful proxy for the jet production efficiency, but not necessarily for selecting the best candidates for -ray detection with LAT. In the same way, an apparent brightness temperature of 1013 K, comparable to that of SBS 0846513, was observed for TXS 1546353. Such a high brightness temperature could be an indication of Doppler boosted emission from a relativistic jet orientated close to our line-of-sight, but from which no -ray emission has been detected to date.
The multi-frequency observations presented here give new clues on the astrophysical mechanisms at work in SBS 0846513, though leaving open questions on the nature of this source. Further multi-wavelength monitoring campaigns are needed to achieve a complete understanding of the physical processes occurring in this source and the others detected in rays by Fermi-LAT.
Acknowledgments
The Fermi LAT Collaboration acknowledges generous ongoing support from a number of agencies and institutes that have supported both the development and the operation of the LAT as well as scientific data analysis. These include the National Aeronautics and Space Administration and the Department of Energy in the United States, the Commissariat à l’Energie Atomique and the Centre National de la Recherche Scientifique / Institut National de Physique Nucléaire et de Physique des Particules in France, the Agenzia Spaziale Italiana and the Istituto Nazionale di Fisica Nucleare in Italy, the Ministry of Education, Culture, Sports, Science and Technology (MEXT), High Energy Accelerator Research Organization (KEK) and Japan Aerospace Exploration Agency (JAXA) in Japan, and the K. A. Wallenberg Foundation, the Swedish Research Council and the Swedish National Space Board in Sweden. Additional support for science analysis during the operations phase is gratefully acknowledged from the Istituto Nazionale di Astrofisica in Italy and the Centre National d’Études Spatiales in France.
We thank the Swift team for making these observations possible, the duty scientists, and science planners. The OVRO 40-m monitoring program is supported in part by NASA grants NNX08AW31G and NNX11A043G, and NSF grants AST-0808050 and AST-1109911. This paper is partly based on observations with the 100-m telescope of the MPIfR (Max-Planck-Institut für Radioastronomie) at Effelsberg and the Medicina telescope operated by INAF–Istituto di Radioastronomia. We acknowledge A. Orlati, S. Righini, and the Enhanced Single-dish Control System (ESCS) Development Team. FD, MO, MG, CR acknowledge financial contribution from grant PRIN-INAF-2011. This research has made use of data from the MOJAVE database that is maintained by the MOJAVE team (Lister et al. 2009, AJ, 137, 3718). IM and VK were supported for this research through a stipend from the International Max Planck Research School (IMPRS) for Astronomy and Astrophysics at the University of Bonn and Cologne. We thank D. Horan, P. Bruel, and S. Digel for helpful comments and suggestions.
References
- Abazajian et al. (2004) Abazajian, K., et al. 2004, AJ, 128, 504
- Abdo et al. (2009) Abdo, A. A., et al. 2009, ApJ, 707, L142
- Ackermann et al. (2012) Ackermann, M., et al. 2012, ApJ, 747, 104
- Angelakis et al. (2008) Angelakis, E., Fuhrmann, L., Marchili, N., Krichbaum, T. P., Zensus, J. A. 2008, Mem. Soc. Astron. Ital., 79, 1042
- Angelakis et al. (2010) Angelakis, E., Fuhrmann, L., Nestoras, I., Zensus, J. A, Marchili, N., Pavlidou, V. Krichbaum, T. P. 2008, proceedings of the workshop “Fermi meets Jansky - AGN in Radio and Gamma-Rays”, Savolainen, Ros, Porcas, and Zensus (eds.), MPIfR, Bonn (Germany) [arXiv:1006.5610]
- Angelakis et al. (2013) Angelakis, E., et al. 2013, proceedings of the conference “Nuclei of Seyfert Galaxies and QSO - Central Engine and Conditions of tar Formation”, MPIfR, Bonn (Germany) [arXiv:1304.1706]
- Anton et al. (2008) Anton, S., Browne, I. W. A., Marcha, M. J. 2008, AA, 490, 583
- Atwood et al. (2009) Atwood, W. B., et al. 2009, ApJ, 697, 1071
- Baars et al. (1977) Baars, W. M., et al. 1977, AA, 61, 99
- Barthelmy et al. (2005) Barthelmy, S. D., et al. 2005, SSRv, 120, 143
- Baumgartner et al. (2013) Baumgartner, W. H., et al. 2013, ApJS, 207, 19
- Böttcher & Dermer (2002) Böttcher, M., & Dermer, C. D. 2002, ApJ, 564, 86
- Burrows et al. (2005) Burrows, D. N., et al. 2005, SSRv, 120, 165
- Cardelli et al. (1989) Cardelli, J. A., et al. 1989, ApJ, 345, 245
- Cash (1979) Cash, W. 1979, ApJ, 228, 939
- Chatterjee et al. (2013) Chatterjee, R., Fossati, G., Urry, C. M., et al. 2013, ApJ, 763, L11
- D’Ammando Ciprini (2011) D’Ammando, F., Ciprini, S. 2011, The Astronomer’s Telegram 3429
- D’Ammando et al. (2011) D’Ammando, F., et al. 2011, AA, 529, 145
- D’Ammando et al. (2012a) D’Ammando, F., et al. 2012a, MNRAS, 426, 317
- D’Ammando et al. (2012b) D’Ammando, F., Orienti, M., Finke, J. 2012b, AIPC, 1505, 570
- D’Ammando et al. (2013a) D’Ammando, F., et al. 2013a, MNRAS, 431, 2481
- D’Ammando et al. (2013b) D’Ammando, F., et al. 2013b, MNRAS, 433, 952
- D’Ammando et al. (2013c) D’Ammando, F., Tosti, G., Orienti, M., Finke, J. 2013c, 2012 Fermi Symposium proceedings - eConf C121028 [arXiv:1303.3030]
- D’Ammando & Orienti (2013) D’Ammando, F., Orienti, M. 2013, The Astronomer’s Telegram 4694
- D’Elia et al. (2003) D’Elia, V., Padovani, P., & Landt, H. 2003, MNRAS, 339, 1081
- Deo et al. (2006) Deo, R. P., Crenshow, D. M., Kraemer, S. B. 2006, AJ, 132, 321
- Dermer et al. (2009) Dermer, C. D., Finke, J. D., Krug, H., Böttcher, M. 2009, ApJ, 692, 32
- Finke et al. (2008) Finke, J. D., Dermer, C. D., Böttcher, M. 2008, ApJ, 686, 181
- Finke (2013) Finke, J. D., 2013, ApJ, 763, 134
- Foschini et al. (2011) Foschini, L., et al. 2011, MNRAS, 413, 1671
- Foschini (2013) Foschini, L., 2013, Proceedings of the Conference “Nuclei of Seyfert galaxies and QSOs - Central engine & conditions of star formation”, Bonn (Germany) [arXiv:1301.5785]
- Fossati et al. (1998) Fossati, G., Maraschi, L., Celotti, A., Comastri, A., & Ghisellini, G. 1998, MNRAS, 299, 433
- Fuhrmann et al. (2007) Fuhrmann, L., Zensus, J. A., Krichbaum, T. P., Angelakis, E., Readhead, A. C. S. 2007, The First GLAST Symposium (AIP Conf. Proc. 921), ed. S. Ritz, P. Michelson, C. A. Meegan (Melville, NY: AIP), 249
- Fuhrmann et al. (2008) Fuhrmann, L., et al. 2008, AA, 490, 1019
- Gehrels et al. (2004) Gehrels, N., et al. 2004, ApJ, 611, 1005
- Grupe et al. (2010) Grupe, D., et al. 2010, ApJS, 187, 64
- Hovatta et al. (2009) Hovatta, T., et al. 2009, AA, 494, 527
- Kalberla et al. (2005) Kalberla, P. M. W., et al. 2005, AA, 440, 775
- Kellermann & Pauliny-Toth (1969) Kellermann, K. I., & Pauliny-Toth, I. I. K., 1969, ApJ, 155, L71
- Jorstad et al. (2005) Jorstad, S. G., Marscher, A. P., Lister, M. L., et al. 2005, AJ, 130, 1418
- Lähteenmäki & Valtaoja (1999) Lähteenmäki, A., & Valtaoja, E. 1999, ApJ, 521, 493
- Landau et al. (1986) Landau, R., et al. 1986, ApJ, 308, 78
- Lister et al. (2009) Lister, M., et al. 2009, AJ, 137, 3718
- Markarian et al. (1989) Markarian, B. E., Lipovetsky, V. A., Stepanian, J. A., Erastova, L. K., Shapovalova, A. I. 1989, SoSAO, 62, 5
- Marscher (2010) Marscher, A. 2010, in Lecture Notes in Physics 794, ed. T. Belloni (Berlin:Springer), 173
- Marscher et al. (2010) Marscher, A. P., et al. 2010, ApJ, 710, L126
- Marscher & Jorstad (2010) Marscher, A. P., & Jorstad, S. G. 2010 in Fermi meets Jansky: AGN in Radio and Gamma Rays, ed. T. Savolainen, E. Ros, R. W. Porcas, and J. A. Zensus, 171 [arXiv:1055.5551]
- Marscher et al. (2012) Marscher, A. P., Jorstad, S. G., Agudo, I., MacDonald, N. R., Scott, T. L. 2012, 2012 Fermi Jansky Proceedings - eConf C1111101 [arXiv:1204.6707]
- Massaro et al. (2004) Massaro, E., et al. 2004, AA, 413, 489
- Mattox et al. (1996) Mattox, J. R., et al. 1996, ApJ, 461, 396
- Nemmen et al. (2012) Nemmen, R. S., Georganopoulos, M., Guiriec, S., Meyer, E. T., Gehrels, N., Sambruna, R. M. 2012, Science, 338, 1445
- Nolan et al. (2012) Nolan, P., et al. 2012, ApJS, 199, 31
- Orienti et al. (2011) Orienti, M., et al. 2011, MNRAS, 417, 359
- Orienti et al. (2013) Orienti, M., et al. 2013, MNRAS, 428, 2418
- Pushkarev et al. (2010) Pushkarev, A. B., Kovalev, Y. Y., Lister, M. L. 2010, ApJ, 722, L7
- Raiteri et al. (2011) Raiteri, C. M., et al. 2011, AA, 534, 87
- Readhead (1994) Readhead, A. C. S. 1994, ApJ, 426, 51
- Richards et al. (2011) Richards, J. L., et al. 2011, ApJS, 194, 29
- Roming et al. (2005) Roming, P. W. A., et al. 2005, SSRv, 120, 95
- Schlafly & Finkbeiner (2011) Schlafly, E. F., & Finkbeiner, D. P. 2011, ApJ, 737, 103
- Shen et al. (2011) Shen, Y., et al. 2011, ApJS, 194, 45
- Valtaoja et al. (1999) Valtaoja, E., Lähteenmäki, A., Teräsranta, H., Lainela, M. 1999, ApJS, 120, 95
- Wilms et al. (2000) Wilms, J., et al. 2000, ApJ, 542, 914
- Yuan et al. (2008) Yuan, W., et al. 2008, ApJ, 685, 801
- Zhou et al. (2005) Zhou, H.-Y., Wang, T.-G., Dong, X.-B., Li, C., & Zhang, X.-G. 2005, ChJAA, 5, 41
- Zhou et al. (2006) Zhou, H.-Y., et al. 2006, ApJS, 166, 128