Multidimensional optomechanical cantilevers for high frequency atomic force microscopy
Abstract
High-frequency atomic force microscopy has enabled extraordinary new science through large bandwidth, high speed measurements of atomic and molecular structures. However, traditional optical detection schemes restrict the dimensions, and therefore the frequency, of the cantilever - ultimately setting a limit to the time resolution of experiments. Here we demonstrate optomechanical detection of low-mass, high-frequency nanomechanical cantilevers (up to 20 MHz) that surpass these limits, anticipating their use for single-molecule force measurements. These cantilevers achieve 2 fm displacement noise floors, and force sensitivity down to 132 aN. Furthermore, the ability to resolve both in-plane and out-of-plane motion of our cantilevers opens the door for ultrasensitive multidimensional force spectroscopy, and optomechanical interactions, such as tuning of the cantilever frequency in situ, provide new opportunities in high-speed, high-resolution experiments.
1 Introduction
Since the atomic force microscope (AFM) was first demonstrated [1], it has become an indispensable tool for probing the physical characteristics of microscopic systems. Working by Hooke’s Law, = , the tip of the AFM is displaced proportional to an applied force, transducing forces into a detectable signal. This has been used to great effect for surface imaging, where interatomic forces between an AFM tip and substrate are measured as raster images of the surface structures down to the atomic scale [2] and beyond [3]. The ability to use AFMs in liquid environments [4] has led to their widespread use in biological applications [5], such as live imaging of biological specimens [6], and non-scanning applications like studying receptor-ligand binding of surface proteins [7] and deciphering the mechanics of proteins through unfolding experiments [8, 9]. For both aqueous and high-speed AFM (HS-AFM), it is advantageous to use low-mass, high-frequency cantilevers [10], yet current technology is limited in detecting the motion of such cantilevers [11].
In biological applications, where the sample is often continuously moving, the time resolution of the measurement process is critical. High-speed AFM [12] has enabled the dynamics of molecular systems to be visualized at speeds of up to 80 ms for a pixel image [13]. This has permitted the real-time imaging of individual motor proteins [13], proteins diffusing and interacting in lipid bilayers [14], and the folding of synthetic DNA origami structures [15]. When operated dynamically [16], the maximum time resolution of the measurement is limited by the frequencies of the structural modes of the cantilever. In the simple harmonic approximation these are , where and are the effective spring constant and mass of a particular mode [17]. Since is chosen to optimize the displacement response of the AFM to the application’s characteristic forces, minimizing the dimensions, and therefore , grants access to the regime of both delicate force sensing and exceptional time resolution through increased mechanical frequencies.

Common methods to detect the displacement of a cantilever include reflecting a laser beam off the cantilever onto a position sensitive photodetector, termed optical beam deflection (OBD), or recombining the reflected beam interferometrically. An important benchmark of a displacement detection system is the displacement noise floor: the noise corresponding to the minimum displacement resolvable by the detection system. OBD has obtained displacement noise floors of 5 fm [18], while an all-fiber interferometer has achieved noise floors of 2 fm [19], both with standard low-frequency cantilevers ( 300 kHz). However, these detection methods scale poorly as the dimensions of the nanomechanical devices fall below the spot size of the laser beam ( 1 ) [10], creating an effective limit on cantilever sizes (and frequencies) that has already been reached [11].
The technique of optomechanics [21, 22, 23, 24, 25, 26] offers unprecedented displacement sensitivity while being well suited for nanoscale devices. By spatially localizing optical cavity modes with a mechanical resonator, motional degrees of freedom are coupled to frequency (or phase [27]) shifts of the optical modes. Monitoring the transmission of laser light coupled to the optical cavity then provides sensitive readout of the mechanical motion, exemplified by experiments measuring the motion of nanomechanical resonators to the standard quantum limit (SQL)—the theoretical noise floor of a continuous measurement determined from dynamical backaction and photodetector shot noise [27]—as well as observing quantum behavior [28].
2 Results and discussion
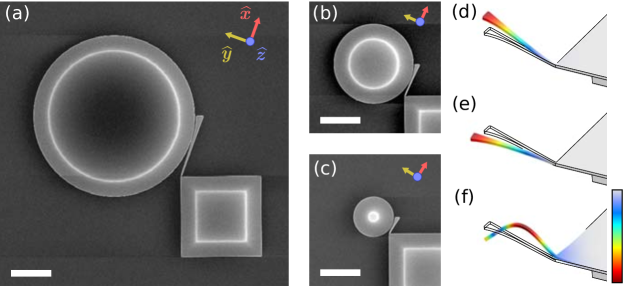
Here, three sizes of low mass, MHz frequency, optomechanical devices suited to AFM applications are presented. They consist of cantilever-style nanomechanical resonators coupled to the whispering gallery modes of optical microdisks and are commercially fabricated from a 215 nm thick silicon layer of a silicon-on-insulator (SOI) wafer, ensuring simple fabrication with automatic and reproducible optomechanical cavity formation. The cantilevers have lengths of 8, 4, and 2 , and are on average 400 nm wide, broadening towards the end to allow binding of molecules to the cantilever, for pulling experiments, without compromising the optical cavity quality ( 3 for 20 diameter disk). They couple to disks of 20, 10 and 5 diameter respectively, and scanning electron microscopy (SEM) images, and finite element method (FEM) simulations of the first three structural modes of the 8 long cantilever, are shown in figure 1. We envision single molecule force (folding/unfolding) experiments as the ideal AFM application for these devices, as this would not degrade the optical of micro disk due to a sample, nor would a separate tip need to be attached.
| Cantilever Length | (air) | (air) | (air) | |||||
|---|---|---|---|---|---|---|---|---|
| N/m | MHz | MHz / nm | ||||||
| 2 | out-of-plane | 140 | 2.2 | 20.1 | 3,600 (120) | 20 (18) | 290 (1,500) | 2,000 |
| 2 | in-plane | 180 | 3.3 | 21.4 | 5,000 | 120 | 280 | 340 |
| 4 | out-of-plane | 240 | 0.30 | 5.43 | 4,300 (35) | 2 (3) | 180 (2,000) | 720 |
| 4 | in-plane | 260 | 0.48 | 7.04 | 4,400 | 300 | 200 | 6 |
| 8 | out-of-plane | 610 | 0.087 | 1.90 | 6,500 (22) | 18 (17) | 135 (2,300) | 150 |
| 8 | in-plane | 610 | 0.11 | 2.18 | 7,800 | 390 | 132 | 7 |
| 8 | 2nd out-of-plane | 610 | 13 | 23.2 | 5,600 | 55 | 510 | 57 |
Despite the slightly larger displacement noise floor, the design presented here has a number of advantages over other optomechanical cantilevers [29, 30, 31, 32]. Our devices were fabricated at a commercial foundry (IMEC) using deep UV photolithography with a feature resolution of approximately 130 nm. This allows for the straightforward, high-throughput fabrication of many such devices for commercial applications, which time-consuming electron beam lithography does not provide. Further, our devices showcase resonators with two nearly orthogonal modes: in-plane (figure 1(d)) and out-of-plane (figure 1(e)). The out-of-plane mode is a better fit to traditional raster scanning or molecule pulling experiments, as current generations of AFMs also operate out-of-plane. Additionally, these orthogonal modes occur at similar frequencies, providing multi-dimensional force sensing capabilities—a feature especially suited for applications such as protein unfolding experiments, where the unfolding energy landscapes can be highly dependent on the direction of applied force [9].
To measure the motion of our device’s cantilever, single mode light from a tunable diode laser (New Focus TLB-6330, 1550-1630 nm) is passed through a dimpled, tapered optical fiber [33] placed on the top edge of the optical microdisk opposite to the mechanical device (figure 2(b)) using three axes of nanopositioning stages. By slightly detuning the laser from an optical resonance of the disk, modulations in the frequency of the optical modes induced by the movement of the mechanical resonator are transduced to a voltage signal from a photodetector (PD) measuring the transmission through the tapered fiber. The high-frequency spectral density of the PD voltage () is analyzed to identify peaks corresponding to cantilever modes. A lock-in amplifier (Zurich H2FLI) is then used to measure across a narrow bandwidth at the mechanical peak frequency, and the polarization and frequency of the tunable laser is iteratively optimized to maximize the mechanical signal (see figure 2). Finally, the lock in amplifier is discretely stepped to measure across the desired frequency range.
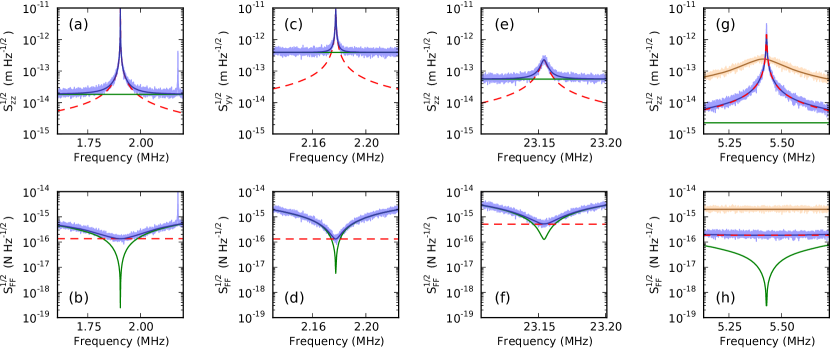
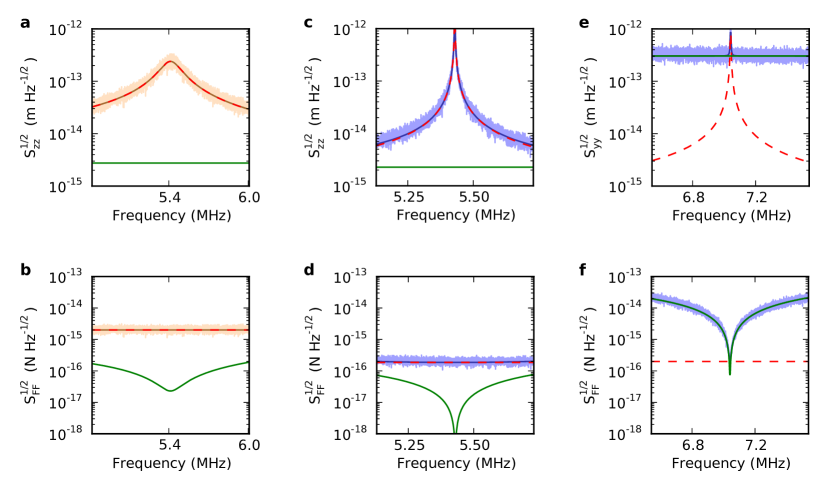
By analyzing the power spectral density [17] of laser transmission through the tapered fiber [33] coupled to the microdisk, mechanical motion of the cantilevers can be observed. For each device we were able to identify peaks in the voltage spectral density corresponding to thermodynamic actuation of the fundamental in-plane and out-of-plane modes, while the second out-of-plane mode (figure 1(f)) was additionally visible for the 8 long cantilever (figure 3(e), (f)). Mode identity was verified by directional piezo actuation and comparison to FEM simulations. The voltage spectral density, , was calibrated thermomechanically to displacement spectral density () of the cantilever’s tip. Displacement noise floors of 2 were observed for the out-of-plane motion of the 4 cantilever, equivalent to the best noise floors observed using traditional AFM detection methods [18, 19], yet for radically smaller, lighter, and higher-frequency cantilevers.
The linear susceptibility, , relates displacements of the cantilever’s tip, , to applied forces, . By dividing the measured displacement spectral density by , the observed force spectral density can be found (figure 3(b), (d), (f), (h)). The thermal forces on the cantilever impose a minimum force sensitivity, and in all cases in which the thermomechanical motion of the cantilever was detected, the force noise reached a minimum at the cantilever resonant frequency equal to the thermal noise, . For both the in-plane and out-of-plane modes of the 8 cantilever, a force sensitivity of was achieved, figure 3(b), (d). This is less than a factor of two higher than a recent hybrid device with a very high mechanical quality factor [34]. While was reached regardless of detector noise, low displacement noise floors broadened the frequency range over which thermally limited force noise was observed. Therefore, small displacement noise floors, achievable with optomechanics, allow for more accurate, larger bandwidth (faster) force measurements. A similar effect could be achieved for optomechanical devices such as these through dissipative feedback with optical cooling [28], broadening the width of the peaks without affecting , and allowing wide bandwidth measurements at the thermal noise level for fast scanning [35].
Operating these devices at low bath temperatures would reduce thermal noise on the cantilevers, and a thermal force noise of 1 at 10 mK is expected to be detectable with the observed noise floors of the 8 cantilever’s out-of-plane motion, making them excellent candidates for low-temperature precision force measurements [36]. Device geometry plays a large part in determining the thermal forces on the cantilevers, and minimizing , where is the full width half max of the spectral peak, will optimize force sensing ability. The extremely low effective masses of these devices, ranging here from 140 to 610 fg (table 1), has enabled delicate force sensing despite the modest quality factors of the cantilevers ( 5000 in vacuum).
When using the cantilevers to detect forces in liquid or air, thermal force noise on the cantilever is drastically increased due to additional damping of the cantilever, lowering the quality factor of the devices (table 1). Higher frequency cantilevers are less affected by viscous dissipation and therefore exhibit better quality factors [37, 38] and force sensitivity. This is the case for our devices, as the smallest cantilevers are dampened the least in air (see table 1, figure 3(g)-(h), and Appendix D).
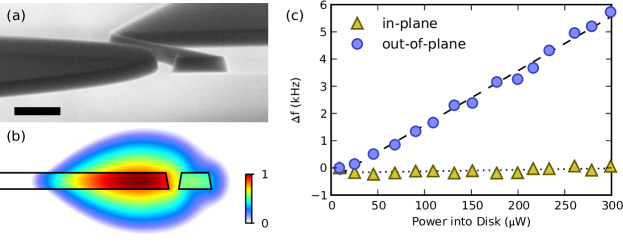
The small displacement noise floors achieved with these devices are a direct result of the efficiency in which displacements of the cantilever are transduced into frequency changes in the optical disk. This efficiency can be described to first order by the optomechanical coupling coefficient, , where is the optical mode resonance frequency. Cantilevers curve with the microdisk to optimize by increasing overlap between the optical whispering gallery modes and the cantilever’s motion (table 1). In all devices, the out-of-plane motion of the cantilever had considerably better optomechanical coupling than the in-plane motion. The apparent symmetry of the out-of-plane motion would suggest a very small linear optomechanical coupling for the out-of-plane mode, however slanted sidewalls of the devices due to fabrication (figure 4(a),(b)), and the placement of the dimpled fiber touching the top of the optical disk introduce sufficient asymmetries to explain the large linear optomechanical coupling observed [20].
Finally, optomechanics provides schemes to introduce feedback and control over AFM cantilevers, such as optomechanical heating and cooling of the mechanical modes, and optical gradient forces. For example, we show in figure 4(c) the optical spring effect can be used to tune the cantilever frequency in situ by controlling the optical gradient force through the laser power used for detection. Such techniques introduce new methods for manipulating optomechanical AFMs for increased functionality.
3 Conclusion
Optomechanical AFM provides the path to ultra-sensitive molecular force probe spectroscopy, HS-AFM, and other AFM applications. We have demonstrated optomechanical detection of sub-picogram effective mass multidimensional AFM cantilevers that are commercially fabricated, with displacement noise floors down to 2 fm, and 130 aN force sensitivity at room temperature. Challenges remain, including selective attachment of relevant molecules, yet we envision that extension of the devices presented here to aqueous environments will open new doors in high-speed, high-resolution molecular force measurements.
Appendix A Thermomechanical Calibration
To calibrate the voltage spectral density, , measured from a photodetector into a displacement spectral density, , of the movement of the cantilever’s tip, the thermal forces on the cantilever can be used. By way of the fluctuation-dissipation theorem, the thermal forces acting on a cantilever’s mode are constant across frequencies with a spectral density of [34, 17]
| (1) |
where is the Boltzmann constant, is the system temperature, is the mode’s resonance frequency, is the quality factor, and is the effective mass of the cantilever (described further below). Using the linear susceptibility of a damped harmonic oscillator,
| (2) |
the theoretical displacement spectral density corresponding to thermomechanical actuation of the cantilever mode is known: . Further, assuming the voltage measured is linearly proportional to cantilever displacement, and the noise from the measurement apparatus is constant across frequencies of interest, a theoretical fit to the voltage spectrum can be found [39],
| (3) |
where is the voltage noise floor density and is a conversion factor between volts and meters, ie. . Substituting in the thermal displacement noise,
| (4) |
Because it is not possible to differentiate both and from the fit, is calculated beforehand from measured cantilever dimensions. By modelling the structural modes of the cantilever using the finite element method (FEM), the mode shape of interest, , which is the mechanical displacement of the mode from it’s undeformed position, , normalized to the maximum displacement, can be determined and the effective mass can be computed by carrying out an integral over the volume of the cantilever [21, 17],
| (5) |
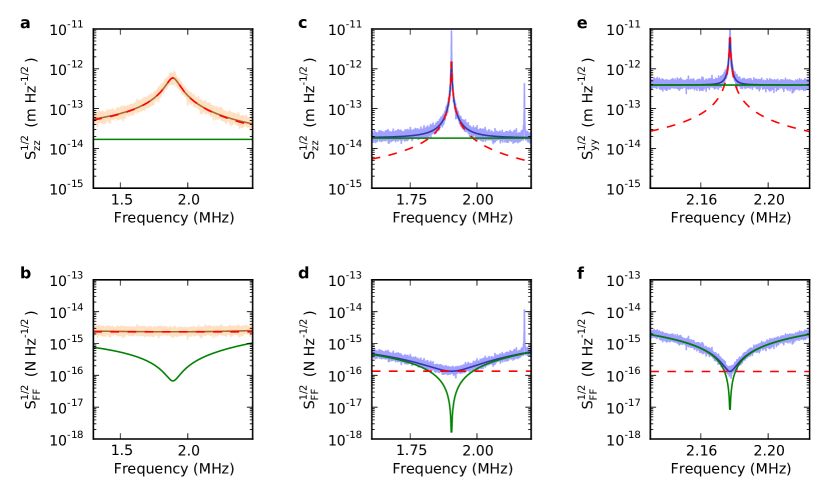
By fitting the measured to (4), the resonance frequency (), quality factor (), noise floor (), and the voltage-displacement conversion factor () used to calibrate the spectrum, can be determined. Calibrated displacement spectral densities and force spectral densities for the cantilevers discussed above are shown in Appendix D.
Appendix B Determining the Optomechanical Coupling Coefficient
By performing thermomechanical calibration, the voltage-displacement conversion factor, , was found. Since linearly converts displacements of the cantilever () to volts from the photodetector (), . Examining the optomechanical detection mechanism, the displacement to voltage transduction can be divided into two steps, displacement to optical cavity frequency () shifts, and to transmission (voltage) transduction. Therefore, with help of the chain rule, ). Here is the optomechanical coupling coefficient, [21, 22]. By calculating the slope of laser transmission vs. laser frequency at the frequency of light the mechanical signal was detected at (e.g. from figure 2(c) in the main text), can be determined, enabling calculation of .
Appendix C Optical Power Calibration
The optical power coupled into the microdisk was estimated by splitting off a small portion (10%) of the light before the vacuum chamber and sending it to a power meter (Thorlabs PM100D), instead of the wavelength meter (figure 2(a)). Power meter readings were calibrated to photodector voltages in the absence of an optical resonator to compensate for the wavelength-dependent response of the photodetector and intrinsic resonances in the fibers used. The total optical power in the fiber was then calculated by monitoring the power at the small split-off as the attenuation was modified using the variable attenuator. The net power dropped into the disk was found by comparing the transmission through the dimpled fiber before and after coupling to the optomechanical devices.
Appendix D Additional Data

References
References
- [1] Binnig G, Quate C F and Gerber C 1986 Atomic force microscope Phys. Rev. Lett. 56 930-933
- [2] Giessibl F J 1995 atomic resolution of the silicon (111)-(7x7) surface by atomic force microscopy Science 267 68-71
- [3] Gross L, Mohn F, Moll N, Liljeroth P and Meyer G 2009 The chemical structure of a molecule resolved by atomic force microscopy Science 325 1110-1114
- [4] Fukuma T, Kobayashi K, Matsushige K and Yamada H 2005 True molecular resolution in liquid by frequency-modulation atomic force microscopy App. Phys. Lett. 86 193108
- [5] Sharma S, Zhu H, Grintsevich E E, Reisler E and Gimzewski J K 2013 Correlative nanoscale imaging of actin filaments and their complexes Nanoscale DOI: 10.1039/c3nr01039b
- [6] Müller D J and Dufrane Y F 2008 Atomic force microscopy as a multifunctional molecular toolbox in nanobiotechnology Nature Nanotech. 3 261-269
- [7] Viani M B, Pietrasanta L I, Thompson J B, Chand A, Gebeshuber I C, Kindt J H, Richter M, Hansma H G and Hansma P K 2000 Probing protein-protein interactions in real time Nature Struct. Biol. 7 644-647
- [8] Rief M, Gautel M, Oesterhelt F, Fernandez J M and Gaub H E 1997 Reversible unfolding of individual titin immunoglobulin domains by AFM Science 276 1109-1112
- [9] Brockwell D J, Paci E, Zinober R C, Beddard G S, Olmsted P D, Smith D A, Perham R N and Radford S E 2003 Pulling geometry defines the mechanical resistance of a beta-sheet protein Nature Struct. Biol. 10 731-737
- [10] Ekinci K L and Roukes M L 2005 Nanoelectromechanical systems Rev. Sci. Instrum. 76 061101
- [11] Ando T 2012 High-speed atomic force microscopy coming of age Nanotechnology 23 062001
- [12] Ando T, Kodera N, Takai E, Maruyama D, Saito K, Toda A 2001 A high-speed atomic force microscope for studying biological macromolecules Proc. Natl. Acad. Sci. 98 12468-12472
- [13] Uchihashi T, Iino R, Ando T and Noji H 2011 High-speed atomic force microscopy reveals rotary catalysis of rotorless F1-ATPase Science 333 755-758
- [14] Casuso I, Sens P, Rico F and Scheuring S 2010 Experimental evidence for membrane-mediated protein-protein interaction Biophys. J. 99 L47-L49
- [15] Endo M, Hidaka K, KatoT, Namba K and Sugiyama H 2009 DNA Prism structures constructed by folding of multiple rectangular arms J. Am. Chem. Soc. 131 15570-15571
- [16] Albrecht T R, Grütter P, Horne D and Rugar D 1991 Frequency modulation detection using high-Q cantilevers for enhanced force microscope sensitivity J. App. Phys. 69 668-673
- [17] Hauer B D, Doolin C, Beach K S D and Davis J P 2013 A universal method of thermal calibration for nano/micro-mechanical resonators arXiv:1305.0557
- [18] Fukuma T 2009 Wideband low-noise optical beam deflection sensor with photothermal excitation for liquid-environment atomic force microscopy Rev. Sci. Instrum. 80 023707
- [19] Rasool H I, Wilkinson P R, Stieg A Z and Gimzewski J K 2010 A low noise all-fiber interferometer for high resolution frequency modulated atomic force microscopy imaging in liquids Rev. Sci. Instrum. 81 023703
- [20] Kim P H, Doolin C, Hauer B D, MacDonald A J R, Freeman M R, Barclay P E and Davis J P 2013 Nanoscale torsional optomechanics Appl. Phys. Lett. 102 053102
- [21] Eichenfield M, Camacho R, Chan J, Vahala K J and Painter O 2009 A picogram- and nanometre-scale photonic-crystal optomechanical cavity Nature 459 550-555
- [22] Anetsberger G, Arcizet O, Unterreithmeier Q P, Rivière Q P, Schliesser A, Weig E M, Kotthaus J P and Kippenberg T J 2009 Near-field cavity optomechanics with nanomechanical oscillators Nature Phys. 5 909-914
- [23] Sankey J C, Yang C, Zwickl B M, Jayich A M and Harris J G E 2010 Strong and tunable nonlinear optomechanical coupling in a low-loss system Nature Phys. 6 707-712
- [24] Bagheri M, Poot M, Li M, Pernice W P H and Tang H X 2011 Dynamic manipulation of nanomechanical resonators in the high-amplitude regime and non-volatile mechanical memory operation Nature Nanotech. 6 726-732
- [25] Barton R A, Storch I R, Adiga V P, Sakakibara R, Cipriany B R, Ilic B, Wang S P, Ong P, McEuen P L, Parpia J M and Craighead H G 2012 Photothermal self-oscillation and laser cooling of graphene optomechanical systems Nano Lett. 12 4681-4686
- [26] Sauer V T K, Diao Z, Freeman M R and Hiebert W K 2012 Nanophotonic detection of side-coupled nanomechanical cantilevers Appl. Phys. Lett. 100 261102
- [27] Anetsberger G, Gavartin E, Arcizet O, Unterreithmeier Q P, Weig E M, Gorodetsky M L, Kotthaus J P and Kippenberg T J 2010 Measuring nanomechanical motion with an imprecision below the standard quantum limit Phys. Rev. A 82 061804
- [28] Safavi-Naeini A H, Chan J, Hill J T, Alegre T P M, Krause A and Painter O 2012 Observation of quantum motion of a nanomechanical resonator Phys. Rev. Lett. 108 033602
- [29] Li M, Pernice W H P and Tang H X 2010 Ultrahigh-frequency nano-optomechanical resonators in slot waveguide ring cavities Appl. Pys. Lett. 97 183110
- [30] Srinivasan K, Miao H, Rakher M T, Davanço M, Aksyuk V 2011 Optomechanical transduction of an integrated silicon cantilever probe using a microdisk resonator Nano Lett. 11 791-797
- [31] Liu Y, Miao H, Aksyuk V and Srinivasan K 2012 Wide cantilever stiffness range cavity optomechanical sensors for atomic force microscopy Optics Express 20 18268-18280
- [32] Li H, Chen Y, Noh J, Tadesse S and Li M 2012 Multichannel cavity optomechanics for all-optical amplification of radio frequency signals Nat. Commun. 3 1091
- [33] Michael C P, Borselli M, Johnson T J, Chrystal C and Painter O 2007 An optical fiber-taper probe for wafer-scale microphotonic device characterization Optics Express 15 4745-4752
- [34] Gavartin E, Verlot P and Kippenberg T J 2012 A hybrid on-chip optomechanical transducer for ultrasensitive force measurements Nature Nanotech. 7 509-514
- [35] Mertz and J, Marti O and Mlynek J 1993 Regulation of a microcantilever response by force feedback Appl. Phys. Lett. 62 2344-2346
- [36] Geraci A G, Smullin S J, Weld D M, Chiaverini J and Kapitulnik A 2008 Improved constraints on non-Newtonian forces at 10 microns Phys. Rev. D 78 022002
- [37] Li M, Tang H X and Roukes M L 2007 Ultra-sensitive NEMS-based cantilevers for sensing, scanned probe and very high-frequency applications Nature Nanotech. 2 114-120
- [38] Sun X, Zhang X and Tang H X 2012 High-Q silicon optomechanical microdisk resonators at gigahertz frequencies Appl. Phys. Lett. 100 173116
- [39] Bunch J S, Zande, A M, Verbridge S S, Frank I W, Tanenbaum D M, Parpia J M, Craighead H G and McEuen P L 2007 Electromechanical Resonators from Graphene Sheets Science 315, 490-493