Measurement of identified charged hadron spectra with the ALICE experiment at the LHC
Abstract
The ALICE experiment features multiple particle identification systems. The measurement of the identified charged hadron spectra in proton-proton collisions at GeV will be discussed. In the central rapidity region () particle identification and tracking are performed using the Inner Tracking System (ITS), which is the closest detector to the beam axis, the Time Projection Chamber (TPC) and a dedicated time-of-flight system (TOF). Particles are mainly identified using the energy loss signal in the ITS and TPC. In addition, the information from TOF is used to identify hadrons at higher momenta. Finally, the kink topology of the weak decay of charged kaons provides an alternative method to extract the transverse momentum spectra of charged kaons. This combination allows to track and identify charged hadrons in the transverse momentum () range from 100 MeV/c up to 2.5 GeV/. Mesons containing strange quarks (K, ) and both singly and doubly strange baryons (, , and + ) are identified by their decay topology inside the TPC detector. Results obtained with the various identification tools above described and a comparison with theoretical models and previously published data will be presented.
1 Introduction
The transverse momentum spectra and yields of identified particles at mid-rapidity from the first pp collisions are presented. Data are collected in the autumn of 2009, during the commissioning of the LHC, at = 900 GeV. The evolution of particle production in pp collisions with collision energy is studied by comparing data from previous experiments.
The , , K+, K-, p, and distributions, identified via several independent techniques utilizing specific energy loss, d/d, information from the Inner Tracking System (ITS) and the Time Projection Chamber (TPC), velocity measurements in the Time-Of-Flight array (TOF) are reported. The combination of these methods provides particle identification over the transverse momentum range 0.1 GeV/c 2.5 GeV/c. Charged kaons, identified via kink topology of their weak decays in the TPC, provide a complementary measurement over a similar range. All reported particle yields are for primary particles, namely those directly produced in the collision including the products of strong and electromagnetic decays but excluding weak decays of strange particles.
2 Experimental setup and data analysis
2.1 The ALICE detector
The ALICE detector and its performance are described in detail in [1]. For the analyses described the following detectors are used: the ITS, the TPC and the TOF detector. These detectors are positioned in a solenoidal magnetic field of = 0.5 T and have a common pseudo-rapidity coverage of . Two forward scintillator hodoscopes (VZERO) are used for triggering purposes. They are placed on either side of the interaction region, covering regions and .
-
•
The Inner Tracking System - The ITS is the closest of the central barrel detectors to the beam axis. It is composed of six cylindrical layers of silicon detectors. The two innermost layers are equipped with pixel detectors (SPD), followed by two layers of drift detectors (SDD) and two layers of double-sided silicon strip detectors (SSD). The innermost layer is at 3.9 cm from the beam axis, while the outer layer is at 43.0 cm. The four layers equipped with SDD and SSD also provide a measurement of the specific energy loss d/d. The ITS is also used as a standalone tracker to reconstruct charged particles with momenta below 200 MeV/ that are deflected or decay before reaching the TPC, and to recover tracks crossing dead regions of the TPC.
-
•
The Time Projection Chamber - The TPC is the main tracking device. It is a large volume, high granularity, cylindrical detector with an outer radius of 2.78 m and a length of 5.1 m. The active volume extends from 0.85 m to 2.47 m in radius. It covers 2 in azimuth and in polar angle for the full radial track length. Accepting one third of the full radial track length extends the range to 1.5. The 90 m3 drift volume is filled with a Ne (85.7%), CO2 (9.5%), and N2 (4.8%) gas mixture. A high voltage central membrane splits the drift region in two halves, resulting in a maximal drift time of 94 s. The TPC has a good particle identification capability thanks to the measurement of energy loss of particles in the gas mixture.
-
•
The Time-Of-Flight Detector - The TOF detector consists of 18 azimuthal sectors, each containing 91 Multi-gap Resistive Plate Chambers (MRPCs) distributed in five gas-tight modules. It is positioned at 370-399 cm from the beam axis. The region at is not covered in order to minimize the material in front of the Photon Spectrometer, which is not used in this analysis. The MRPC detectors are installed with a projective geometry along the beam direction, minimizing the variation of the flight path of particles across the sensitive area of the detector. Each MRPC is segmented into 96 read-out pads (2.5 3.5 size).
2.2 Event selection and normalization
The data presented were collected during the commissioning of the LHC at CERN in the autumn of 2009, with pp collisions at GeV. The collider was run with four bunches per beam, resulting in two bunch crossings per beam circulation period (89 s) at the ALICE interaction point. The remaining two bunches per beam were not collided at ALICE, and served to estimate the contribution of beam-gas interactions. The average event rate was a few Hz, so the fraction of pile-up events was negligible.
3 , , K+, K-, p, and identification in ALICE
The d/d and TOF signals are used for particle identification as a function of the momentum , whereas the final spectra are given as a function of the transverse momentum .
In the case of the TPC and ITS analyses, particles were identified via the specific energy loss d/d. Unique identification on a track-by-track basis is possible in regions of momentum where the bands are clearly separated from each other. In overlapping areas, particle identification is still possible on a statistical basis using fits to the energy loss distribution in each -bin. The fits are performed on the distribution of the difference between the measured and the expected energy deposition for tracks within the selected rapidity range 0.5. The calculated expected energy loss depends on the measured track momentum and the assumed mass for the particle. The procedure is therefore repeated three times for the entire set of tracks, assuming the pion, kaon, and proton mass.
In the TPC analysis, the difference [d/d][d/d is used. For the ITS the difference of the logarithm of the measured and calculated energy deposit d/dd/d(, is taken to suppress the non-Gaussian tails originating from the smaller number of d/d measurements.
In the case of the TOF, the identification is based on the time-of-flight information. The procedure for the extraction of the raw yields differs slightly from the one used for TPC and ITS.
3.1 Particle identification in the ITS
In both the ITS standalone (track reconstruction only using the ITS) and in the ITS-TPC (reconstruction is performed using both the ITS and the TPC) analyses, the d/d measurement from the SDD and the SSD is used to identify particles. The standalone tracking result extends the momentum range to lower than can be measured in the TPC, while the combined tracking provides a better momentum resolution.
For each track, d/d is calculated using a truncated mean: the average of the lowest two points in case four points are measured, or a weighted sum of the lowest (weight 1) and the second lowest point (weight 1/2), in case only three points are measured.
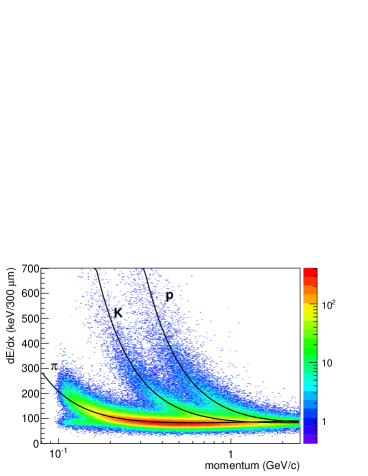
Figure 1 shows the truncated mean d/d for the sample of ITS standalone tracks along with the PHOBOS parametrization of the most probable value [2].
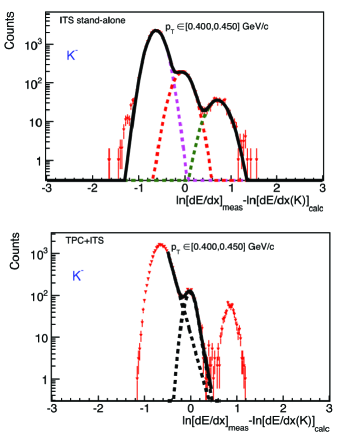
For the ITS standalone track sample, the histograms are fitted with three Gaussians and the integral of the Gaussian centered at zero is used as the raw yield of the corresponding hadron species.
For the ITS-TPC combined track sample, a non-Gaussian tail is visible. This tail is a remnant of the tail of the Landau distribution for energy loss. It was verified using simulations that the shape and size of the tail are compatible with the expectations for a truncated mean using two out of four samples.
Examples of d/d distributions are shown in Fig. 2 for negative tracks using the kaon mass hypothesis in a given interval ( 400-450 MeV/) for both ITS standalone tracks (upper panel) and ITS-TPC combined tracks (lower panel).
Efficiency correction
The raw hadron yields extracted from the fits to the d/d distributions are corrected for the reconstruction efficiency determined from Monte Carlo simulations, applying the same analysis criteria to the simulated events as to the data. Secondary particles from interactions in the detector material and strange particle decays have been subtracted from the yield of both simulated and real data. The fraction of secondaries after applying the track impact-parameter cut depends on the hadron species and amounts to 1-3% for pions and 5-10% for protons depending on . The secondary-to-primary ratio has been estimated by fitting the measured track impact-parameter distributions with three components, prompt particles, secondaries from strange particle decays and secondaries produced in the detector material for each hadron species. Alternatively, the contamination from secondaries have been determined using Monte Carlo samples, after rescaling the yield to the measured values [3]. The difference between these two procedures is about 3% for protons and is negligible for other particles.
3.2 Particle identification in the TPC
Particle identification is based on the specific energy deposit of each particle in the drift gas of the TPC (up to 159 independent measurements for tracks crossing the whole TPC volume), shown in Fig. 3 as a function of momentum for positive and negative charges. The solid curves show the calibration curves obtained by fitting the ALEPH parametrization of the Bethe-Bloch curve [4] to the data points in regions of clear separation.
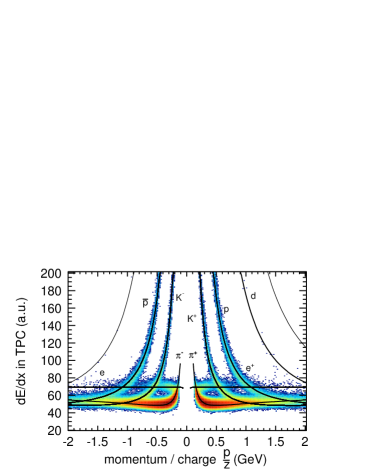
As in the case of the ITS, a truncated-mean procedure is used to determine d/d (60% of the points are kept). This reduces the Landau tail of the d/d distribution to the extent that it is very close to a Gaussian distribution.
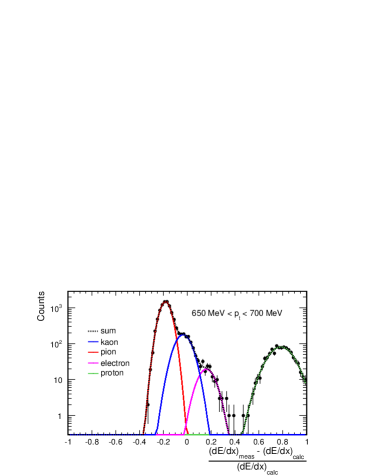
One example of the d/d distribution in a specific bin in the kaon mass hypothesis is shown in Fig. 4. The peak centered at zero refers to kaons and the other peaks are from other particle species. As the background in all momentum bins is negligible, the integrals of the Gaussian give the raw yields.
Efficiency correction
The raw hadron spectra are corrected for the reconstruction efficiency, determined by doing the same analysis on MonteCarlo events. The efficiency is calculated by comparing the number of reconstructed particles to the number of charged primary particles from PYTHIA in the chosen rapidity range. The range with a reconstruction efficiency lower than 60% (for pions and protons) is omitted for the analysis corresponding to a low- cut-off of 200 MeV/ for pions, 250 MeV/ for kaons, and 400 MeV/ for protons.
Protons are corrected for the contamination of secondaries from material and of feed down from weak decays. The feed down was determined by two independent methods as described in 3.1.
3.3 Particle Identification with the Time Of Flight detector
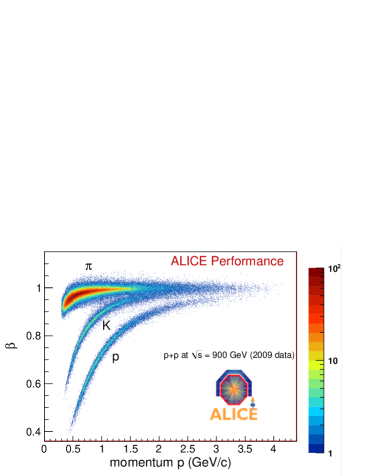
Particles reaching the TOF system are identified by measuring simultaneously their momentum and velocity. The flight path of the track is defined as the distance along the track trajectory between the point of its closest approach to the event vertex and the TOF sensitive surface. The time of flight is calculated for different mass hypotheses by summing up, at each tracking step, the time-of-flight increments , with being the local value of the track momentum, and the track-length increment along its trajectory.
From the reconstructed flight path and the measured time of flight , the velocity is obtained (as displayed in Fig. 5) as a function of the momentum at the vertex. Clearly visible are the bands corresponding to charged pions, kaons and protons. The width of the bands reflects the observed overall time-of-flight resolution of about 180 ps, which has contributions from the TOF time resolution, the accuracy of the reconstructed flight path and the uncertainty on the event start time, .
The yields of , K and p are obtained from the simultaneous fit of the distribution of the time difference between measured and the average between the calculated time averaging for pions and kaons
| (1) |
The choice of this variable is motivated by the observation that the identification procedure is optimized when pions and kaons have a symmetric treatment. Moreover, extracting the yield for different species in a simultaneous fit guarantees that the resulting number of pions, kaons and protons matches the total number of tracks in the given momentum bin.
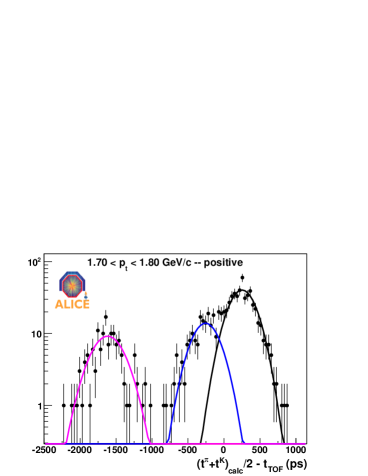
The distribution of the variable is reported in Fig. 6 for positive particles in a given transverse momentum bin. The distribution shows a Gaussian behavior for each particle species and the lines indicate the result of a three-Gaussian fit used to extract the raw yields.
Efficiency Correction
As the track selection used in the TOF analysis is the same as the one described in the TPC analysis (subsection 3.2), the same tracking corrections are applied. In the case of TOF analysis, an additional correction is needed in order to take into account that only a fraction of the particles reconstructed by the TPC are associated to a signal in TOF. This matching efficiency includes all sources of track losses in the propagation from the TPC to the TOF (geometry, decays and interactions with the material) and its matching with a TOF signal (the TOF intrinsic detector efficiency, the effect of dead channels and the efficiency of the track-TOF signal matching procedure).
4 Particle identification in ALICE via topological criteria
4.1 Kaon Identification using their decay in the TPC
Charged kaons can also be identified by their weak decay (kink topology) inside the TPC detector. These tracks are rejected in the previously described TPC analysis. The decay channels with the highest branching ratio (B.R.) for kaons are the two-body decays
-
(1)
, (B.R. 63.55%)
-
(2)
, (B.R. 20.66%).
Three-body decays with one charged daughter track (B.R. 9.87%) as well as three-body decays into three charged pions (B.R. 5.6%) are also detected.
The identification of kaons from kink topology and its separation from pion decay is based on the decay kinematics. The transverse momentum of the daughter with respect to the mother’s direction, , has an upper limit of 236 MeV/ for kaons and 30 MeV/ for pions for the two-body decay to . The corresponding upper limit for the two-body decay (2) is 205 MeV/. All three limits can be seen as the edges of the peaks in Fig. 7, which shows the distribution of all measured kinks inside the selected volume and rapidity range 0.7. Selecting kinks with MeV/ removes the majority of -decays as shown by the dashed (before) and solid (after) histograms.
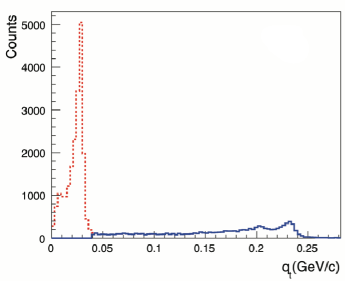
The invariant mass for the decay into is calculated from the measured difference between the mother and daughter momentum, their decay angle, assuming zero mass for the neutrino.
4.2 Topological reconstruction of K, ,
The measurement of K, and is based on the reconstruction of the secondary vertex (V0) associated to their weak decay. The V0 finding procedure starts with the selection of secondary tracks, i.e. tracks having a sufficiently large impact parameter with respect to the primary vertex. All possible combinations between two secondary tracks of opposite charge are then examined. They are accepted as V0 candidates only if the DCA between them is smaller than 0.5 cm. The minimization of the distance between the tracks is performed numerically using helix parameterizations in 3D. The V0 vertex position is a point on the line connecting the points of closest approach between the two tracks. Its distance from each daughter track is taken to be proportional to the precision of the track parameter estimations. Once their position is determined, only the V0 candidates located inside a given fiducial volume are accepted.
4.3 Topological reconstruction of and
The and particles are identified via their “cascade” decay topology. The cascade finding procedure starts from the V0 finding procedure for the () daughter but with less stringent selection criteria. This is done to increase the efficiency and to allow for the fact that the daughter ’s do not have to point back to the primary vertex.
The V0 candidates found within the mass window () are combined with all possible secondary tracks (bachelor candidates) with the exception of both V0 daughter tracks. A cut on the impact parameter of the bachelor track is applied to reject the primary particles which increase the combinatorial background.
A V0-bachelor association is performed if the distance of closest approach between the bachelor track and the V0 trajectory (DCA between V0 and bachelor track) is small (less than ). Finally, this cascade candidate is selected if its reconstructed momentum points back to the primary vertex (cosine of cascade pointing angle). The cascade finding is limited to the fiducial region used for V0 reconstruction).
4.4 Reconstruction of
The resonance is reconstructed through its principal decay channel . With a of 45 fm, its decay vertex is indistinguishable from the primary collision vertex. Therefore the selection criteria adopted for the candidate daughter tracks are the ones used for primaries.
A crucial issue for the reconstruction, as for any strongly decaying resonance, is the combinatorial background determination. In the present analysis PID is used to select kaons, rejecting most of the background while leading to a very small loss in efficiency. For this purpose, tracks are selected if the PID information from the TPC is compatible with a kaon signal and using the TOF signal when available.
4.5 Efficiency corrections
The efficiency corrections are obtained by analyzing Monte Carlo (MC) events in exactly the same way as for the real events. Little dependence is found on the several MC generators which are used. Therefore the corrections presented here are obtained using the event generator PYTHIA 6.4 (tune D6T) [5] and GEANT3 [6] for particle transport through the ALICE detectors.
5 Results
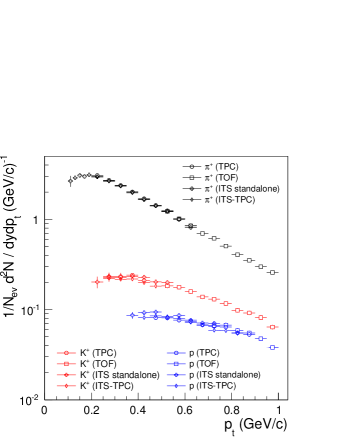
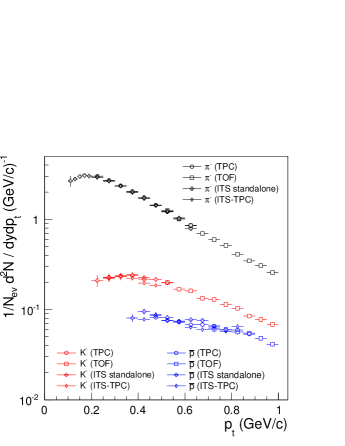
Spectra from ITS standalone, ITS-TPC, TPC and TOF analyses are reported in Figure 8. The analyses from the different detectors use a slightly different sample of tracks and have largely independent systematics (mainly coming from the PID method and the contamination from secondaries). The spectra have been averaged, using the systematic errors as weights. From this weighted average, the combined, -dependent, systematic error is derived. The combined spectra have an additional overall normalization error, coming primarily from the uncertainty on the material budget (3%) and from the normalization procedure (2%). Combined spectra are reported in Figure 9.
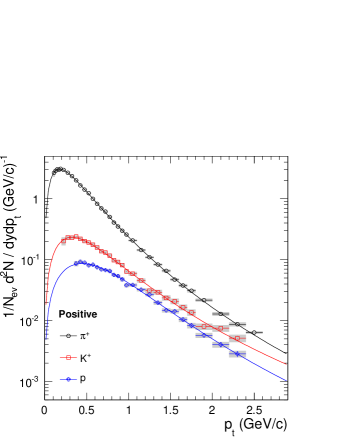
The combined spectra shown in Fig. 9 are fitted with the Lévy (or Tsallis) function (see e.g. [7])
| (2) |
with the fit parameters , and the yield . This function gives a good description of the spectra and has been used to extract the total yields and the .

The spectra for K, , , and + are shown in Fig. 10 along with the Lévy fits. When comparing the different spectra, it is found that the inverse slope parameter increases with the mass of the particle. For example, it changes from MeV for K to MeV for when the Lévy fit is used. The and apparently do not follow this trend. However, this is most likely because the very limited statistics do not allow for a well-constrained fit.
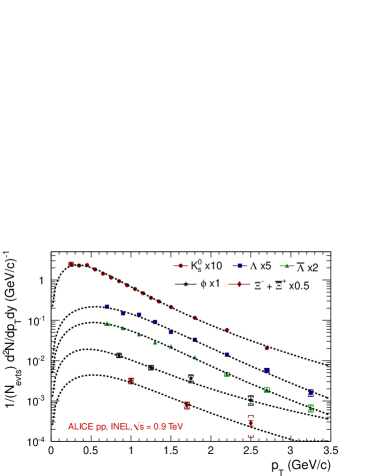
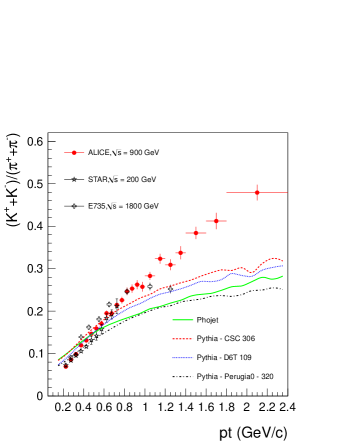
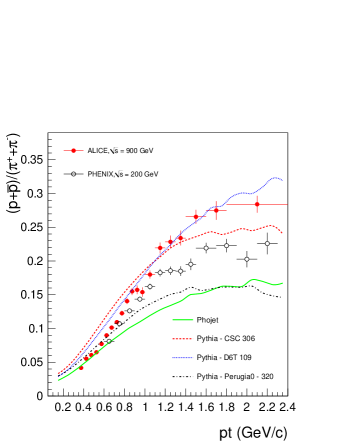
Figure 12 shows the -dependence of the (K++ K-)/(+ ) ratio and also the measurements by the E735 [11] and STAR Collaborations [9]. It can be seen that the observed increase of K/ with does not depend strongly on collision energy.
A comparison with event generators shows that at 1.2 GeV/c, the measured K/ ratio is larger than any of the model predictions.
In Figure 12, the measured (p + ) / (+ ) ratio is compared to results at = 200 GeV from the PHENIX Collaboration [12]. Both measurements are feed-down corrected. At low , there is no energy-dependence of the p ratio visible, while at higher GeV/c, the p/ ratio is larger at = 900 GeV than at = 200 GeV energy.
Event generators seem to separate into two groups, one with high p/ ratio (PYTHIA CSC and D6T), which agree better with the data and one group with a lower p/ ratio (PHOJET and PYTHIA Perugia0), which are clearly below the measured values. These comparisons can be used for future tunes of the event generators.
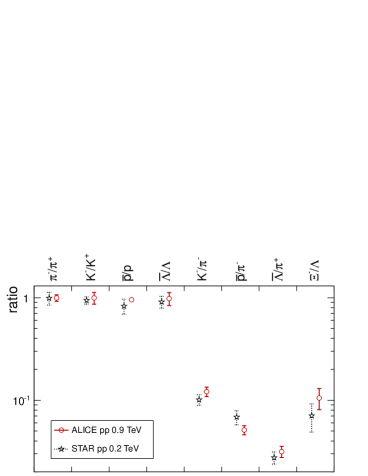
Using the particle integrated yields, a comparison with STAR feed-down corrected particle ratios at = 0.2 TeV [13] is shown in Fig. 13. With the centre of mass energy increasing from = 0.2 TeV to 0.9 TeV the measured ratios are similar except the ratio which decreases slightly from to . The strange to non-strange particle ratios seem to increase but stay compatible within uncertainties: the from to and the from to .
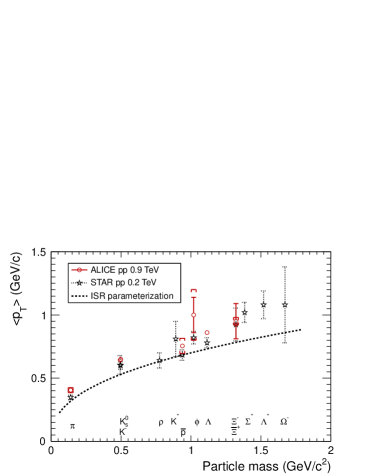
The yields and obtained with the ALICE experiment are compared for each particle with existing data at the same energy and also with results at lower and higher energies. The various experiments differ in acceptance and event selection (i.e. NSD or INEL) but the dependence of with respect to these variables is found to be negligible. Consequently the values are directly comparable, whereas the comparison of the yields can require further scaling because of different (pseudo)rapidity coverages. Figure 14 reports measurements along with those of the STAR experiment [13, 16]. It is remarkable that the remains close to the ISR parameterization [17] although the collision energy increased by a factor .
6 Conclusions
The first analysis of transverse momentum spectra of identified hadrons, , , K+, K-, p, , K, , , , and in pp collisions at = 900 GeV with the ALICE detector is presented. Various particle identification techniques have been used and this allows us to cover a broad momentum range. Agreement in the K/ ratio is seen when comparing to p collisions at the Tevatron and SpS. Comparing our results with similar measurement from the STAR Collaboration using pp collisions at = 200 GeV the shape of the spectra shows an increase of the hard component, but we observe only a slight increase of the mean- values.
The integrated yields and average transverse momenta of mesons containing strange quarks (K and ) and hyperons (, and ) have been compared with earlier data collected in pp and p interactions at various energies. These results provide a useful baseline for comparisons with recent tunes of the PYTHIA model and a reference for future measurements in heavy-ion collisions at the LHC.
These studies demonstrate the precision with which ALICE can measure charged hadrons, resonances and topologically reconstructed weakly decaying particles. Measurements of these particles is a substantial part of the ALICE program in both pp and PbPb collisions.
References
References
- [1] ALICE Collaboration, K. Aamodt et al., JINST 3 64, (2008) S08002.
- [2] PHOBOS collaboration, Back, B. B. et al., Phys. Rev. C 75, (2007) 024910.
- [3] ALICE Collaboration, K. Aamodt et al., Eur. Phys. J. C 71, (2011) 1594.
- [4] W. Blum and L. Rolandi, Particle Detection with Drift Chambers, Springer, Berlin, 1998.
- [5] T. Sjöstrand, S. Mrenna and P. Z. Skands, J. High Energy Phys. 0605 (2006) 026.
- [6] R. Brun et al., 1985 ”GEANT3 User Guide”, CERN Data Handling Division DD/EE/841; R. Brun et al., 1994 ”CERN Program Library Long Write- up, W5013, GEANT Detector Description and Simulation Tool”.
- [7] C. Tsallis and Constantino, J. Stat. Phys. 52 (1988) 479-487.
- [8] PHENIX Collaboration, Adare A. et al., Phys.Rev.D 83 (2011) 052004.
- [9] STAR Collaboration, B. I. Abelev et al., Phys. Rev. C 79 (2009) 034909.
- [10] UA5 Collaboration, Ansorge, R. E. et al., Phys. Lett. B 199 (1987) 311-316.
- [11] E735 Collaboration, T. Alexopoulos et al., Phys. Rev. D 48 (1993) 984-997.
- [12] PHENIX Collaboration, Adler, Stephen Scott et al., Phys. Rev. C 74 (2006) 024904.
- [13] STAR Collaboration, B. I. Abelev et al., Phys. Rev. C 75, (2007) 064901.
- [14] ALICE Collaboration, K. Aamodt et al., Phys. Rev. Lett. 105, (2010) 072002.
- [15] ALICE Collaboration, K. Aamodt et al., “Production of pions, kaons and protons in pp collision at = 900 with ALICE at the LHC”, accepted by Eur. Phys. J. C.
- [16] STAR Collaboration, J. Adams et al., Phys. Rev. Lett. 97, (2006) 132301.
- [17] M. Bourquin and J. M. Gaillard, Nucl. Phys. B 114, (1976) 334.