Detection of the microwave spin pumping using the inverse spin Hall effect
Abstract
We report on the electrical detection of the dynamical part of the spin pumping current emitted during ferromagnetic resonance (FMR) using the inverse Spin Hall Effect (ISHE). The experiment is performed on a YIGPt bilayer. The choice of YIG, a magnetic insulator, ensures that no charge current flows between the two layers and only the pure spin current produced by the magnetization dynamics is transferred into the adjacent strong spin-orbit Pt layer via spin pumping. To avoid measuring the parasitic eddy currents induced at the frequency of the microwave source, a resonance at half the frequency is induced using parametric excitation in the parallel geometry. Triggering this nonlinear effect allows to directly detect on a spectrum analyzer the microwave component of the ISHE voltage. Signals as large as 30 V are measured for precession angles of a couple of degrees. This direct detection provides a novel efficient means to study magnetization dynamics on a very wide frequency range with great sensitivity.
One great expectation of spintronics regarding information technology is the promise that pure spin currents can be generated and manipulated without their charge current counterparts jungwirth12 . Pure spin currents correspond to the transport of angular momentum in a very wide range of materials including metals and insulators with or without magnetic order. In ferromagnetic metals, charge currents are intrinsically associated to spin currents because electrons at the Fermi level are spin polarized. Using these as injection electrodes, pure spin currents can be generated into a non magnetic metal in a non-local geometry where charges are evacuated through one electrode whereas spin diffusion can be collected by another nearby electrode valenzuela06 ; kimura07 . This lateral geometry is well suited to nanostructures, but it is limited by the required current densities and the short spin diffusion lengths otani08 . Another option relies on using the spin Hall effect, a phenomenon based on the spin-orbit interaction of a charge current which generates a transverse spin current in a conductor dyakonov71 ; hirsch99 . Pure spin currents can also be generated in ferromagnetic insulators by the spin pumping mechanism tserkovnyak05 ; woltersdorf05 ; heinrich11 during magnetization precession. This effect is produced by the damping of spin-waves which transfer angular momentum across an interface to a neighbouring layer. The emitted pure spin current can be detected electronically in an adjacent layer by the inverse spin Hall effect (ISHE) using metals with strong spin-orbit coupling like Pt saitoh06 ; ando08 ; Ando et al. (2009); mosendz10 ; mosendz10a . The novelty here offered by electrical detection of the spin pumping using the ISHE is that it can be used also on non-metallic ferromagnets, including Yttrium Iron Garnet (YIG) kajiwara10 ; heinrich11 ; wang11 ; sandweg11 ; kurebayashi11 ; vilela-leao11 ; chumak12 ; Castel et al. (2012); Hahn et al. (2013), a magnetic insulator which has unsurpassed small damping in ferromagnetic resonance (FMR). But so far, only the dc component of the ISHE voltage induced by FMR has been measured, which is a second order effect in the precession angle. Here, we report on a direct measurement of its first order ac counterpart.
The experiments of the present study are performed at room temperature on a YIGPt bi-layer where the YIG is a 200 nm thick epitaxial film grown by liquid phase epitaxy. A 6 nm thick Pt layer is then sputtered on top and two contact electrodes are defined at each end. The sample is mounted on a stripline antenna generating a microwave field oscillating at a frequency as sketched in Fig.1. At resonance of the uniform mode, the YIG emits, perpendicularly to the YIGPt interface, a flow of angular momentum generated by the spin pumping effect,
| (1) |
In this expression, is the magnetization vector, whose norm is , is the reduced Planck constant, the electron charge, and the spin mixing conductance at the YIGPt interface in units of m-2. The spin current pumped into the adjacent Pt is then converted into a charge current by ISHE,
| (2) |
where is the spin Hall angle in Pt and is the unit vector perpendicular to the interface (see Fig.1).
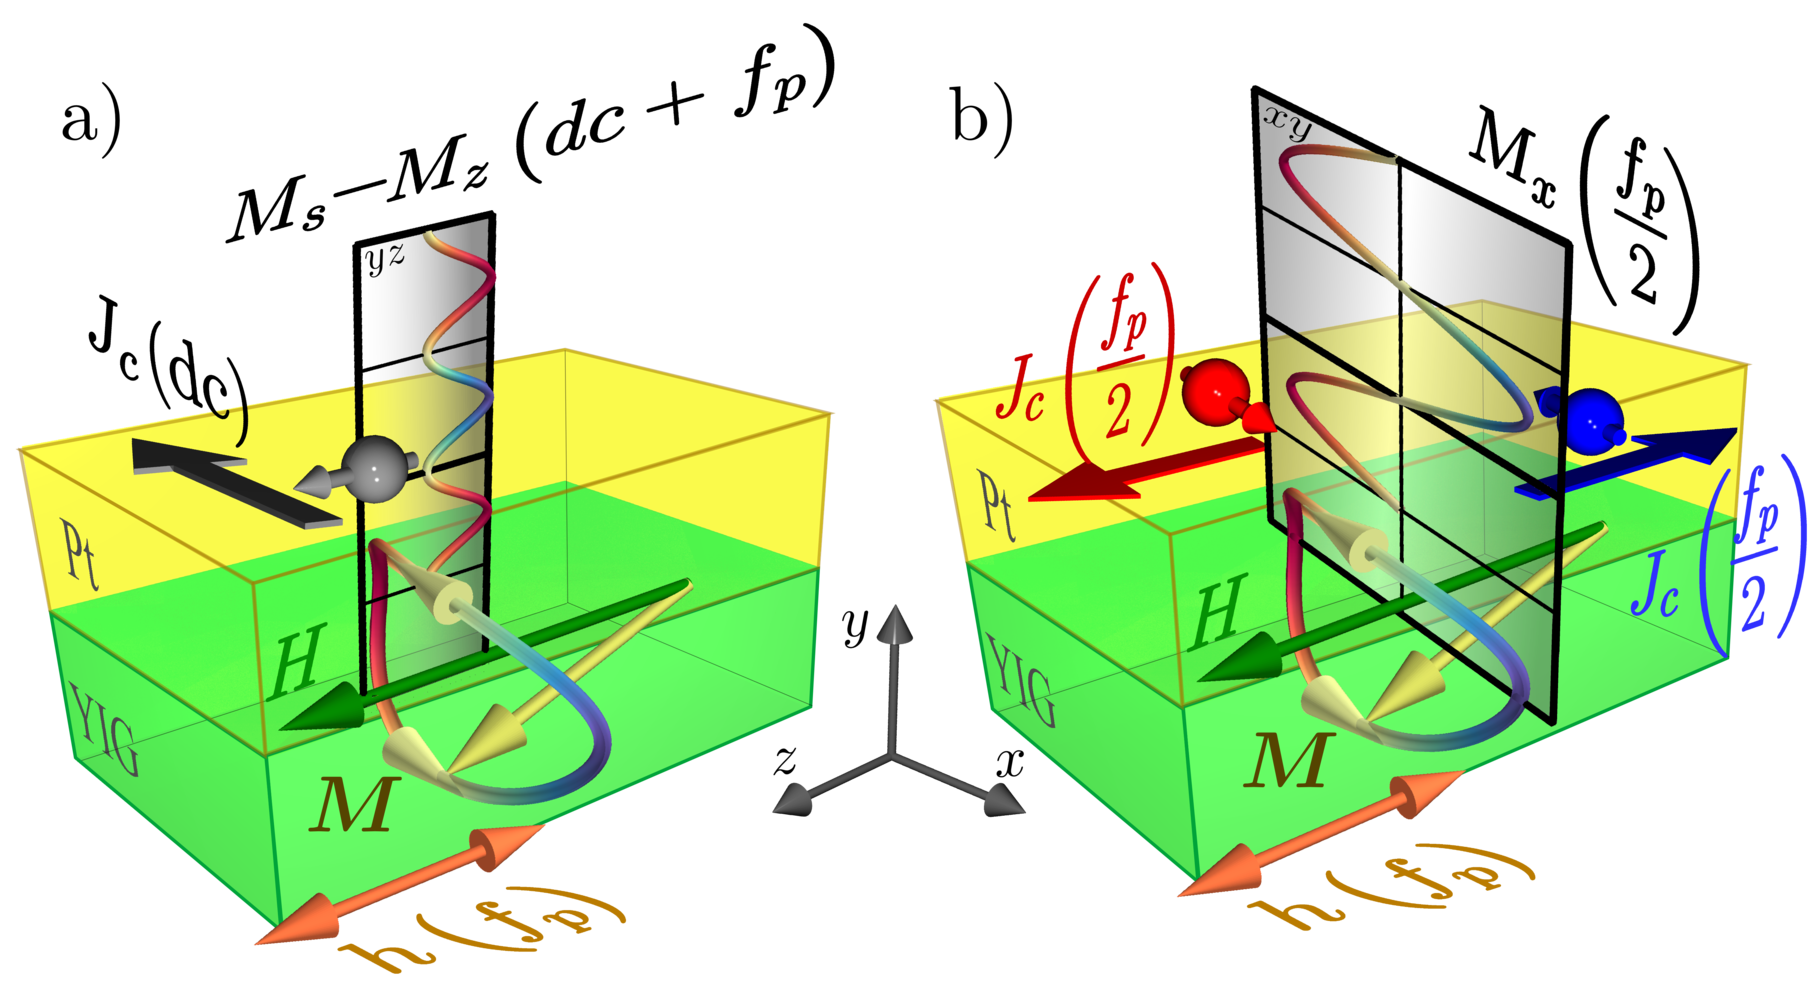
Importantly, the flow (and hence ) has both dc and ac components jiao13 . The dc part of this signal is normally detected as a voltage, proportional to , that is maximum in a transverse geometry (i.e. , see Fig.1a). In contrast, is maximum in a parallel geometry (i.e. , see Fig.1b). It is interesting to note that for circular precession the dc signal is second order in the precession angle (, maximal for ), while its ac counterpart is first order ( and maximal for ). Thus the ratio of ac to dc scales as , which is large for small precession angles. However, the ac component is much harder to detect as it oscillates obviously at the same frequency as that of the microwave generator producing the FMR. This microwave excitation field induces eddy currents in any closed circuit containing the sample. These spurious ac currents are generally rather large and dominate any other contribution at the same frequency. Therefore, a clear detection of the ac spin currents has not yet been successful as one has to carefully eliminate the large amplitude eddy currents. In this letter, we report on the unambiguous detection of these ac spin currents emitted at ferromagnetic resonance using a specially designed system leading to an ac signal totally unpolluted by any other contribution. The key strategy here is to generate the FMR at half the frequency of the excitation source. This phenomenon is known as parametric excitation sparks64 . It exploits the fact that due to the ellipticity of the in-plane precession, the magnetization follows a clamshell trajectory. During a full revolution of around its precession axis , the -component of the magnetization oscillates twice faster, see Fig.1a. This is also illustrated in Fig.1b using red and blue colors to code its -component, . Therefore, by exciting parallel to , one can trigger the precession at half the source frequency. One should note however that this parallel parametric excitation is only possible in systems with low damping, since the excitation power needs to exceed a minimum threshold corresponding to a fraction of linewidth (typically below one Oersted for YIG sparks64 ) in order to drive the magnetization into oscillation.
Experimentally, since the technique depends sensitively on the respective orientations of the microwave excitation and the bias field, we shall measure the ratio of the dc and ac components of , by rotating , the static bias magnetic field, in the film plane. For all practical purposes, the YIG slab can be considered as an infinite film, whose resonance conditions are independent of the orientation of .
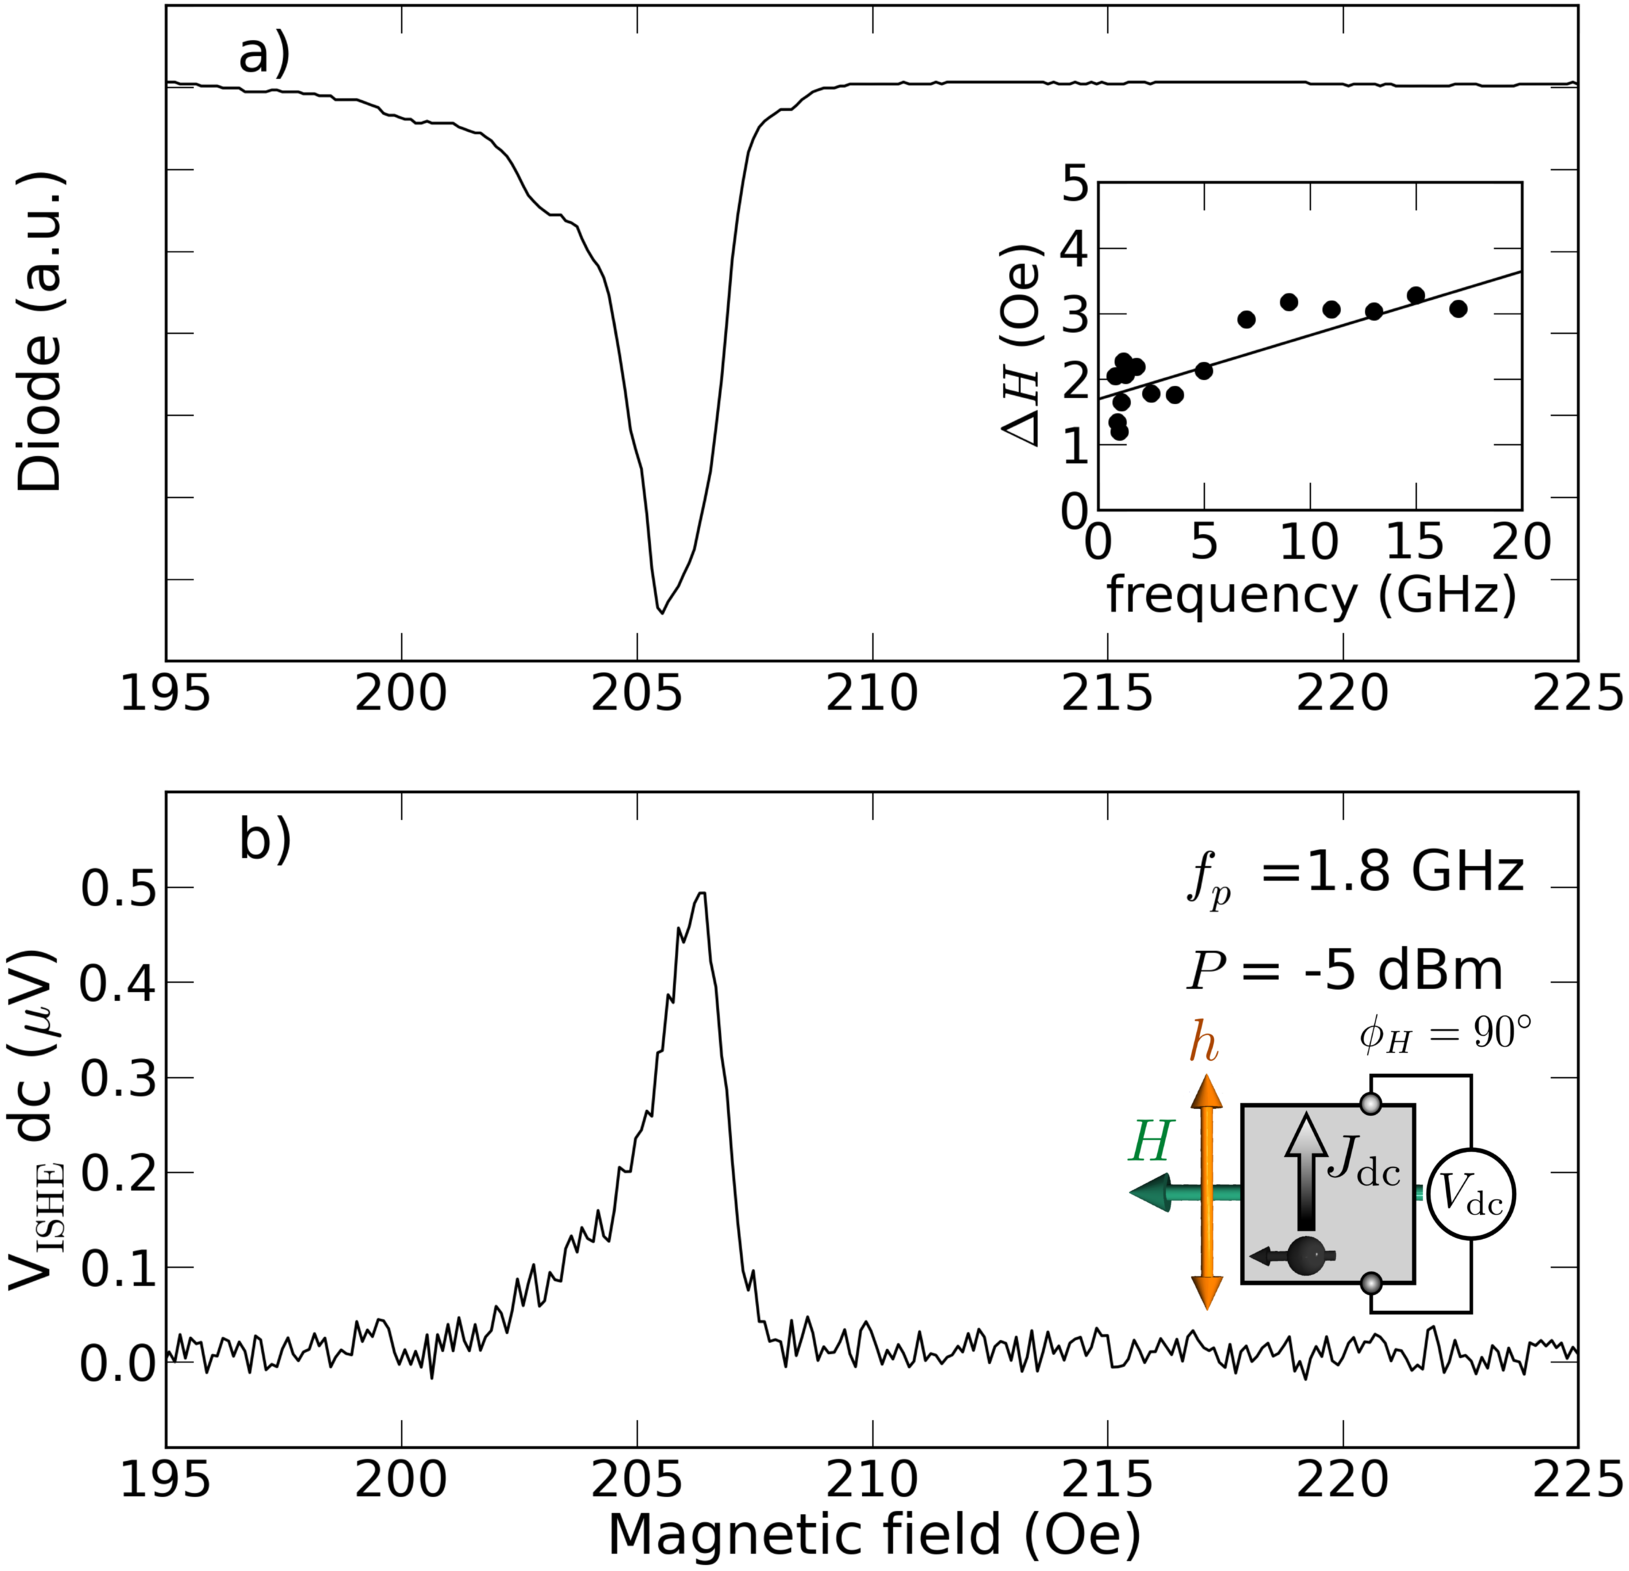
In order to characterize our sample, and in particular the electrical conversion of the pumped spin current at the YIGPt interface, we first perform standard FMR resonance, where the small microwave field is perpendicular to (). It is indeed the most efficient configuration to excite the magnetization dynamics: in the case displayed in Fig.2, the angle of precession induced in YIG at resonance by a microwave field mOe ( dBm) is (see Supplementary Materials). The FMR signal is detected simultaneously by probing the power transmitted through the microwave line using a diode (Fig.2a) and by measuring the dc ISHE voltage transversally to the static magnetization (Fig.2b). Both measurements yield the same evolution of the resonance field versus frequency following the Kittel law for an in-plane magnetized thin film, see Fig.3a. By measuring the diode signal at low power ( dBm, corresponding to mOe), one can also determine in the linear regime the dependence of the linewidth on frequency, which is reported in the inset of Fig.2a. A linear fit yields the Gilbert damping, , highlighting the very small magnetic relaxation of our YIG film Hahn et al. (2013). The inhomogeneous part to the linewidth, Oe, reflects sample imperfections specific to the growth process of this batch. We find that this contribution dominates the broadening below 10 GHz. The amplitude of measured at resonance allows us to determine the transport parameters at play in the electrical conversion of the pumped spin current (see Supplementary Materials). We find that our dc ISHE data can be well explained using typical parameters of the YIGPt system Castel et al. (2012); Hahn et al. (2013): spin diffusion length nm, spin Hall angle , and spin mixing conductance m-2.
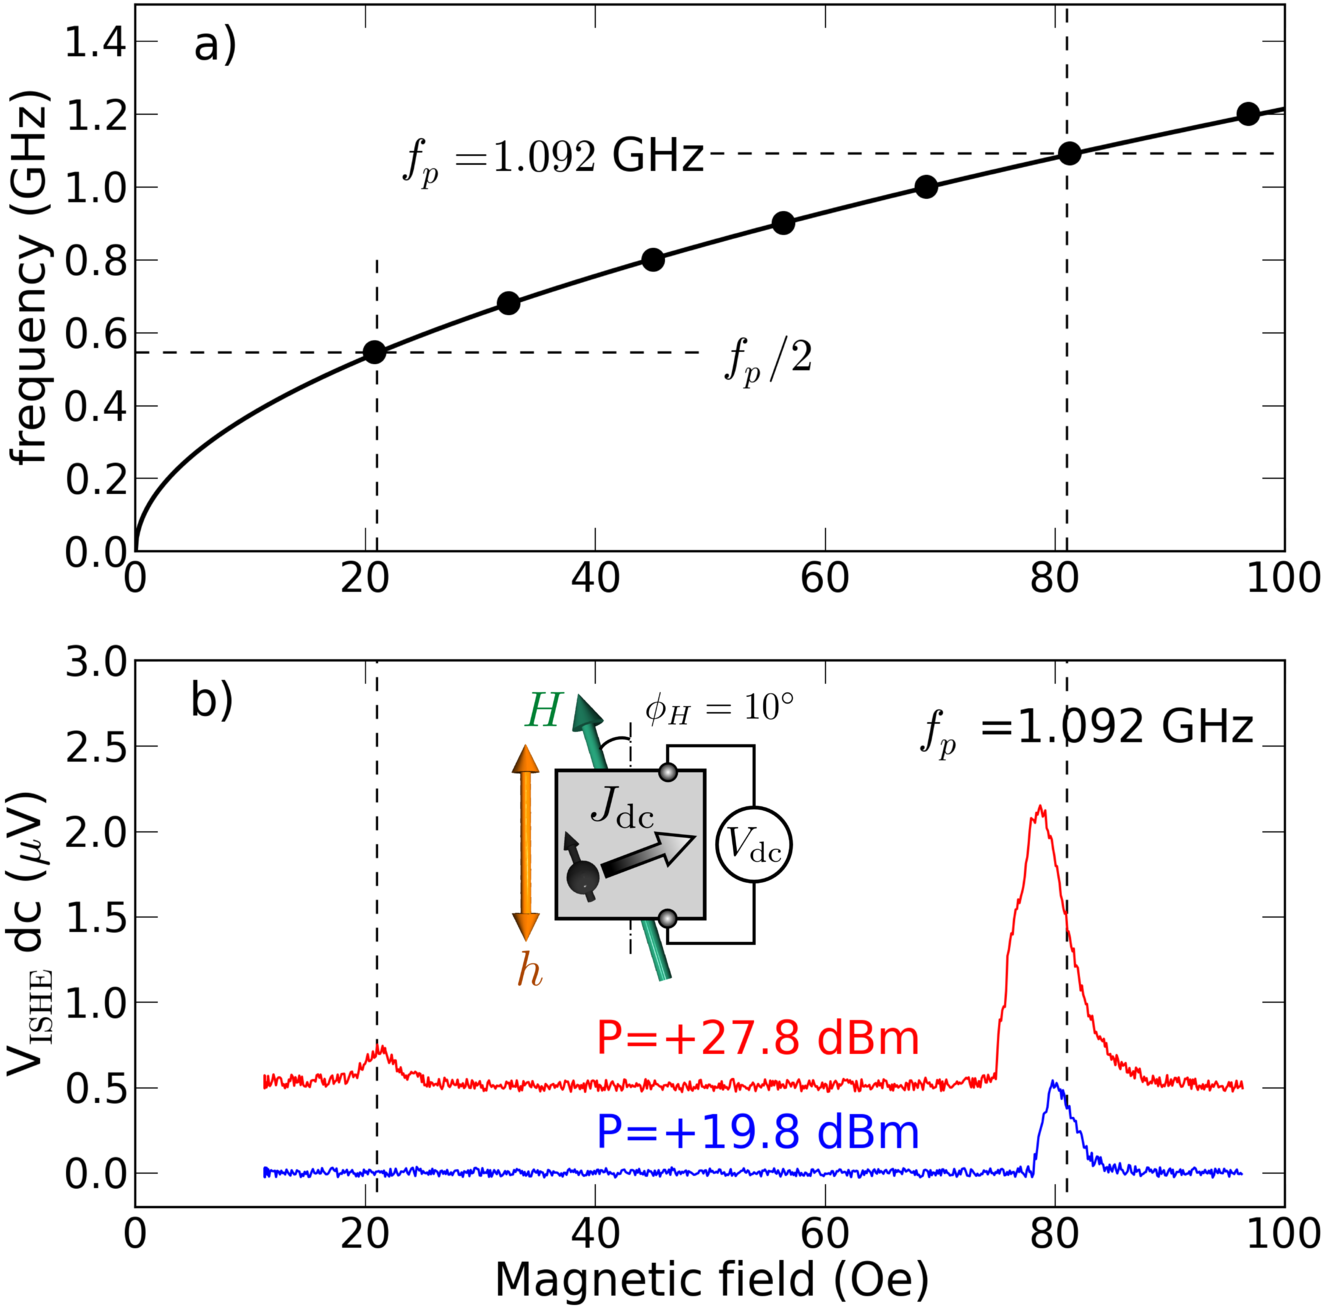
We now wish to excite parametrically the YIG magnetization at half the applied microwave frequency, , by taking advantage of the clamshell shape of the precession trajectory, which is sketched in Fig.1. For this, the component of the microwave field parallel to the bias field should reach the excitation threshold for parallel parametric excitation sparks64 . To demonstrate this effect in our sample through dc ISHE voltage measurements, we set a finite angle between and (see inset of Fig.3b). Compared to the previous perpendicular geometry, the resonance condition at has not changed, only the microwave field is less efficient to bring the magnetization out-of-equilibrium, thus a stronger excitation power should be used to reach the same precession angle. We move momentarily to lower frequency in order to insert in the microwave circuit an additional amplifier limited in bandwidth to 1.1 GHz (see Supplementary Materials). At GHz and dBm we observe only one resonance peak at Oe in Fig.3b. The new feature here is that if we increase the power to dBm, a second peak appears in the spectrum at Oe. Looking at the Kittel law of Fig.3a), we find that it corresponds to the uniform mode resonating at , which is thus parametrically excited sandweg11 ; kurebayashi11 ; kurebayashi11a ; ando12 . Thanks to the quantitative analysis of using the transport parameters determined previously, it is possible to quantify the angle of precession corresponding to this parametric excitation: (see Supplementary Materials).
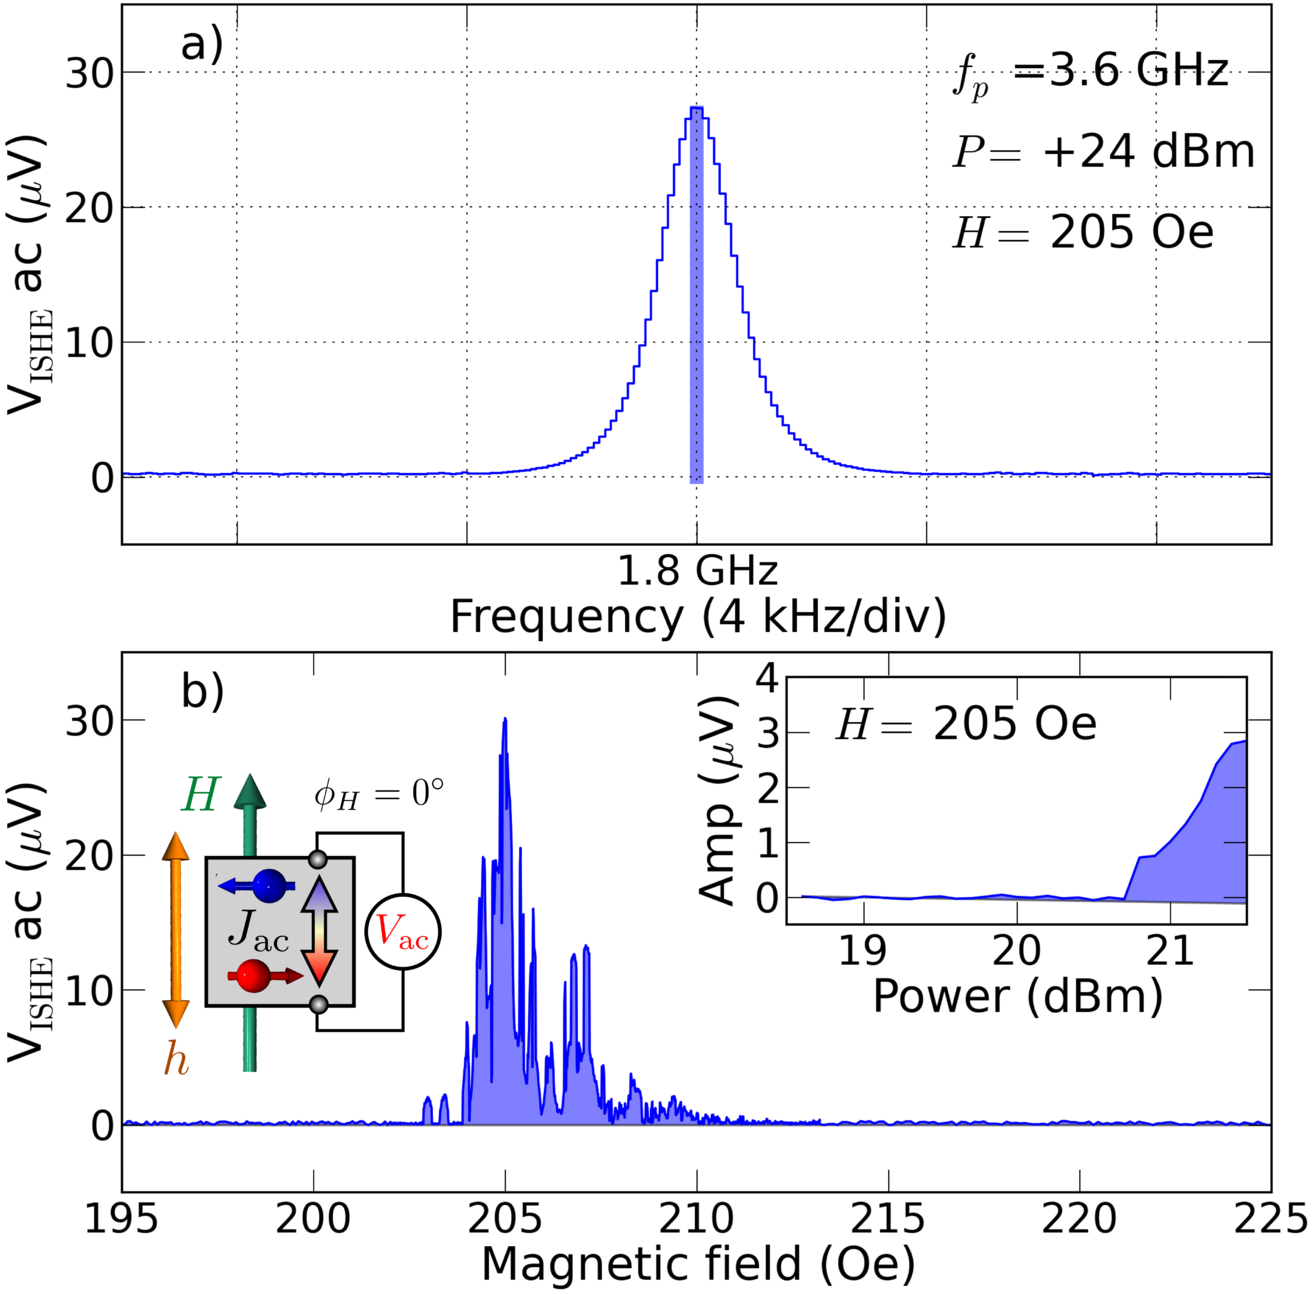
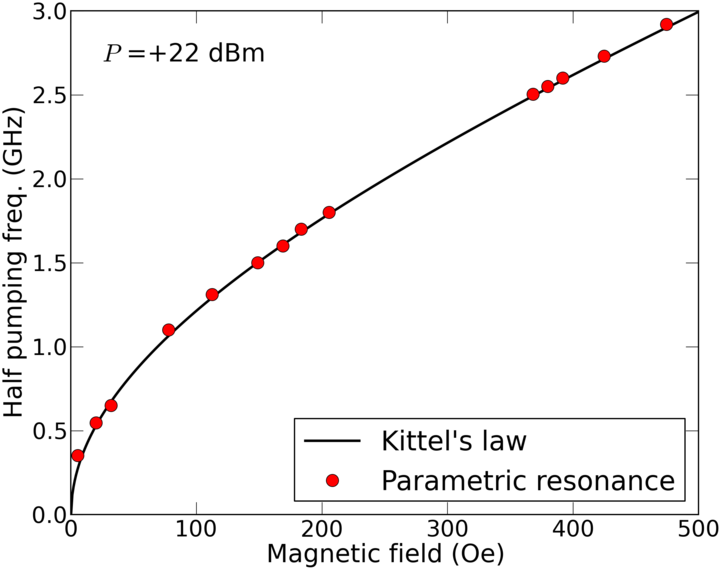
The next step is to directly detect the ac ISHE voltage generated at by the parametrically excited magnetization dynamics. For this, we now align the microwave field with the bias field () and excite the system at GHz and high power, dBm. The two voltage leads which contact the Pt layer are connected directly into a spectrum analyzer (SA) without any preamplification scheme. By sweeping the frequency of the SA at fixed Oe, we detect a large signal of amplitude V at exactly GHz, as can be seen in Fig.4a. We claim this signal to be the ac component of the pure spin current pumped from the YIG parametric excitation into Pt, and converted into a voltage by ISHE. To prove this, we plot in Fig.4b the amplitude of the SA signal measured at as a function of . We find that the amplitude of the signal is maximum at G, which is the resonance field determined by standard FMR at 1.8 GHz in Fig.2, and dies out in a range of about Oe around this field. We have also checked that this ac voltage signal has a parametric excitation origin, by studying its amplitude as a function of the excitation power. One can observe in the inset of Fig.4b that the peak at suddenly appears on the SA above a critical power dBm, i.e., a critical microwave field Oe, in good agreement with the expected threshold for parallel parametric excitation in YIG sparks64 . We note that the envelope of the parametric excitation signal observed in Fig.4b as a function of has a shape close to that of the standard FMR peak of Fig.2. Still, we observe abrupt jumps of the amplitude as is varied. We find that the details of this variation are very sensitive to changes in the orientation of the bias field. We attribute this to the excitation of spin-wave modes which are almost degenerate with the uniform precession mode sparks64 ; naletov07 . We have repeated the same experiment for different excitation frequencies ranging from 0.8 GHz up to 6 GHz. Because the microwave power exceeds the threshold for parallel parametric excitation ( dBm), an ac ISHE voltage at half the excitation frequency is observed on the SA as a function of when the condition for resonance is met at (cf. Kittel law on Fig.5). Lastly, in order to check experimentally that our method eliminates all spurious signals, we performed the same series of measurements on a reference sample where the Pt layer was replaced by 15 nm of Al. We found experimentally that no electrical signal is produced at , which allows to conclude that the layer with strong-spin orbit scattering like Pt is indispensable to observe the ac ISHE voltage.
To gain more insight into the ac ISHE voltage, we would like to comment on its amplitude. For that, we compare the ac and dc components using the configuration (see Fig.3b). We measure an effective dc voltage V, while in the same conditions, the generated ac voltage is V (see Supplementary Materials). Thus, we obtain the experimental ratio . We have determined that the angle of precession corresponding to the parametric excitation observed at Oe is . Therefore, one would expect that , where is the ellipticity correction factor for this case (see Supplementary Materials), in excellent agreement with our estimation above.
In conclusion, we have shown that the microwave part of the spin pumping current emitted by a ferromagnet driven at resonance can be detected by the inverse spin Hall effect using an adjacent metallic layer with strong spin-orbit scattering 111During this work, we became aware of a parallel effort reporting also detection of ac-ISHE but in NiFePt: http://arxiv.org/abs/1307.2961. On our millimeter size YIGPt sample it leads to a micro-Volt range microwave signal measurable directly on a spectrum analyzer without any pre-amplification or impedance matching. We believe that this broad band direct detection provides a novel efficient means to study magnetization dynamics in a wide variety of ferromagnetic materials. Further analysis of the measured spectra in the parallel parametric geometry will provide new insights into the spin-wave competition in the nonlinear regime. The phenomenon will also allow dynamical studies of the process of spin transfer at the interface with strong spin orbit non-magnetic metals jia11 ; liu12 ; miron11 .
This research was supported by the French ANR Grant Trinidad (ASTRID 2012 program) and by the RTRA-2011 grant Spinoscopy.
Appendix A Supplementary Materials: Sample preparation and characterization
The 200 nm thick single crystal Y3Fe5O12 (YIG) film was grown by liquid phase epitaxy on a (111) Gd3Ga5O12 (GGG) substrate. A 6 nm thin Pt layer with conductivity m-1 was then sputtered on top. Vibrating sample magnetometry reveals that the YIG film does not exhibit any in-plane anisotropy and has both very low coercivity (0.5 Oe) and saturation field (2 Oe). Its saturation magnetization, emucm-3, is the one of bulk YIG. This value was confirmed by in-plane broadband FMR (from 0.4 GHz up to 17 GHz). FMR also allows to extract the gyromagnetic ratio, radsOe-1.
Appendix B Experimental setup
Experiments are performed at room temperature. The microwave cell is placed at the center of an electromagnet which can be rotated. The 500 m wide, 2 m thick Au transmission line cell is connected to a synthesizer providing frequencies up to 20 GHz and power up to dBm (additional boost to dBm is obtained by using an external amplifier for frequencies lower than 1.1 GHz). A standard diode provides a quadratic detection of the transmitted power. The calibration of the linearly polarized in-plane microwave field yields mOe when the output power is 0 dBm. The YIGPt sample is cut into a slab with lateral dimensions of 1.7 mm 7 mm and placed on top of the transmission line. The sample is mounted upside-down on the stripline with the Pt layer facing the Au antenna. The two voltage leads are equidistant from the area of excitation and separated by 3 mm (the two-point resistance is ). is measured by a lock-in technique with the microwave power turned on and off at a frequency of 1.9 kHz. is directly measured using a spectrum analyzer (input impedance ). Due to impedance mismatch, the voltage transmission coefficient from the YIGPt sample to the spectrum analyzer is . We have checked that this value holds below 2 GHz using a network analyzer.
Appendix C Analysis of the dc ISHE voltage
The amplitude of the ISHE dc voltage generated in Pt by the magnetization precession with an angle at frequency in YIG is given by Castel et al. (2012); Hahn et al. (2013):
| (3) |
In this expression, is the spin mixing conductance, the conductivity of the Pt layer, its spin Hall angle, its spin diffusion length, its thickness, and the length of the sample excited by the excitation field. is a factor close to unity, which depends on the ellipticity of the precession trajectory, hence on the frequency Ando et al. (2009): in our case, at 0.546 GHz and at 1.8 GHz.
The dc ISHE voltage is maximal when the angle between the direction along which the voltage drop is measured and the static magnetization equals 90∘, which is the case in our standard FMR geometry (Fig.2). In this case, we have checked that the dc ISHE voltage is odd in applied magnetic field, which shows that the voltage generated at resonance is not due to a thermoelectrical effect. The measured are in good agreement with Eq.(3), using values estimated from high frequency susceptibility for the precession angle and the following typical transport parameters Hahn et al. (2013): ; nm; m-2. For instance, at GHz and dBm, the angle of precession at resonance is estimated to be , which yields V, to be compared to the value of 0.5 V measured in Fig.2b. The overall agreement between Eq.(3) and the experimental measurements of vs. power (from -20 dBm to +10 dBm) and frequency (from 0.4 to 17 GHz) is within 30%.
When the angle , as in the parametric excitation geometry of Fig.3b, the loss of sensitivity for the dc ISHE voltage drops as . Experimentally, we measure that at dBm, the parametric excitation at GHz generates a dc voltage V (setting leads to a measured dc ISHE voltage of same amplitude but opposite sign). Using the same parameters as for the analysis in the standard FMR configuration, we can estimate the corresponding angle of precession from Eq.(3): .
Appendix D Analysis of the ac ISHE voltage
In order to calculate the ac spin current generated by an elliptical precession trajectory, we follow the analysis performed to derive the factor in Eq.(3) for the dc ISHE voltage Ando et al. (2009). To do so, we use the Landau-Lifschitz-Gilbert equation to compute at resonance the three components of the magnetization precessing around its equilibrium axis and the expression of the pumped spin current flowing accross the FMNM interface (see Eq.(1) of main text).
In the case of a circular precession, this yields and . (In our geometry, does not produce any charge current through ISHE because its spin polarization is parallel to the normal of the FMNM interface, see Eq.(2) and Fig.1 of main text). Hence, , where is the angle of precession.
In the case of an elliptical precession, the same approach yields the correction factors with respect to the circular case:
- •
-
•
for its ac component.
In these expressions, . Hence, the ratio of the ac and dc components writes:
| (4) |
Using the same transport parameters as for the analysis of the dc ISHE voltage, one finds that the precession angle corresponding to the V ac ISHE voltage measured in Fig.4 at GHz equals . In this experiment, , so that the corresponding dc voltage vanishes (see Eq.(3)).
Setting , as in the experiment of Fig.3b, enables to detect both the dc and ac voltages. As explained above, the angle of precession estimated from the dc ISHE voltage at GHz is . It corresponds to an effective dc voltage VV. The ac ISHE voltage measured in the same conditions is found to be V. This value has to be corrected due to the previously mentioned impedance mismatch, VV. Hence, the experimental ratio between the ac and dc components of the ISHE voltage current is , which is in very good agreement with the theoretical value from Eq.(4), .
References
- (1) T. Jungwirth, J. Wunderlich, and K. Olejnik, Nature Materials 11, 382 (2012)
- (2) S. O. Valenzuela and M. Tinkham, Nature (London) 442, 176 (2006)
- (3) T. Kimura, Y. Otani, T. Sato, S. Takahashi, and S. Maekawa, Phys. Rev. Lett. 98, 156601 (2007)
- (4) Y. Otani and T. Kimura, IEEE Trans. Magn. 44, 1911 (20008)
- (5) M. I. Dyakonov and V. I. Perel, JETP Lett. 13, 467 (1971)
- (6) J. E. Hirsch, Phys. Rev. Lett. 83, 1834 (1999)
- (7) Y. Tserkovnyak, A. Brataas, G. E. W. Bauer, and B. I. Halperin, Rev. Mod. Phys. 77, 1375 (2005)
- (8) G. Woltersdorf, M. Buess, B. Heinrich, and C. H. Back, Phys. Rev. Lett. 95, 037401 (2005)
- (9) B. Heinrich, C. Burrowes, E. Montoya, B. Kardasz, E. Girt, Y.-Y. Song, Y. Sun, and M. Wu, Phys. Rev. Lett. 107, 066604 (2011)
- (10) E. Saitoh, M. Ueda, H. Miyajima, and G. Tatara, Appl. Phys. Lett. 88, 182509 (2006)
- (11) K. Ando, Y. Kajiwara, S. Takahashi, S. Maekawa, K. Takemoto, M. Takatsu, and E. Saitoh, Phys. Rev. B 78, 014413 (2008)
- (12) K. Ando, T. Yoshino, and E. Saitoh, Appl. Phys. Lett. 94, 152509 (2009)
- (13) O. Mosendz, J. E. Pearson, F. Y. Fradin, G. E. W. Bauer, S. D. Bader, and A. Hoffmann, Phys. Rev. Lett. 104, 046601 (2010)
- (14) O. Mosendz, V. Vlaminck, J. E. Pearson, F. Y. Fradin, G. E. W. Bauer, S. D. Bader, and A. Hoffmann, Phys. Rev. B 82, 214403 (2010)
- (15) Y. Kajiwara, K. Harii, S. Takahashi, J. Ohe, K. Uchida, M. Mizuguchi, H. Umezawa, H. Kawai, K. Ando, K. Takanashi, S. Maekawa, and E. Saitoh, Nature (London) 464, 262 (2010)
- (16) Z. Wang, Y. Sun, M. Wu, V. Tiberkevich, and A. Slavin, Phys. Rev. Lett. 107, 146602 (2011)
- (17) C. W. Sandweg, Y. Kajiwara, A. V. Chumak, A. A. Serga, V. I. Vasyuchka, M. B. Jungfleisch, E. Saitoh, and B. Hillebrands, Phys. Rev. Lett. 106, 216601 (2011)
- (18) H. Kurebayashi, O. Dzyapko, V. E. Demidov, D. Fang, A. J. Ferguson, and S. O. Demokritov, Nature Mater. (London) 10, 660 (2011)
- (19) L. H. Vilela-Leão, C. Salvador, A. Azevedo, and S. M. Rezende, Appl. Phys. Lett. 99, 102505 (2011)
- (20) A. V. Chumak, A. A. Serga, M. B. Jungfleisch, R. Neb, D. A. Bozhko, V. S. Tiberkevich, and B. Hillebrands, Appl. Phys. Lett. 100, 082405 (2012)
- (21) V. Castel, N. Vlietstra, J. Ben Youssef, and B. J. van Wees, Appl. Phys. Lett. 101, 132414 (2012)
- (22) C. Hahn, G. de Loubens, O. Klein, M. Viret, V. V. Naletov, and J. Ben Youssef, Phys. Rev. B 87, 174417 (2013)
- (23) H. Jiao and G. E. W. Bauer, Phys. Rev. Lett. 110, 217602 (2013)
- (24) M. Sparks, Ferromagnetic relaxation theory (McGraw-Hill, New York, 1964)
- (25) H. Kurebayashi, O. Dzyapko, V. E. Demidov, D. Fang, A. J. Ferguson, and S. O. Demokritov, Appl. Phys. Lett. 99, 162502 (2011)
- (26) K. Ando and E. Saitoh, Phys. Rev. Lett. 109, 026602 (2012)
- (27) V. V. Naletov, G. de Loubens, V. Charbois, O. Klein, V. S. Tiberkevich, and A. N. Slavin, Physical Review B 75, 140405 (Apr. 2007)
- (28) During this work, we became aware of a parallel effort reporting also detection of ac-ISHE but in NiFePt: http://arxiv.org/abs/1307.2961
- (29) X. Jia, K. Liu, K. Xia, and G. E. W. Bauer, Europhys. Lett. 96, 17005 (2011)
- (30) L. Liu, C.-F. Pai, Y. Li, H. W. Tseng, D. C. Ralph, and R. A. Buhrman, Science 336, 555 (2012)
- (31) I. M. Miron, K. Garello, G. Gaudin, P.-J. Zermatten, M. V. Costache, S. Auffret, S. Bandiera, B. Rodmacq, A. Schuhl, and P. Gambardella, Nature 476, 189 (2011)
- Castel et al. (2012) V. Castel, N. Vlietstra, J. Ben Youssef, and B. J. van Wees, Appl. Phys. Lett. 101, 132414 (2012).
- Hahn et al. (2013) C. Hahn, G. de Loubens, O. Klein, M. Viret, V. V. Naletov, and J. Ben Youssef, Phys. Rev. B 87, 174417 (2013).
- Ando et al. (2009) K. Ando, T. Yoshino, and E. Saitoh, Appl. Phys. Lett. 94, 152509 (2009).