Study of the muon content of very high-energy EAS measured with the KASCADE-Grande observatory
Abstract
The KASCADE-Grande detector is an air-shower array devoted to the study of primary cosmic rays with very high-energies (). The instrument is composed of different particle detector systems suitable for the detailed study of the properties of Extensive Air Showers (EAS) developed by cosmic rays in the atmosphere. Among the EAS observables studied with the detector, the charged number of particles, the muon content (at different energy thresholds), and the number of electrons are found. By comparing the measurements of these air-shower parameters with the expectations from MC simulations, different hadronic interaction models can be tested at the high-energy regime with the KASCADE-Grande experiment. In this work, the results of a study on the evolution of the muon content of EAS with zenith angle, performed with the KASCADE-Grande instrument, is presented. Measurements are compared with predictions from MC simulations based on the QGSJET II, QGSJET II-04, SIBYLL 2.1 and EPOS 1.99 hadronic interaction models. A mismatch between experiment and simulations is observed. A similar problem is found for the evolution of the lateral distribution function of muons in the atmosphere.
1 Introduction
At very high-energies, cosmic rays are studied by observing the extensive air showers (EAS) that they produced in the atmosphere upon arrival to the Earth. For this goal, EAS observatories are equipped with several kinds of instruments that are used to study the various components of air showers at different stages. The keys to the knowledge of the properties of primary cosmic rays are to be found in the measured EAS observables. However, the interpretation of this information relies on the understanding of the physics behind the EAS. The production and development of air showers is governed by particle physics, where an important source of uncertainty is the role of hadronic interactions at the very high-energy regime. These have a deep impact on the energy assigment and mass identification of cosmic rays from the measured EAS data (see, for example, [1]).
The lack of accelerator data at very high-energies and the difficulty of solving the QCD equations in a non-perturbative region are the main obstacles to make accurate predictions at the high-energy regime when hadronic interactions are involved. Nowadays, these difficulties are handled by using phenomenological models calibrated at low energies with data from man-made accelerators [2].
At the highest energies, cosmic ray observatories can be used to validate hadronic interaction models by comparing EAS predictions against first-hand data from air-shower detectors, for example, about muons. Muons are produced in the decay of baryons and mesons generated in hadronic collisions during the early stages of the EAS. They are very penetrating particles and, as a consequence, they suffer less attenuation in the atmosphere than the electromagnetic and hadronic components of the shower. Therefore, muons can keep direct information from the properties of the hadronic interactions at very high-energies. In this paper, a preliminary study is performed to test the predictions of the QQGSJET II [3], QGSJET II-04 [4], SIBYLL 2.1 [5] and EPOS 1.99 [6] hadronic interaction models about the muon content of EAS at very high-energies. The research is based on the air-shower data collected with the KASCADE-Grande experiment [7] in the energy interval from to .
2 The KASCADE-Grande observatory
KASCADE-Grande is an air-shower multi-detector observatory dedicated to study cosmic rays with energies [7]. The main part of the experiment is a array of plastic scintillator detectors, called Grande, which is employed to measure the arrival times and the density of charged particles at the shower front. This information is later used to reconstruct the impact point of the EAS core at ground and both the arrival direction and the charged number of particles () of the air shower. Another important component of the observatory is the KASCADE muon array, composed by shielded scintillator detectors. The array has an energy threshold for vertical muons of and measures the muon densities of the EAS at ground level. The total number of muons, , is obtained from these measurements.
3 The data
All air shower simulations were performed with CORSIKA [8] using Fluka [9] to treat hadronic interactions in the low energy regime (). At high energies, the hadronic interaction models QGSJET II, QGSJET II 04, SIBYLL 2.1 and EPOS v1.99, were employed. The response of the detector was simulated with a GEANT 3.21 based code. Sets with energy spectra of the form were produced for a spectral index and afterwards were weighted to have spectra with . Sets for H, He, C, Si and Fe cosmic-ray nuclei were simulated and were combined to reproduce a mixed composition scenario (all single primaries in equal abundances).
Selection cuts were applied to both experimental and simulated data. They were chosen according to MC studies to avoid as much as possible the influence of systematic uncertainties on the reconstruction of EAS parameters. The selected data were composed of events with more than 11 triggered stations in Grande, shower cores inside a central area of , core distance to the KASCADE center between and , and arrival directions confined to the zenith angle interval of . These events were registered during stable periods of data acquisition and passed successfully the standard reconstruction procedure of KASCADE-Grande [7]. Additionally, only showers with were considered for this work. Both the experimental and simulated data were analyzed and reconstructed with the same algorithms. With the above quality cuts, the effective time of observation with KASCADE-Grande was equivalent to 1434 days. The threshold for full efficiency depends slightly on the hadronic model, composition and arrival direction, but in general is completely achieved above .
4 Description of the analysis and results
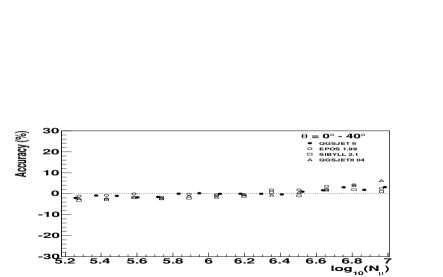
Before starting the analysis, all experimental and simulated muon data was corrected for systematic uncertainties in order to improve their accuracy. That was done using a unique muon correction function derived from MC simulations based on QGSJET II, assuming mixed composition and a spectral index . The employment of a single correction function is justified since it was found that this function is nearly independent from the composition of cosmic rays and from the hadronic interaction model. The function was parametrized with respect to core position, azimuthal and zenithal angles, and muon size. After correction, mean muon systematics become less than for a mixed composition assumption ( and for H and Fe, respectively) and have a mild dependence with the core position and the muon size in the full efficiency regime (see, for example, Fig. 1). This is not a surprise, since selection cuts were carefully selected for this purpose.
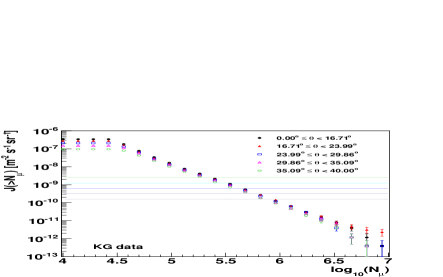
For a first test on the hadronic interaction models with the KASCADE-Grande muon data, predictions on the evolution of the muon content with the arrival zenith angle of the EAS were confronted with observations. The task was done comparing the expected and observed values of the muon attenuation length, . This quantity was extracted by applying the Constant Intensity Cut (CIC) method to the integral muon spectra (see, e.g., Fig. 2) as described in reference [10]. Five CIC cuts were applied, here within the interval , where maximum efficency and statistics are achieved. From these cuts, muon attenuation curves, , are obtained and is extracted from a global fit to such a curves with the formula
| (1) |
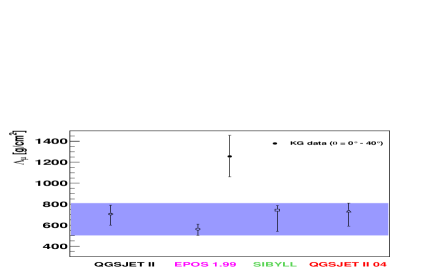
where is the average atmospheric depth for vertical showers and is a normalization parameter to be determined for each attenuation curve. The results for are presented in Table 1 and Fig. 3 along with the corresponding systematics. The quoted values for , in case of MC data, correspond to those data sets with a mixed composition assumption and . However, systematic uncertainties take into account the spreading of the MC value of when the spectral index is modified (considering and ) and the cosmic ray composition is changed. For the latter, the light and heavy composition hypotheses were considered. In case of the QGSJET II model, only protons were used for the light composition assumption, and iron nuclei for the heavy one. However, for the other hadronic interaction models, H and He nuclei, and Fe and Si, were employed with the abovementioned situations, respectively. Systematic errors for MC include also the variation found when the right correction function for the considered model is employed instead of that derived from QGSJET II. This excercise cannot be done with experimental data, since the real correction functions are unknown. Therefore, only the effect of considering different correction functions derived from the hadronic interaction models here employed was computed.
As observed from Table 1 and Fig. 3, the experimental value of is well outside the area spanned by the MC values, even considering the corresponding systematic errors. The smallest difference between the experimental and MC values is found when the observed value is compared with SIBYLL 2.1 () and the biggest one, when using EPOS 1.99 ().
The differences between the measured and predicted are not the result of the application of the muon correction function on the data, since the discrepancies are still present even before using such a correction. Even more, they can be tracked down to the differences in the evolution of the muon densities with the arrival zenith angle, , as it will be shown below.
| QGSJETII | QGSJETII04 | EPOS 1.99 | SIBYLL 2.1 | KG data | |
|---|---|---|---|---|---|
| Systematics () | |||||
| Bin size | |||||
| Global fit | |||||
| Narrower CIC interval | |||||
| Extended CIC interval | |||||
| Muon systematics | |||||
| Statistical fluctuations | |||||
| Core close to KASCADE | |||||
| Core far from KASCADE | |||||
| Broader zenith angle interval | |||||
| Seven CIC cuts | |||||
| Three CIC cuts | |||||
| Muon Correction function uncertainties | |||||
| Composition (Light) | |||||
| Composition (Heavy) | |||||
| Hadronic interaction model | |||||
| Total | |||||
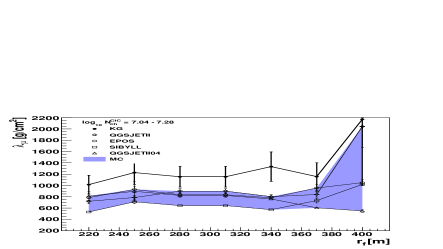
The second test applied to the hadronic interaction models consisted of confronting their predictions for the evolution of the muon density distributions, , at the shower plane, with the angle . The study was focused on the energy range from to , which roughly covers the interval from which was estimated. Since data from different zenith angles is going to be compared, the CIC method was applied again to proceed in a model independent way. However, in this case, it was used on the independent observable, , following [10]. Then, was estimated and employed to correct for attenuation effects in the atmosphere and to calculate the corresponding charged number of particles, , that a given EAS would produced in case of being observed at a reference angle, . This angle corresponds to the mean of the zenith angle distribution of the experimental data. Data was later classified in different intervals. For each of those intervals, the distributions of the five zenith angle intervals involved in this work were calculated. According to the CIC method, this data should show us how the lateral muon density distributions of EAS of a given energy evolve with the atmospheric depth. In figure 4, the distributions for different intervals and the range are presented. According to the QGSJET II model, these events correspond to air showers with energies in the interval from to , assuming a mixed composition and .
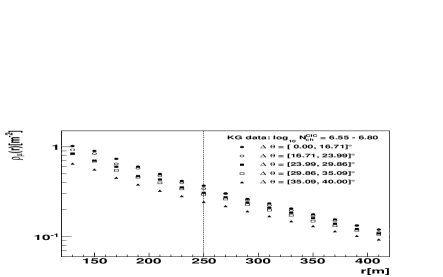
Within each interval, the distributions are used to obtain absorption curves for the muon density at different fixed distances, , as a function of . By fitting the above curves with the equation:
| (2) |
the absorption coefficient, , for the muon density at the shower front is estimated as a function of . Figure 5 shows the results of applying the above analysis to the experimental data of figure 4 along with the expectations from MC models for the same range under a mixed composition assumption. Data are shown for , where statistical fluctuations of MC data are not so big. It is evident from figure 5 that the evolution of experimental data in the atmosphere is different from that predicted by the hadronic interaction models studied in this work (at least for mixed compostion111 In case of QGSJET II more statistics is available, so the excercise can be repeated for pure protons and iron nuclei. The result is that experimental data are still outside the expected values for pure composition assumptions). Even more, by comparing these results with those from other intervals, it is found that the differences between measurements and predictions decrease with the energy of the EAS. The latter effect seems to be more remarkable for particles close to the shower core, where a better agreement with simulations appears. These results have no influence from the muon correction functions, since they were not applied on the muon densities.
Finally, the magnitude of the muon densities were compared with the predictions of the different models. In general, for , previous observations were confirmed that the experimental distributions are well inside the limits predicted by the models for protons and iron nuclei [11].
5 Conclusions
Preliminary analyses performed with the EAS data measured by KASCADE-Grande point out that the observed evolution of the muon content of EAS with the atmospheric depth is not described by the hadronic interaction models QGSJET II, EPOS 1.99, QGSJET II-04 and SIBYLL 2.1. These differences can be tracked down to discrepancies between the experimental and expected evolution of the muon density distributions of EAS in the atmosphere. To corroborate or refute these findings, additional tests will be performed on independent muon data collected by additional detector systems belonging to the experiment, for example, with the Muon Tracking Detector.
Acknowledgment:KASCADE-Grande is supported by the BMBF of Germany, the MIUR and INAF of Italy, the Polish Ministry of Science and Higher Education (in part by grant for 2009-2011) and the Romanian Authority for Scientific Research. J.C.A.V. acknowledges the partial support from CONACYT and the Universidad Michoacana.
References
- [1] W.-D. Apel et al., Astropar. Physics 24 (2005) 1-25
- [2] J. Knapp et al., Astrop. Phys. 19, 77 (2003).
- [3] S.S. Ostapchenko, Nucl. Phys. B (Proc. Suppl.) 151 (2006) 143&147; S. Ostapchenko, Phys. Rev. D 74, 014026 (2006).
- [4] S.S. Ostapchenko, Phys. Rev. D 83 (2011) 014018.
- [5] E.J. Ahn et al., Phys. Rev D 80, 094003 (2009).
- [6] T. Pierog et al., Report FZKA 7516, Forschungszentrum Karlsruhe 133, (2009).
- [7] W.-D. Apel et al., NIM A 620, 202 (2010).
- [8] D. Heck et al., Report FZKA 6019, Forschungszentrum Karlsruhe (1998).
- [9] A. Fassò et al., Report CERN-2005-10, INFN/TC-05/11, SLAC-R-773 (2005).
- [10] W.-D. Apel et al., Astroparticle Phys. 36, 183 (2012).
- [11] V. Souza et al., Proc. of the 32nd ICRC, Beijing (2011), ID 0953.