Near-infrared H2 and Continuum Survey of Extended Green Objects. II. Complete Census for the Northern Galactic Plane
Abstract
We discuss 94 Extended Green Objects (EGOs) in the northern Galactic plane cataloged by Cyganowski et al, based on near-infrared narrowband H2 (2.122 ) and continuum observations from the United Kingdom Infrared Telescope. This data set is three times larger than our previous study, and is unbiased by preselection. As discussed in the previous paper, the morphologies of the 4.5 emission generally resemble those of the near-infrared continuum, but are different from those of the H2 emission. Of our sample, only 28% of EGOs with H2 emission show similar morphologies between 4.5 and H2 emission. These results suggest that the 4.5 emission mainly comes from scattered continuum from the embedded young stellar object (YSO), and partially from H2 emission. About half of EGOs are associated with H2 outflows, if the H2 outflow incompleteness is considered. The H2 outflow detection rate for EGOs with -band detections (61%) is significantly higher than for those without -band detections (36%). This difference may be due to the fact that both H2 and -band emissions are associated with outflows, i.e., H2 emission and -band continuum are associated with shocks and outflow cavities, respectively. We also compared the correlation between the H2 outflows and Class I 44 GHz methanol masers from literature. The methanol masers can be located upstream or downstream of the H2 outflows and some bright H2 spots or outflows are not associated with methanol masers, suggesting that methanol masers and H2 emission trace different excitation conditions.
1 INTRODUCTION
The current understanding of massive star formation is very limited in both theory and observation (Zinnecker & Yorke, 2007). For the observational point of view, they are rare, distant, and embedded. The Spitzer Space Telescope provides a good opportunity for studying massive star formation, since it has good sensitivity, resolution, and a wide field of view. The Galactic Legacy Infrared Mid-Plane Survey Extraordinaire (GLIMPSE; Benjamin et al., 2003) covers the inner Galactic plane where the majority of young stellar objects (YSOs) in the Milky Way are located. The resolution at IRAC bands () can resolve the diffuse emission related to YSOs. Based on this survey, Cyganowski et al. (2008) identified a new category of source, the “Extended Green Object (EGO)”. In the images (3.6, 4.5, and 8 bands in blue, green, and red, respectively), EGOs show extended emission in the green channel which could be due to excesses in the 4.5 band. It is suggested that this emission may arise from H2 () and/or CO (), excited by shocks from outflows (Cyganowski et al., 2008; Chambers et al., 2009). Therefore, EGOs are candidates for outflows from massive YSOs (MYSOs). Follow-up studies implied that EGOs may be related to outflow activities (Cyganowski et al., 2011, 2009; Chen et al., 2009; He et al., 2012).
Recently, Takami et al. (2012) used IRAC color-color diagrams to study the emission mechanism of EGOs. They compared six EGOs with the colors of other objects and models of the scattered continuum, shocked H2 emission, fluorescent H2 emission, and PAH emission. Of these emission mechanisms, the scattered continuum gives the simplest explanation for the observed results. Simpson et al. (2012) used the Infrared Spectrograph (IRS) on board to study several EGOs, with spectra covering 5–36 . They claimed that the 4.5 emission is not due to the H2 lines, which are too faint to contribute to the 4.5 broad-band emission.
We have studied 34 EGOs (Lee et al., 2012, hereafter Paper I), using H2 narrowband and near-infrared continuum observations from the United Kingdom Infrared Telescope (UKIRT). Combined with IRAC, and MIPS images, we found that the H2 features of the EGOs are more extended than the the 4.5 emission and -/-band continuum, and the H2 emission is rarely associated with the 4.5 emission (3/34). In addition, the morphologies of the near-infrared continuum resemble those of the 4.5 emission, suggesting that the 4.5 emission of the EGOs is dominated by scattered continuum from the embedded YSOs.
Some of the H2 observations in Paper I were preselected, based on previous -band observations. Continuing from Paper I, we include the remaining 60 EGOs in the northern inner Galactic plane for further studies in this paper. This not only increases the EGO sample by a factor of three (94 in total including those in Paper I), but also allows us to preform unbiased statistical studies of the EGOs. Additionally, we discuss the relationship between Class I methanol masers and H2 outflows in this paper.
This paper is organized as follows. We describe the observations and results for the 60 EGOs in Section 2 and 3, respectively. Together with the 34 EGOs in Paper I, we discuss the near-infrared properties of the EGOs in the northern Galactic plane in Section 4, and summarize our conclusions in Section 5.
2 OBSERVATIONS AND DATA REDUCTION
Narrowband H2 images were obtained through the UKIRT Wide Infrared Survey for H2 (UWISH2, =1-0 (1) at 2.122 ; Froebrich et al., 2011). UWISH2 completed an inner Galactic plane survey (; ) with the Wide Field Camera (WFCAM) at UKIRT. A narrowband filter () at 2.122 was used to take H2 images, with an integration time of 720 s per pixel. The 5 detection limit magnitude of point sources is mag in the H2 narrow-band filter, and the surface brightness limit is W m-2 at the typical seeing (; Froebrich et al., 2011). Based on the estimations of Takami et al. (2010) for H2 emission in the 4.5 band of IRAC, Froebrich et al. (2011) suggested that the sensitivity of UWISH2 is 300-2000 times better than the corresponding GLIMPSE detections. The UWISH2 data have been used to study the H2 outflow activities for several star-forming regions (Froebrich & Ioannidis, 2011; Ioannidis & Froebrich, 2012a, b; Dewangan et al., 2012).
In the northern Galactic plane, there are 94 EGOs, which are cataloged by Cyganowski et al. (2008) and covered by UWISH2. Paper I presented the results of the H2 and near-infrared continuum observations for 34 EGOs, and we show the remainder 60 EGOs here.
As for Paper I, we used - and -band images for studying the near-infrared continuum emission. We accessed the (2.20 ) and (1.63 )-band images through the WFCAM Science Archive for the UKIRT Infrared Deep Sky Survey Galactic Plane Survey (UKIDSS GPS; Lucas et al., 2008). GPS surveys more than 1800 deg2 along the northern equatorial Galactic plane in the near-infrared. The 5 (1.63 ) and (2.20 ) detection limits for point sources are 19 and 18.5 mag, respectively. A seeing of at the -band is requested by the survey. The -band images were used to create the continuum-subtracted H2 images, and to compare with the morphologies of the 4.5 emission.
The near-infrared images have been reduced by the Cambridge Astronomical Survey Unit (CASU). The data reduction included flat fielding and sky correction, and frame stacking (Dye et al., 2006). The reduced images were obtained via the Wide Field Astronomy Unit111http://www.roe.ac.uk/ifa/wfau/.
The seeing conditions are different for the H2 and observations. Before subtracting the continuum, the H2 and -band images have to be smoothed to the same full width at half-maximum and the flux of the -band image is scaled to the same flux as the H2 image. The continuum-subtracted H2 image is generated by subtracting the smoothed and scaled -band image from the corresponding H2 narrowband image. For the bright stars with significant residuals in the difference image, we perform PSF-fitting photometry, and subtract a flux-scaled PSF sample image which is locally extracted from the bright reference stars around the target. See the forthcoming paper (Lee J.-J. et al. 2013 in preparation) for a detailed description of the entire reduction procedure.
We visually inspected the continuum-subtracted H2 images for the positions of the 60 EGOs. Once we found an elongated H2 outflow or H2 knot, we checked its H2 and K images to avoid contamination from image artifacts.
In addition to the near-infrared images, we obtained the IRAC and MIPS 24 images from the GLIMPSE (Churchwell et al., 2009) and MIPSGAL (Carey et al., 2009), respectively. We downloaded the post-Basic Calibrated Data mosaic images from NASA/IPAC Infrared Science Archive (IRSA)222http://irsa.ipac.caltech.edu/. The IRAC images provide the morphologies of the EGOs, which will be compared to the H2 and the near-infrared continuum emission. The MIPS 24 images are mainly used to locate the positions of the YSOs in the EGOs. In addition, we also downloaded the IRAC images for 6 low-mass protostellar outflows from Takami et al. (2010) for comparison.
3 RESULTS
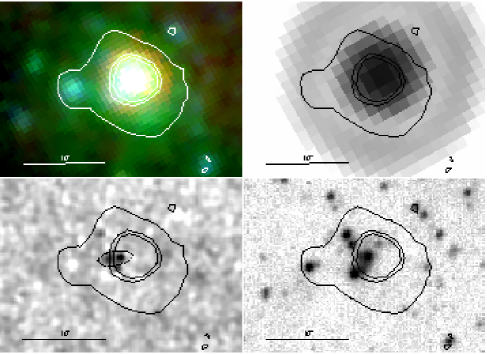
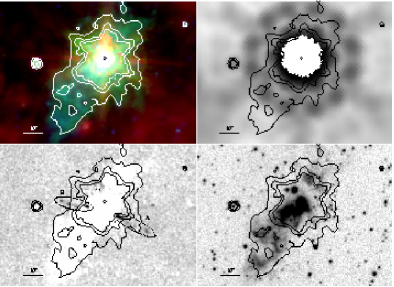
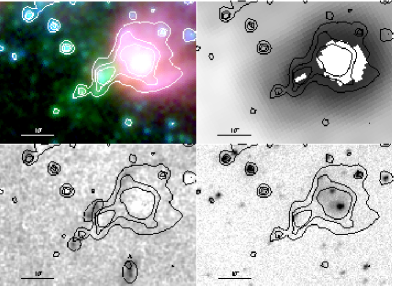
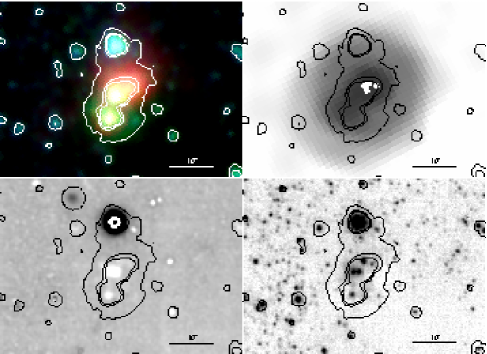
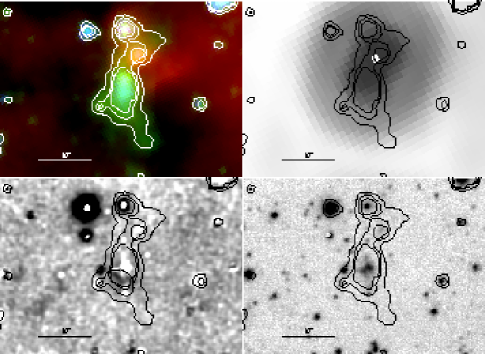
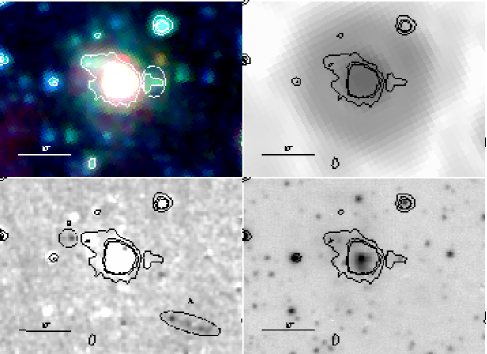
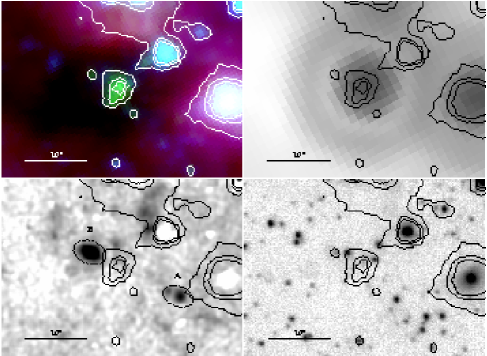
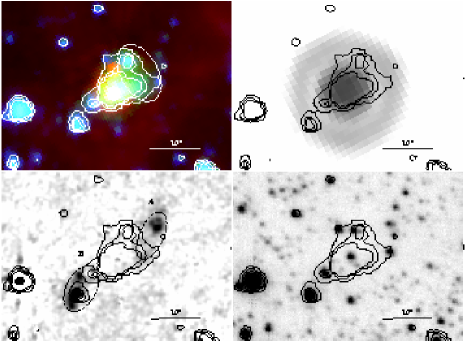
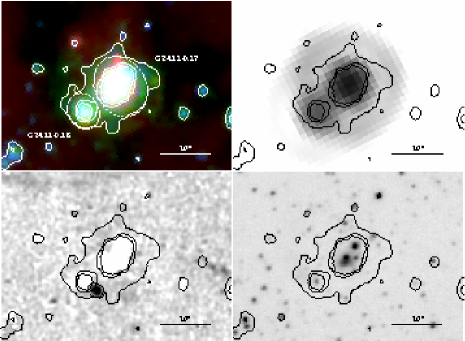
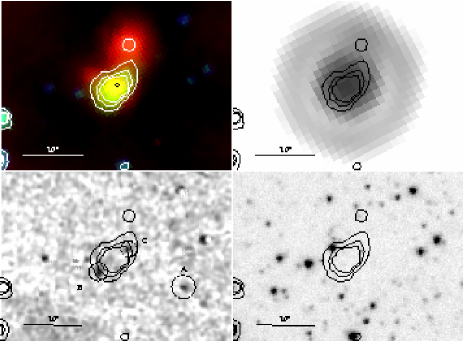
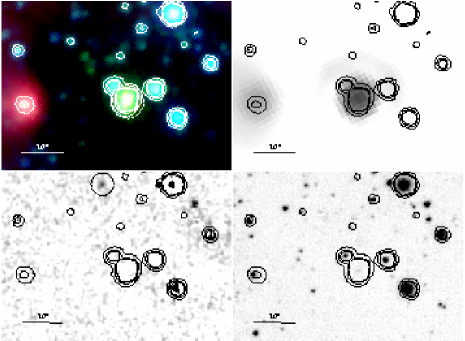
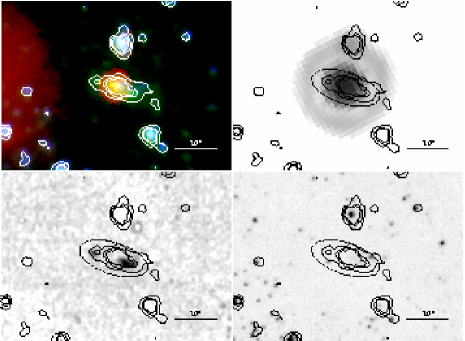
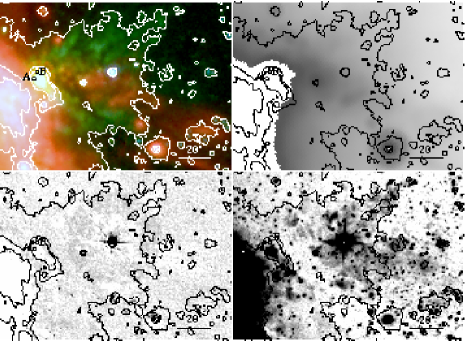
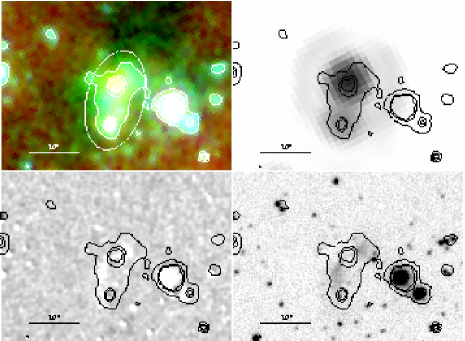
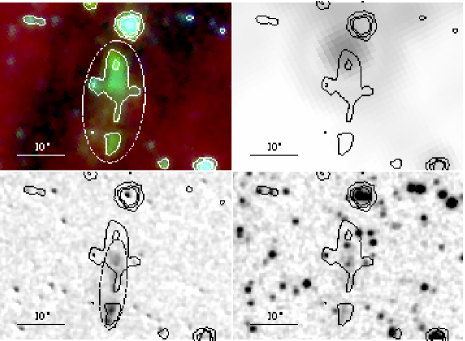
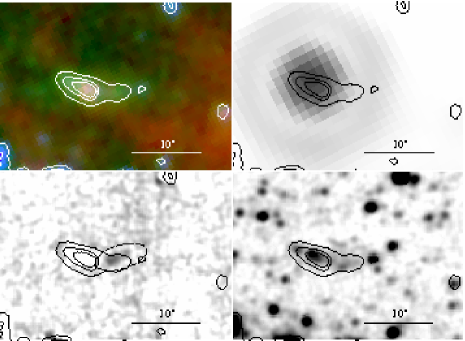
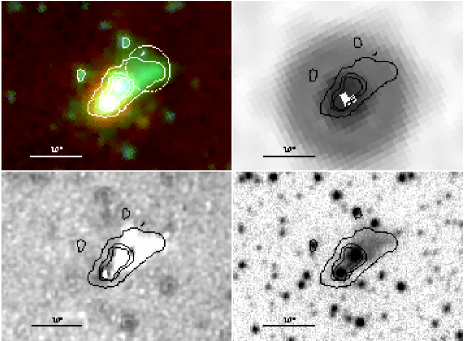
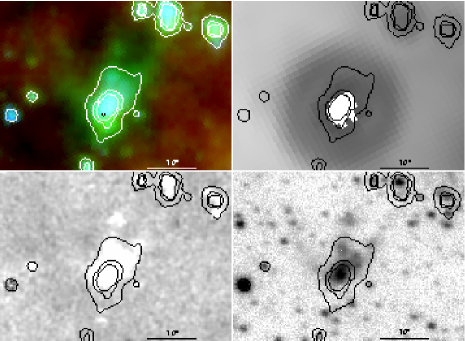
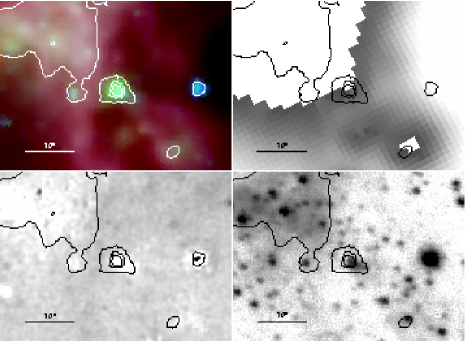
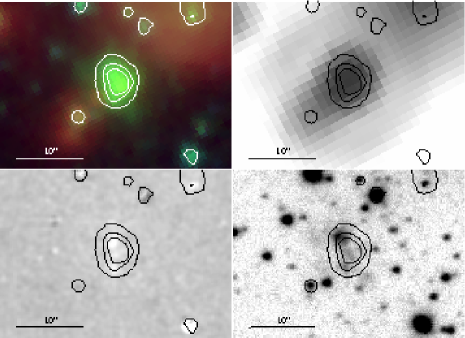
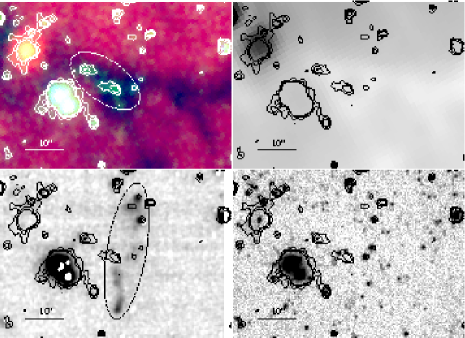
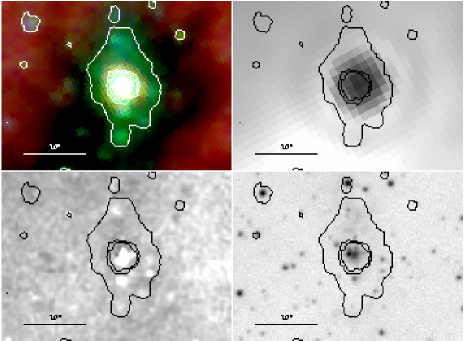
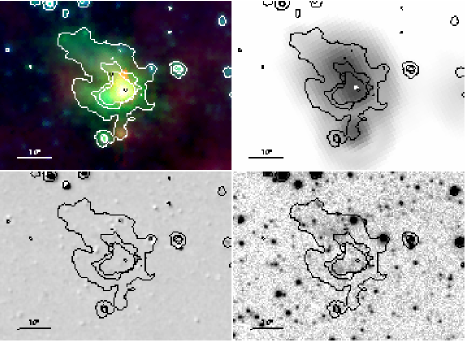
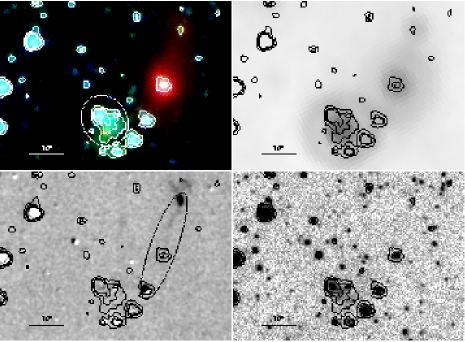
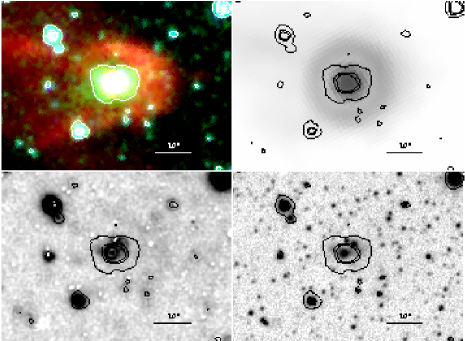
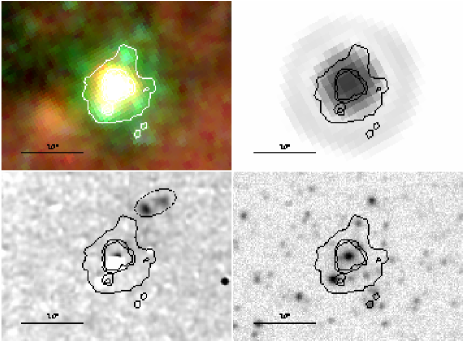
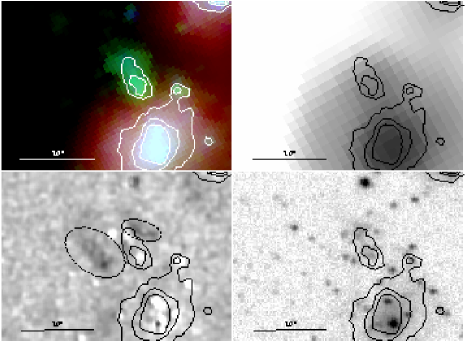
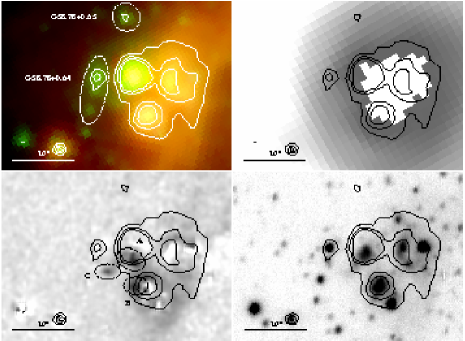
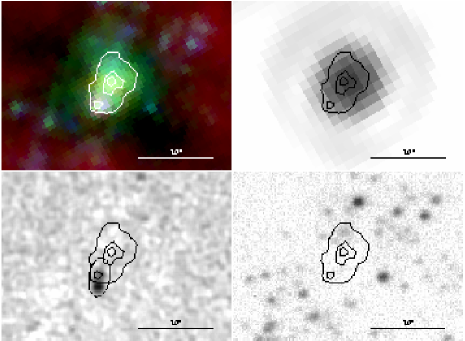
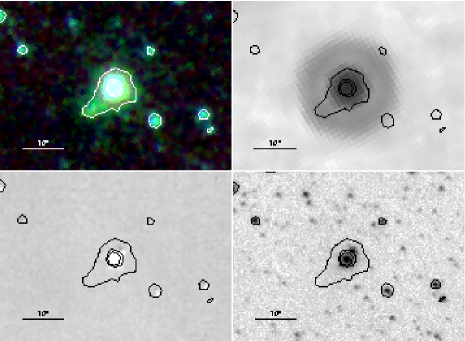
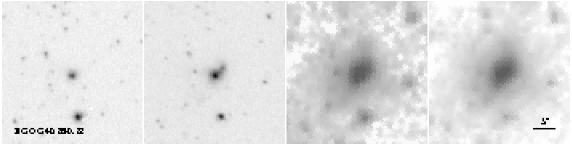
Of our 60 EGO sample, 39 exhibit H2 and/or -band detections, as are shown in Figures 1-37. These figures include images in the IRAC bands (3.6, 4.5, and 8.0 ), MIPS 24 , continuum-subtracted H2, and -band, representing the morphologies of the EGOs, the position of the protostars, the morphologies of the H2 outflows, and -band continuum emission, respectively. The details of the 39 EGOs are described individually in the Appendix.
Table Near-infrared H2 and Continuum Survey of Extended Green Objects. II. Complete Census for the Northern Galactic Plane summarizes the detections of the H2, -, and -band emission for the 60 EGOs. Of the 60 EGOs, those labeled as “Y” and “N” are the EGOs with and without detections, respectively, in H2, -, and -band emission. Those EGOs with outflow candidates are labeled as “Y?”. In addition, we searched for the distances of the 60 EGOs in the literature, and listed the distances and the references in the Table. The distances of the EGOs come from Chen et al. (2009), Cyganowski et al. (2009), and He et al. (2012), using the same galactic rotation curve to estimate their kinematic distances (Reid et al., 2009).
3.1 H2 Emission
In this paper, we found 17 EGOs associated with H2 outflows in the continuum-subtracted H2 images of the 60 EGOs. The H2 outflow detection rate (28%, 17/60) is slightly lower than that of Paper I (35%, 12/34). We will discuss this issue in Section 4.2.
Of the 17 EGOs with H2 outflows, 10 EGOs are associated with an extended bipolar H2 structure (EGO G12.91-0.26, G14.33-0.64, G21.24+0.19, G22.04+0.22, G24.33+0.14, G27.97-0.47, G29.96-0.79, G39.10+0.49, G48.66-0.30, and G49.42+0.33), and 7 EGOs exhibit H2 lobes (EGO G11.11-0.11, G23.82+0.38, G34.39+0.22, G35.03+0.35, G37.48-0.10, G40.28-0.22, and G59.79+0.63). All of the sources mentioned above are classified as sources with H2 outflows. In general, the H2 outflows associated with these objects are highly collimated. Molecular hydrogen emission-line object (MHO, Davis et al., 2010)333http://www.astro.ljmu.ac.uk/MHCat/ numbers are assigned for the newly identified H2 outflows in Table 2.
There are 12 EGOs which only show an isolated H2 knot or extended H2 emission (EGO G17.96+0.08, G19.36-0.03, G24.11-0.18, G24.33+0.14, G24.63+0.15, G34.26+0.15, G40.28-0.27, G53.92-0.07, G54.11-0.08, G57.61+0.02, G58.78+0.64, and G58.78+0.65). The driving sources of the isolated H2 knots are unclear, so they are classified as sources with candidate H2 outflows.
For the 29 EGOs with H2 emission detections, we only found five EGOs showing similar morphologies between the H2 and 4.5 emission, (EGO G27.97-0.47, G34.39+0.22, G37.48-0.10, G49.42+0.33, and G53.92-0.07). For the remaining 24 EGOs, the morphologies of the H2 and 4.5 emission are different. Generally, the H2 emission are more extended than the 4.5 emission.
In the continuum-subtracted H2 images, some of the EGOs show negative valued features, (e.g., EGO G12.91-0.26, G17.96+0.08, G24.11-0.17, G40.28-0.22). These features probably represent the continuum emission with a large infrared excess and high extinction (Paper I). The morphologies of the negative valued features usually resemble those of the -band continuum emission.
3.2 Near-infrared Continuum Emission
In Table Near-infrared H2 and Continuum Survey of Extended Green Objects. II. Complete Census for the Northern Galactic Plane, there are 32 EGOs showing extended -band emission. We compared the morphologies of the -band and 4.5 emission for these EGOs, and found that at least six of them show similar morphologies between the two bands (EGO G12.91-0.26, G21.24+0.19, G40.60-0.72, G45.47+0.05, G50.36-0.42, and G57.61+0.02).
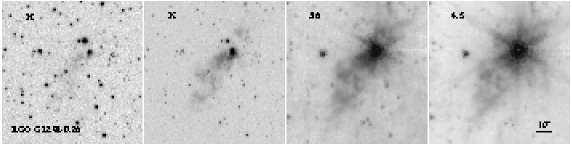
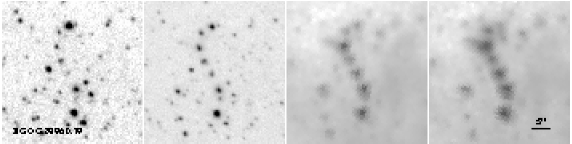
There are 10 EGOs exhibiting -band emission (Table Near-infrared H2 and Continuum Survey of Extended Green Objects. II. Complete Census for the Northern Galactic Plane). Figure 38 shows the morphologies of the 10 EGOs in the , , 3.6 , and 4.5 bands. As seen in the 7 objects in Paper I, the flux distribution changes gradually with wavelength. In addition, the morphologies in different bands are similar for 5 objects (EGO G24.11-0.17, G29.96-0.79, G45.47+0.13, G53.92-0.07, and G62.70-0.51), except for the effect of different angular resolutions.
Compared with the H2 emission of the EGOs, the morphologies of the -band diffuse emission are more similar to that seen at the 4.5 . Furthermore, for those EGOs with -band detections, the morphologies of the and -band emission resemble each other. These results are consistent with Paper I.
3.3 Methanol Master Distribution
Class I methanol masers have been suggested as an outflow tracer, and observations have found a correlation between methanol masers and H2 outflows, e.g., IRAS 16547-4247 (Voronkov et al., 2006), IRAS 20126+4104 (Kurtz et al., 2004), Orion KL (Johnston et al., 1992), and DR 21 (Plambeck & Menten, 1990). Cyganowski et al. (2009) performed a Class I 44 GHz methanol maser survey for 19 EGOs in the northern Galactic plane using the VLA, and 17 of them show positive detections. This survey provides an additional sample for follow-up studies.
All of the 19 EGOs with Class I 44 GHz methanol maser observations (Cyganowski et al., 2009) are covered by UWISH2, so we compare the 44 GHz observation results with our H2 observations. Combined with the Paper I results, we provide the largest data set of H2 observations for Class I 44 GHz methanol masers. We found that there are 8 EGOs with both H2 outflow detections and 44 GHz methanol maser observations (i.e., EGO G11.92-0.61, G19.01-0.03, G19.36-0.03, G22.04+0.22, G35.03+0.35, G37.48-0.10, G39.10+0.49, and G49.42+0.33), as described in the Appendix. Figures 39-45 show the continuum-subtracted H2 images and the distributions of those EGOs with 44 GHz methanol masers detections.
We found that the 44 GHz methanol masers can be located upstream or/and downstream of the H2 lobes in the continuum-subtracted H2 images. The H2 lobes could be associated with primarily blueshifted 44 GHz methanol masers (e.g., EGO G11.92-0.61, G19.01-0.03, and G35.03+0.35), or with redshifted only (EGO G39.10+0.49). Some of the H2 lobes show both blueshifted and redshifted masers (e.g., EGO G19.36-0.03, G22.04+0.22, and G37.48-0.10).
We also found that some bright H2 spots are not associated with 44 GHz methanol masers, e.g., EGO G11.92-0.61 and G39.10+0.49. For the case of EGO G49.42+0.33, there is no 44 GHz methanol maser detection (Cyganowski et al., 2009). However, we found that the EGO was associated with an H2 outflow (Figure 30).
3.4 Radio Detections from the Literature
We searched the literature for radio detections for the 94 EGOs, and found 18 EGOs associated with radio sources444EGO G35.03+0.35 harbors at least two radio sources. CM1 is a UC HII region and CM2 is a HC HII region candidate (Cyganowski et al., 2011).. Seven EGOs are associated with UC H II regions, 10 EGOs are associated with HC H II regions or candidates, and two EGOs are associated with radio thermal jets. Table 3 lists these EGOs and the references.
4 DISCUSSION
In this section, we discuss the 94 EGOs, including the 34 EGOs from Paper I, and their H2 outflows, continuum emission, and radio detections. Besides discussing the general properties of the EGOs, we also consider two subcatalogs: “likely” and “possible” MYSO outflow candidates, as divided by Cyganowski et al. (2008). The differences between “likely” and “possible” sources are that the 4.5 emission of the “possible” sources could be confused by multiple nearby point sources or images artifacts from near bright sources.
4.1 H2 Outflows
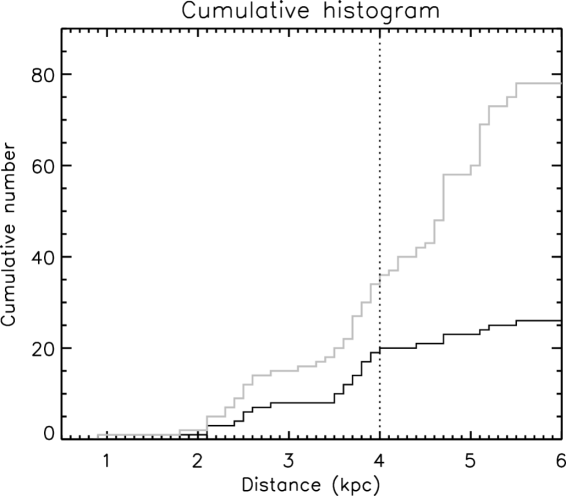
There are 82 EGOs with known kinematic distances (28 with H2 outflows; 13 with outflow candidates; 41 without outflow detections). Figure 46 shows the cumulative distance histograms within 6 kpc for those EGOs with H2 outflows and the entire EGO sample. For those EGOs within 4 kpc, the distributions of the two cumulative histograms are almost identical, based on the Kolmogorov- Smirnov test (probability is 0.99; Press et al., 2007). The probability drops to 0.04, if considering all of the EGOs within 6 kpc. In the Figure, there are only a few EGOs within 2 kpc, and the numbers increase for both cumulative histograms beyond 2 kpc. Between 2.8 and 3.5 kpc, the cumulative numbers become flat, and then increase again after 3.5 kpc. The distributions may represent the presence of spiral arms, where the cumulative numbers increase from 2 to 2.8 kpc and beyond 3.5 kpc.
The similarity between the two cumulative histograms also suggests that the detection rates are similar within 4 kpc. The ratio of those EGOs with H2 outflows to the entire EGOs sample is 50%, and the detection rate becomes lower beyond 4 kpc. Thus, it is reasonable to claim that about half EGOs are associated with H2 outflows, based on the sensitivity of UWISH2.
Ioannidis & Froebrich (2012b) used UWISH2 images to search for H2 outflows along the Galactic plane in Serpens and Aquila, and identified 131 outflows from YSOs. The distances of these H2 outflows are estimated from foreground star counts, and are in the range of 2 to 5 kpc. They suggested that a detection limit of UWISH2 observations of 5 kpc. Our results are generally consistent with theirs, except for EGO G49.42+0.33. The kinematic distance of EGO G49.42+0.33 is around 12.3 kpc (Chen et al., 2009; Cyganowski et al., 2009; He et al., 2012). However, this EGO is detected to be associated with a bipolar H2 outflow. Based on the detection limit estimation by Ioannidis & Froebrich (2012b) and our results, we are probably unable to detect H2 outflow at that distance. The molecular cloud, where the EGO is located, may have peculiar velocity, resulting in an overestimate of its kinematic distance. Another possibility is that the H2 outflow is more extended and brighter than the typical H2 outflows, so it can be detected at the distance.
The excitation conditions of the H2 line emission in the 4.5 -band is similar to =1-0 (1) at 2.122 (Takami et al., 2010). One would expect to see similar morphologies between the 4.5 and the H2 emission, if the 4.5 emission really comes from the H2 line emission. However, the morphologies between H2 and 4.5 emission are different for most of the EGOs with H2 outflows.
On the other hand, 8 EGOs (28% of EGOs with H2 emission) show similar morphologies between H2 and 4.5 emission. This also can be seen in the energetic outflow from DR 21 (Marston et al., 2004). The similar morphologies between H2 and 4.5 , implying that 4.5 emission likely comes from H2 emission. However, these sources comprise less than one third of the EGOs with H2 outflows.
In addition, some previous observations support the premise that the 4.5 emission comes from H2 emission, e.g., 6 outflows from low-mass YSOs from nearby star-forming regions (Takami et al., 2010). We used these 6 outflows to investigate their properties. As described in Cyganowski et al. (2008), the faintest EGOs from GLIMPSE have surface brightness 4 MJy sr-1. The 4.5 surface brightnesses of the 6 outflows are generally less than 4 MJy sr-1, except for some bright knots. The sizes of the bright knots are . If they were located a few kpc away, then they would not be spatially resolved by . In summary, the extended features of the 6 outflows from low-mass YSOs are undetectable in GLIMPSE.
The H2 outflow detection rates for the “likely” MYSO outflow candidates (42%) are higher than those for the “possible” ones (19%) for the entire sample. If only considering those EGOs within 4 kpc, the rates increase to 62% for the former and 44% for the later. This suggests that some of the “possible” candidates could be really affected by multiple nearby point sources or images artifacts from near bright sources, and they may be not bright at 4.5 intrinsically. Another possibility is the “possible” MYSO outflow candidates associated with weaker outflow activities, implying these two subcategories may be in different evolution stages.
4.2 Morphologies of H2 and Infrared Continuum Emission
The majority of the and -band diffuse continuum emission comes from the scattered continuum from embedded YSOs in star-forming regions (Connelley et al., 2007; Hodapp, 1994). The surrounding gas or the outflow cavities can scatter the emission from YSOs (Hashimoto et al., 2008, 2007; Tamura et al., 2006). This can also be seen in EGOs, e.g., the polarization observation of EGO G35.20-0.74 (Walther et al., 1990) and the adaptive-optics-assisted near-infrared integral field spectroscopic observations of EGO G12.91-0.26 (W33A) (Davies et al., 2010).
The entire -band detection rate of the EGOs is 57% (54/94). For the “likely” and “possible” MYSO outflow candidates, their -band detection rates are similar, 56% and 60%, respectively. Based on the UKIDSS GPS observations, the -band detection rate for the EGOs is 19% (18/94) in the northern Galactic plane.
The EGOs with -band emission have a significantly higher detection rate for H2 outflows. For those EGOs with -band detections and distances kpc, the H2 outflow detection rate is 61%. In contrast, for those EGO without -band detections within 4 kpc, the H2 outflow detection rate is 36%. Since the -band emission comes from the scattered continuum from the outflow cavity or the surrounding gas of an embedded YSO, it is natural to have a correlation between -band and H2 outflow detections. The correlation can explain why the H2 outflow detection rate in Paper I is slightly higher than that in this work, as described in Section 3.1. The differences are due to the sample in Paper I including some preselected EGOs with -band detections.
Compared with the H2 emission, the morphologies of the -band continuum emission are usually more compact and closer to the driving sources (Lee et al., 2012; Davis et al., 2007; Varricatt et al., 2010). The similar morphologies between the -band and 4.5 emission imply the same origin for these two infrared emission. We suggest that the 4.5 emission primarily comes from scattered continuum from the embedded YSOs, with a smaller contribution from the H2 line emission. The 4.5 emission is unlikely to represent the H2 line emission in the 4.5 band, as the -band continuum emission can not represent the H2 line emission at 2.122 .
4.3 Class I 44 GHz Methanol Maser and Radio Continuum Detections
Class I methanol masers are collisionally excited, and were suggested as an outflow tracer. As described in Section 3.3, there is a variety of distributions between the H2 outflows and the Class I 44 GHz methanol masers, which can be located upstream or downstream of the H2 emission. Some bright H2 spots or outflows are even not associated with any methanol maser. It could be that the methanol masers and H2 emission trace different excitation conditions.
In order to determine if UC and HC H II regions are still accreting or not, we use the existences of H2 outflows as an indicator. Although this is not a direct measurement of mass accretion, there is growing evidence that outflow activities are powered by mass accretion (Davis et al., 2004; Calvet et al., 1997; Hartigan et al., 1995). The former is much easier to observe.
Four of the 10 HC H II regions are associated with H2 outflows (EGO G11.92-0.61, G12.91-0.26, G35.03+0.35, and G35.20-0.74). If we consider those EGOs within 4 kpc, then the H2 detection rate is 57% (4/7), which is similar to that of the EGOs. It implies that the majority of the MYSOs in the HC H II regions are still accreting.
For the 7 EGOs associated with UC H II regions, only one EGO (G24.33+0.14) is associated with an H2 outflow (Figure 10). However, of the 7 UC H II regions, only two are located within 4 kpc, so the sample is too limited to conclude if UC H II regions are accreting or not.
For UC and HC H II regions, their radio sources coincide with the positions of the massive stars. However, the two radio sources (IRAS 18182-1433b and 18264-1152b) do not coincide with the 24 sources of EGO G16.59-0.05 and G19.88-0.53, respectively, and their radio spectral indexes are consistent with thermal jets. Furthermore, these two radio sources are associated with H2 outflows. Throughout, the radio emission of IRAS 18182-1433b and 18264-1152b is contributed by thermal jets.
Cyganowski et al. (2011) performed deep radio observations of EGOs with the VLA, and found that 8 out of 14 EGOs did not show any radio emission. Of the 8 radio quiet EGOs, three EGOs are associated with H2 outflows and one with H2 an outflow candidate. Since these source are still accreting, the infall gas would absorb the stellar UV photons and quench the H II regions (Walmsley, 1995; Keto, 2007). This would reduce the radio detection rate, even though the YSOs are massive enough to produce H II regions.
5 CONCLUSIONS
In this paper, we present the narrowband H2 (UWISH2) and near-infrared continuum (UKIDSS GPS) results from UKIRT for 60 EGOs. In general, we find that the morphologies of the Spitzer 4.5 emission are generally similar to those of the near-infrared continuum, but different from those of the H2 emission. The 4.5 emission is seldom associated with 2.122 line H2 emission (28% of those EGOs with H2 emission). We suggest that the 4.5 emission comes mainly from scattered continuum and partially from H2 emission. The 4.5 emission is unlikely to represent the H2 line emission at 4.5 band, as the -band continuum emission does not represent the H2 line emission at 2.122 . These results are consistent with our previous studies.
Combined with our previous studies, we present all 94 EGOs in the northern Galactic plane. We summarize our findings below.
-
1.
We found that our detection of H2 emission for EGOs is complete to a distance of about 4 kpc based on the sensitivity of UWISH2 observations, and about half of EGOs are associated with H2 outflows.
-
2.
When considering those EGOs within 4 kpc, the H2 outflow detection rate for those EGOs classified as “likely” MYSO outflow candidates (62%) is higher than that for “possible” MYSO outflow candidates (44%). The lower detection rate for the later may be due to the 4.5 excesses being artifacts from nearby multiple point or bright sources, or they are in different evolution stages.
-
3.
There is a variety of distributions between the Class I 44 GHz methanol masers with respect to the H2 outflows. The masers could be located upstream or downstream of the H2 emission. Some bright H2 spots or outflows are not associated with methanol masers. It could be that the methanol masers and H2 emission trace different excitation conditions.
-
4.
There is a positive correlation between the -band and H2 outflow detections. For those EGOs within 4 kpc, the H2 outflow detection rate for the EGOs with -band detections (61%) is significantly higher than that of the EGOs without -band detections (36%), respectively. Since the -band emission comes from the scattered continuum of the the outflow cavity or the surrounding gas of an embedded YSO, it is natural to see the correlation.
-
5.
Based on a literature search, there are 7 EGOs associated with HC H II regions. More than half of the HC H II regions have companion H2 outflows, suggesting that at least half of them are still accreting.
Appendix A Selected Individual Sources
We present those EGOs with H2 and/or -band emission detections.
EGO G11.11-0.11 (Figure 1). The 4.5 emission surrounds a 24 source, and the lowest contour around the EGO roughly represents its shape. Two aligned H2 knots are identified in the continuum-subtracted H2 image; the 24 source could be its driving source. A -band diffuse source is found around the 4.5 contour peak.
EGO G12.91-0.26 (Figure 2). EGO G12.91-0.26 is associated with a radio source (W33A) with spectral index (van der Tak & Menten, 2005), suggesting that W33A could be a HC H II region. A bright saturated 24 source is located at the 4.5 contour peak. The main 4.5 emission extends toward the SE direction. Based on adaptive-optics-assisted near-infrared integral field spectroscopic observations, Davies et al. (2010) suggested that the -band emission is light reflected from the YSO W33A. They found an H2 outflow very close to the driving source and the outflow extending along the SE direction (the same as the 4.5 emission). In our continuum-subtracted H2 image, we did not find the H2 outflow identified by Davies et al. (2010), because the H2 outflow is located very close to the MYSOs where the scattered continuum dominates the near-infrared emission. However, we found another bipolar H2 outflow in the E-W direction. Its orientation is different from that of the 4.5 emission. In the -band image, its morphology is similar to that of the 4.5 emission.
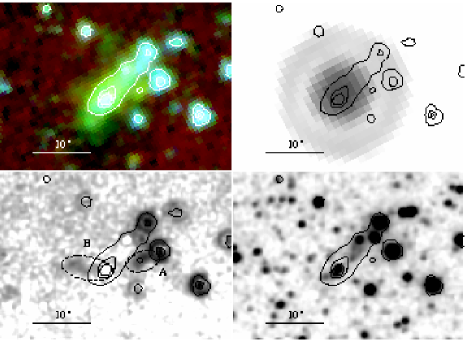
EGO G14.33-0.64 (Figure 3). The 4.5 emission extends beyond the H II region (G14.33-0.64, Sewilo et al., 2004), which shows a reddish color in the image. There are two 24 sources. One is related to the H II region, and the other one may be associated with the EGO. Two H2 lobes (A and B) and one H2 knot (C) can be seen in the continuum-subtracted H2 image; they do not coincide with the EGO. The two H2 lobes and the 24 source associated with the EGO are aligned, so the 24 source could be the driving source of the two H2 lobes.
EGO G17.96+0.08 (Figure 4). The 4.5 emission is distributed around a 24 source. An H2 knot is located at a distance of . It is not clear if the H2 knot is physically related to the EGO or not. There is a -band source at the peak of the 4.5 contours.
EGO G19.36-0.03 (Figure 5). The 4.5 emission extends toward the SE. There is a 24 source located at the peak of the 4.5 emission. Faint H2 emission is found in the continuum-subtracted H2 image, and extends along the NE-SW direction. It is unclear if the 24 source is the driving source or not. An extended -band source is located at the peak of the 4.5 contour map.
EGO G21.24+0.19 (Figure 6). A 24 source is located at the peak of the 4.5 emission. There is a bipolar H2 outflow identified by Ioannidis & Froebrich (2012a) (MHO 2255 and 2256). The 24 source could be the driving source. There is a -band extended source coincident with the EGO.
EGO G22.04+0.22 (Figure 7). There is a 24 source at the 4.5 contour peak. A bipolar H2 outflow (MHO 2260) has been reported by Ioannidis & Froebrich (2012a) with the 24 source, which is likely the driving source of the outflow. No -band source is found in the -band image.
EGO G23.82+0.38 (Figure 8). There is a 24 source located at the 4.5 contour peak with the EGO extending to the NW of the peak. Ioannidis & Froebrich (2012a) identified an H2 lobe (MHO 2262). The 24 source could be the driving source of the outflow. In the -band image, there is a point source at the 4.5 peak.
EGO G24.11-0.17 and G24.11-0.18 (Figure 9). There are two EGOs in the figure. Each is associated with a 24 source. There is an H2 knot near and slightly extended toward G24.11-0.18, so the H2 knot is more likely related to the EGO. In the -band image, there are multiple sources around the G24.11-0.17, and one source associated with G24.11-0.18.
EGO G24.33+0.14 (Figure 10). An H II region (G24.33+0.11 GLM1, Battersby et al., 2010) is found at the peak of the 4.5 emission. There is a 24 source located at the 4.5 contour peak. In the continuum-subtracted H2 image, an H2 outflow (MHO 3258) with two H2 knots are identified. There is no -band source at the 4.5 contour peak.
EGO G24.63+0.15 (Figure 11). At the 4.5 contour peak, there is a 24 source. An H2 knot is found in the continuum-subtracted H2 image, but it is unclear if the H2 knot is related to the EGO or not. In the image, a faint -band source is located at the 4.5 contour peak.
EGO G27.97-0.47 (Figure 12). A 24 source is located near the peak of the 4.5 contour. There is an H2 outflow (MHO 2441) reported by (Ioannidis & Froebrich, 2012a). Its morphology is similar to that of the 4.5 emission. In -band image, the extended emission coincides with the western H2 lobe.
EGO G29.96-0.79 (Figure 13). The EGO is elongated along the NS direction, and associated with several point sources. There are two possible faint 24 sources, located in the north part of the EGO. In the continuum-subtracted H2 image, an H2 outflow is identified and distributed along the EW direction. It is unclear which point source is the driving source. Each 4.5 peak has a corresponding -band source in the -band image.
EGO G34.26+0.15 (Figure 14). In this field, there is a cometary UC H II region G34.3+0.2 (Reid & Ho, 1985) with its tail pointing toward the west. In addition, there are two HC H II regions (G34.26+0.15 A and B, Gaume et al., 1994; Sewilo et al., 2011) located near the head of the cometary UC H II region. In the 24 image, the locations of the two HC H II regions are saturated. Several H2 knots are found in the continuum-subtracted H2 image, but it is not clear if they are associated with the HC H II regions or not. No -band sources are found near the EGO.
EGO G34.28+0.18 (Figure 15). In the 4.5 contour map, there are two peaks, each of which is associated with a 24 source. No H2 emission is detected around the EGO. In the -band image, two fan shaped diffuse sources are found around the north 24 source.
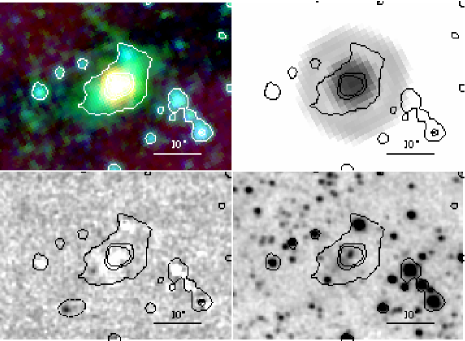
EGO G34.39+0.22 (Figure 16). The EGO is elongated in the NS direction. There is a 24 source located near the 4.5 contour peak. In continuum-subtracted H2 image, an H2 lobe is identified, and the 24 source could be its driving source. In general, the morphologies of the 4.5 and H2 emission are similar. No apparent -band source is seen in the -band continuum image.
EGO G35.03+0.35 (Figure 17). Cyganowski et al. (2011) found several radio centimeter sources associated with the EGO. EGO G35.03+0.35 CM1 exhibits free-free emission. EGO G35.03+0.35 CM2 is associated with 6.7 GHz methanol masers (Cyganowski et al., 2009) and could be a HC H II region (Cyganowski et al., 2011). The 4.5 emission of EGO G35.03+0.35 is extended in the NE-SW direction. A saturated 24 source is located near the 4.5 contour peak. In the continuum-subtracted H2 image, an H2 lobe is found, and likely extends from G35.03+0.35 CM2. The -band emission is elongated along the NE-SW direction, similar to the 4.5 emission.
EGO G37.48-0.10 (Figure 18). The EGO is elongated along the EW direction. There is a 24 source located near the peak of the 4.5 contours. In the continuum-subtracted H2 image, an H2 outflow lobe is distributed toward the west of the EGO. A -band diffuse source is found around the 4.5 contour peak.
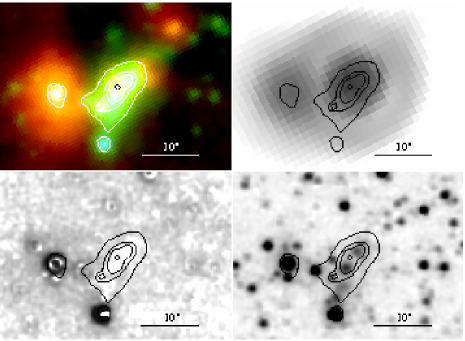
EGO G39.10+0.49 (Figure 19). The EGO is distributed along the NW-SE direction. There is a 24 source located at the 4.5 contour peak. In the continuum-subtracted H2 image, a bipolar H2 outflow is identified with a morphology different from that of the 4.5 emission. A -band extended source is located at the peak of the 4.5 contour map, and the -band emission also extends along the NW-SE axis.
EGO G39.39-0.14 (Figure 20). The 4.5 contour peak coincides with a 24 source. In addition, an H II region (IRAS 19012+0536 B, Hofner et al., 2011) is also located near the peak. There is no H2 emission found in the continuum-subtracted H2 image. In the -band image, a -band diffuse source extends along the axis of the EGO.
EGO G40.28-0.22 (Figure 21). A saturated 24 source is surrounded by the 4.5 emission. There is an H2 lobe extending from the 24 source in the continuum-subtracted H2 image. An extended -band source is located at the 4.5 contour peak.
EGO G40.28-0.27 (Figure 22). A 24 source is located at the 4.5 contour peak. In the continuum-subtracted H2 image, an H2 knot is found. It is unclear, if the H2 knot is related to the EGO or not. There is a faint -band diffuse source at the peak of the 4.5 emission.
EGO G40.60-0.72 (Figure 23). In the 4.5 contour map, there are two contour peaks, the NW one associated with the EGO. A saturated 24 source is located between the two 4.5 contour peaks. No H2 emission is found. The SE and NW 4.5 peaks are associated with a -band point source and an extended source, respectively. The morphologies of the 4.5 and -band emission are similar.
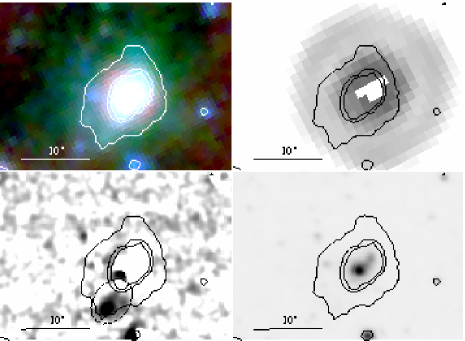
EGO G45.47+0.05 (Figure 24). The EGO is associated with an H II region (G045.4657+00.0453, Urquhart et al., 2009) which is located around the peak of the saturated 24 source. No H2 emission is found in the continuum-subtracted H2 image. The -band emission peaks at the the contour peak of the 4.5 emission contour.
EGO G45.47+0.13 (Figure 25). The EGO is located at the edge of an H II region which saturates the 24 image. No H2 emission is found in the continuum-subtracted H2 image. There is -band diffuse source at the peak of the 4.5 contours, and the morphologies of the -band and 4.5 emission are similar.
EGO G45.80-0.36 (Figure 26). The EGO is associated with a 24 source. In the continuum-subtracted H2 image, there is no H2 emission detection. The -band image shows a diffuse source around the 4.5 contour peak.
EGO G48.66-0.30 (Figure 27). EGO G48.66-0.30 is faint in the 4.5 image. In the 4.5 contour map, there are two peaks. The west peak is associated with a faint 24 source. We found a bipolar H2 outflow. The morphologies of the H2 and the 4.5 emission are different. The 24 source could be the driving source of the H2 outflow. No -band source is associated with the 4.5 emission.
EGO G49.07-0.33 (Figure 28). In the 4.5 contour peak, there is a 24 source. No H2 emission is associated with the EGO. A diffuse -band source coincides with the 4.5 peak.
EGO G49.27-0.34 (Figure 29). This EGO is associated with two 24 sources; each of them coincides with a radio source Cyganowski et al. (2011). In the continuum-subtracted H2 image, there is no H2 emission; however -band continuum emission can be seen in the figure. This supports the result of Germini - and -band spectral observations (De Buizer & Vacca, 2010). This EGO does not show H2 emission and the infrared emission comes from the scattered continuum.
EGO G49.42+0.33 (Figure 30). The EGO is elongated along the N-S axis. There is no apparent 24 source associated with this EGO. An H2 bipolar outflow is identified and is also elongated in the N-S direction. One 4.5 peak coincides with -band diffuse emission.
EGO G50.36-0.42 (Figure 31). In the 4.5 contour map, a 24 source is located near the peak. There is an H2 outflow near the EGO, but they are not physically related. A -band source coincides with the 4.5 peak and extended toward the SW direction as does the 4.5 emission.
EGO G53.92-0.07 (Figure 32). EGO G53.92-0.07 is extended along the EW direction, and is associated with a 24 source. There is weak H2 diffuse emission around the 4.5 peak. This may be due to residuals from the continuum subtraction rather than being true H2 emission. The -band emission is also extended similar to the 4.5 emission.
EGO G54.11-0.08 (Figure 33). The 4.5 emission surrounds a 24 source. An H2 lobe or knot is found around the EGO, but it is unclear if they are related. There is a -band source located at the 4.5 peak.
EGO G57.61+0.02 (Figure 34). The 4.5 is elongated in the NE-SW direction. There is weak H2 emission, but it is not related to the 4.5 emission. The morphologies of the -band and 4.5 emission are similar.
EGO G58.78+0.64 and G58.78+0.65 (Figure 35). In this field, there are two EGOs located at the border of an H II region. No 24 sources are associated with these two EGOs. Three H2 knots are found around the EGOs, but it is unclear if they are related. In the -band image, EGO G58.78+0.64 shows extended emission.
EGO G59.79+0.63 (Figure 36). There is a 24 source located at the 4.5 contour peak. In the continuum-subtracted H2 image, an H2 lobe is found and the 24 source is likely to be the driving source. No -band continuum emission is associated with the EGO.
EGO G62.70-0.51 (Figure 37). The EGO is extended toward the SE direction from a 24 source located at the 4.5 peak. There is no H2 emission in the continuum-subtracted H2 image. At the 4.5 contour peak, at least three -band sources are located.
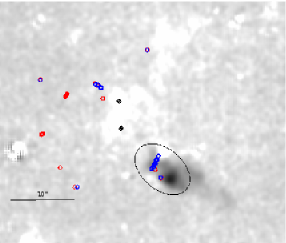
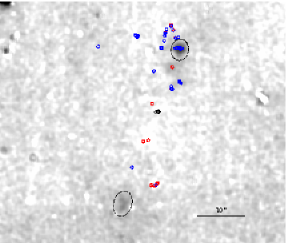
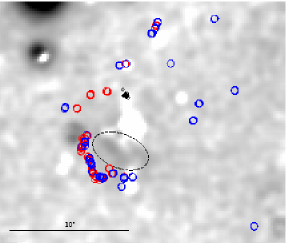
Appendix B H2 Outflows Associated with 44 GHz Methanol Masers
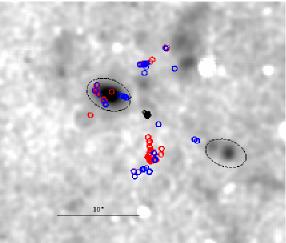
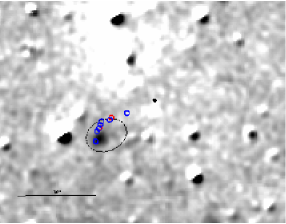
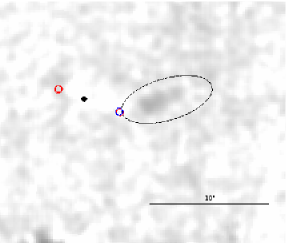
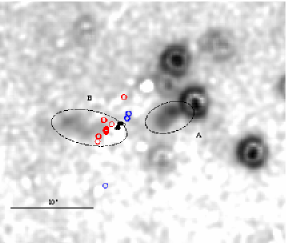
Here, we describe those EGOs with H2 detections and 44 GHz methanol maser observations (Cyganowski et al., 2009). In Figure 39-45, the 44 GHz masers are superposed on the continuum-subtracted H2 images. The red and blue circles are the redshifted and blueshifted masers relative to the VLSR, respectively. The black diamonds represent the positions of the 6.7 GHz methanol masers (Cyganowski et al., 2009), tracing the positions of the MYSOs.
EGO G11.920.61 (Figure 39). Lee et al. (2012) found that EGO G11.92-0.61 is associated with an H2 outflow lobe. The majority of the 44 GHz methanol masers around the H2 lobe are blueshifted. The 44 GHz methanol maser group is located upstream of the H2 emission.
EGO G19.010.03 (Figure 40). For EGO G19.01-0.03, Lee et al. (2012) identified an H2 outflow with two H2 knots along the N-S direction. In the continuum-subtracted H2 image, the north H2 knot is brighter than the south one. For the northern H2 knot, the 44 GHz methanol masers are distributed both upstream and downstream of the H2 emission and the majority of the masers are blueshifted. In contrast, the 44 GHz methanol masers are only located upstream of the southern H2 knot, and most of them are redshifted.
EGO G19.360.03 (Figure 41). The EGO is associated with a faint H2 lobe. The 44 GHz methanol masers are distributed downstream of the H2 emission, assuming the driving source is located at the position of the 6.7 GHz methanol maser. In the continuum-subtracted H2 image, there are blueshifted and redshifted methanol masers around the H2 emission.
EGO G22.04+0.22 (Figure 42). This EGO has a bipolar H2 outflow along the NE-SW direction. In the continuum-subtracted H2 image, the NE H2 lobe is brighter than the SW one. There are blueshifted and redshifted 44 GHz methanol masers located around the NE H2 lobe. In contrast, the SW H2 lobe is dominated by blueshifted methanol masers, and the masers are distributed upstream.
EGO G35.03+0.35 (Figure 43). In the continuum-subtracted H2 image, the EGO only shows an H2 lobe. There is a group of 44 GHz methanol masers surrounding the H2 emission, and they are mainly blueshifted. For this EGO, there is no counter-jet for the H2 or 44 GHz methanol masers; however Paron et al. (2012) identified a bipolar CO outflow in single dish observations.
EGO G37.480.10 (Figure 44). There is an H2 lobe located to the west of the 6.7 GHz methanol masers. Two groups of methanol masers are distributed along the EW direction. The eastern group is dominated by redshifted 44 GHz methanol masers. The western group of the 44 GHz methanol masers is located upstream of the H2 lobe, and the majority of the 44 GHz methanol masers are blueshifted.
EGO G39.10+0.49 (Figure 45). The EGO shows a bipolar H2 outflow in the EW direction. There are redshifted 44 GHz methanol masers distributed upstream of the eastern H2 lobe. However, the brighter western H2 lobe is not associated with any 44 GHz methanol masers.
References
- Battersby et al. (2010) Battersby, C., Bally, J., Jackson, J. M., Ginsburg, A., Shirley, Y. L., Schlingman, W., & Glenn, J. 2010, ApJ, 721, 222
- Benjamin et al. (2003) Benjamin, R. A., Churchwell, E., Babler, B. L., et al. 2003, PASP, 115, 953
- Beuther & Shepherd (2005) Beuther, H., & Shepherd, D. 2005, Cores to Clusters: Star Formation with Next Generation Telescopes, 105
- Calvet et al. (1997) Calvet, N., Hartmann, L., & Strom, S. E. 1997, ApJ, 481, 912
- Carey et al. (2009) Carey, S. J., et al. 2009, PASP, 121, 76
- Chambers et al. (2009) Chambers, E. T., Jackson, J. M., Rathborne, J. M., & Simon, R. 2009, ApJS, 181, 360
- Chen et al. (2009) Chen, X., Ellingsen, S. P., & Shen, Z.-Q. 2009, MNRAS, 396, 1603
- Churchwell et al. (2009) Churchwell, E., et al. 2009, PASP, 121, 213
- Connelley et al. (2007) Connelley, M. S., Reipurth, B., & Tokunaga, A. T. 2007, AJ, 133, 1528
- Cyganowski et al. (2011) Cyganowski, C. J., Brogan, C. L., Hunter, T. R., Churchwell, E., & Zhang, Q. 2011, ApJ, 729, 124
- Cyganowski et al. (2009) Cyganowski, C. J., Brogan, C. L., Hunter, T. R., & Churchwell, E. 2009, ApJ, 702, 1615
- Cyganowski et al. (2008) Cyganowski, C. J., et al. 2008, AJ, 136, 2391
- Davies et al. (2010) Davies, B., Lumsden, S. L., Hoare, M. G., Oudmaijer, R. D., & de Wit, W.-J. 2010, MNRAS, 402, 1504
- Davis et al. (2010) Davis, C. J., Gell, R., Khanzadyan, T., Smith, M. D., & Jenness, T. 2010, A&A, 511, A24
- Davis et al. (2007) Davis, C. J., Kumar, M. S. N., Sandell, G., Froebrich, D., Smith, M. D., & Currie, M. J. 2007, MNRAS, 374, 29
- Davis et al. (2004) Davis, C. J., Varricatt, W. P., Todd, S. P., & Ramsay Howat, S. K. 2004, A&A, 425, 981
- Davis & Smith (1996) Davis, C. J., & Smith, M. D. 1996, A&A, 310, 961
- De Buizer & Vacca (2010) De Buizer, J. M., & Vacca, W. D. 2010, AJ, 140, 196
- Dewangan et al. (2012) Dewangan, L. K., Ojha, D. K., Anandarao, B. G., Ghosh, S. K., & Chakraborti, S. 2012, ApJ, 756, 151
- Dye et al. (2006) Dye, S., et al. 2006, MNRAS, 372, 1227
- Froebrich et al. (2011) Froebrich, D., et al. 2011, MNRAS, 413, 480
- Froebrich & Ioannidis (2011) Froebrich, D., & Ioannidis, G. 2011, MNRAS, 418, 1375
- Garden et al. (1991) Garden, R. P., Geballe, T. R., Gatley, I., & Nadeau, D. 1991, ApJ, 366, 474
- Gaume et al. (1994) Gaume, R. A., Fey, A. L., & Claussen, M. J. 1994, ApJ, 432, 648
- Gibb et al. (2003) Gibb, A. G., Hoare, M. G., Little, L. T., & Wright, M. C. H. 2003, MNRAS, 339, 1011
- Hartigan et al. (1995) Hartigan, P., Edwards, S., & Ghandour, L. 1995, ApJ, 452, 736
- Hashimoto et al. (2008) Hashimoto, J., Tamura, M., Kandori, R., et al. 2008, ApJ, 677, L39
- Hashimoto et al. (2007) Hashimoto, J., Tamura, M., Kandori, R., et al. 2007, PASJ, 59, 481
- He et al. (2012) He, J. H., Takahashi, S., & Chen, X. 2012, ApJS, 202, 1
- Hodapp (1994) Hodapp, K.-W. 1994, ApJS, 94, 615
- Hofner et al. (2011) Hofner, P., Kurtz, S., Ellingsen, S. P., et al. 2011, ApJ, 739, L17
- Ioannidis & Froebrich (2012a) Ioannidis, G., & Froebrich, D. 2012a, MNRAS, 421, 3257
- Ioannidis & Froebrich (2012b) Ioannidis, G., & Froebrich, D. 2012b, MNRAS, 425, 1380
- Johnston et al. (1992) Johnston, K. J., Gaume, R., Stolovy, S., et al. 1992, ApJ, 385, 232
- Keto (2007) Keto, E. 2007, ApJ, 666, 976
- Kurtz et al. (2004) Kurtz, S., Hofner, P., & Álvarez, C. V. 2004, ApJS, 155, 149
- Lee et al. (2012) Lee, H.-T., Takami, M., Duan, H.-Y., et al. 2012, ApJS, 200, 2, Paper I
- Lucas et al. (2008) Lucas, P. W., et al. 2008, MNRAS, 391, 136
- Marston et al. (2004) Marston, A. P., Reach, W. T., Noriega-Crespo, A., et al. 2004, ApJS, 154, 333
- Mehringer (1994) Mehringer, D. M. 1994, ApJS, 91, 713
- Paron et al. (2012) Paron, S., Ortega, M. E., Petriella, A., et al. 2012, MNRAS, 419, 2206
- Plambeck & Menten (1990) Plambeck, R. L., & Menten, K. M. 1990, ApJ, 364, 555
- Press et al. (2007) Press, W. H., Teukolsky, S. A., Vetterling, W. T., & Flannery, B. P. 2007, Numerical Recipes: The Art of Scientific Computing (3rd ed.; Cambridge University)
- Reid et al. (2009) Reid, M. J., Menten, K. M., Zheng, X. W., et al. 2009, ApJ, 700, 137
- Reid & Ho (1985) Reid, M. J., & Ho, P. T. P. 1985, ApJ, 288, L17
- Sánchez-Monge et al. (2011) Sánchez-Monge, Á., Pandian, J. D., & Kurtz, S. 2011, ApJ, 739, L9
- Sanna et al. (2010) Sanna, A., Moscadelli, L., Cesaroni, R., Tarchi, A., Furuya, R. S., & Goddi, C. 2010, A&A, 517, A78
- Sewilo et al. (2011) Sewilo, M., Churchwell, E., Kurtz, S., Goss, W. M., & Hofner, P. 2011, ApJS, 194, 44
- Sewilo et al. (2004) Sewilo, M., Watson, C., Araya, E., et al. 2004, ApJS, 154, 553
- Simpson et al. (2012) Simpson, J. P., Cotera, A. S., Burton, M. G., et al. 2012, MNRAS, 419, 211
- Smith et al. (2006) Smith, H. A., Hora, J. L., Marengo, M., & Pipher, J. L. 2006, ApJ, 645, 1264
- Takami et al. (2012) Takami, M., Chen, H.-H., Karr, J. L., et al. 2012, ApJ, 748, 8
- Takami et al. (2010) Takami, M., Karr, J. L., Koh, H., Chen, H.-H., & Lee, H.-T. 2010, ApJ, 720, 155
- Tamura et al. (2006) Tamura, M., Kandori, R., Kusakabe, N., et al. 2006, ApJ, 649, L29
- Urquhart et al. (2009) Urquhart, J. S., et al. 2009, A&A, 501, 539
- van der Tak & Menten (2005) van der Tak, F. F. S., & Menten, K. M. 2005, A&A, 437, 947
- Varricatt et al. (2010) Varricatt, W. P., Davis, C. J., Ramsay, S., & Todd, S. P. 2010, MNRAS, 404, 661
- Voronkov et al. (2006) Voronkov, M. A., Brooks, K. J., Sobolev, A. M., et al. 2006, MNRAS, 373, 411
- Walmsley (1995) Walmsley, M. 1995, RevMexAA Conference Series, 1, 137
- Walther et al. (1990) Walther, D. M., Aspin, C., & McLean, I. S. 1990, ApJ, 356, 544
- Zapata et al. (2006) Zapata, L. A., Rodríguez, L. F., Ho, P. T. P., Beuther, H., & Zhang, Q. 2006, AJ, 131, 939
- Zinnecker & Yorke (2007) Zinnecker, H., & Yorke, H. W. 2007, ARA&A, 45, 481


![[Uncaptioned image]](/html/1308.2167/assets/x43.png)
![[Uncaptioned image]](/html/1308.2167/assets/x44.png)
![[Uncaptioned image]](/html/1308.2167/assets/x45.png)
![[Uncaptioned image]](/html/1308.2167/assets/x46.png)
![[Uncaptioned image]](/html/1308.2167/assets/x47.png)
| Detection | ||||||
|---|---|---|---|---|---|---|
| EGO | D. | D. ref. | H2 | -band | -band | Note |
| (kpc) | (Y/N) | (Y/N) | (Y/N) | |||
| G11.110.11 | 3.6 | 1 | Y | Y | N | Two aligned H2 knots |
| G12.910.26 | 3.7 | 1 | Y | Y | Y | A bipolar H2 outflow. HC HII region |
| G14.330.64 | 2.5 | 1 | Y | N | N | Two H2 lobes and one H2 knot |
| G17.960.08 | 2.3 | 1 | Y? | Y | N | An H2 knot |
| G19.360.03 | 2.5 | 1 | Y? | Y | N | |
| G21.240.19 | 2.3 | 1 | Y | Y | Y | A bipolar H2 outflow |
| G22.040.22 | 3.7 | 1 | Y | N | N | A bipolar H2 outflow |
| G23.010.41 | 4.7 | 1 | N | N | N | HC HII region |
| G23.820.38 | 4.7 | 1 | Y | N | N | An H2 outflow |
| G23.960.11 | 4.5 | 2 | N | N | N | |
| G24.000.10 | 4.5 | 1 | N | N | N | |
| G24.110.17 | 4.9 | 1 | N | Y | Y | |
| G24.110.18 | … | - | Y? | Y | N | An H2 knot |
| G24.170.02 | … | - | N | N | N | |
| G24.330.14 | 5.9 | 3 | Y | N | N | An H2 outflow and knot, HII |
| G24.630.15 | 3.6 | 1 | Y? | Y | N | A faint H2 knot |
| G24.940.07 | 3.0 | 1 | N | N | N | HC HII region |
| G25.270.43 | 3.9 | 2 | N | N | N | |
| G25.380.15 | 5.4 | 1 | N | N | N | |
| G27.970.47 | … | - | Y | Y | N | A bipolar H2 outflow |
| G28.280.36 | 3.3 | 1 | N | N | N | HC HII region |
| G29.840.47 | … | - | N | N | N | |
| G29.890.77 | 5.0 | 1 | N | N | N | |
| G29.910.81 | 5.0 | 1 | N | N | N | |
| G29.960.79 | 5.1 | 1 | Y | Y | Y | An H2 outflow |
| G34.260.15 | 3.8 | 1 | Y? | Y | N | Several H2 knots. Two HC HII regions |
| G34.280.18 | 3.8 | 1 | N | Y | N | |
| G34.390.22 | 3.6 | 3 | Y | Y | N | An H2 lobe |
| G34.410.24 | 3.6 | 3 | N | N | N | |
| G35.030.35 | 3.5 | 1 | Y | Y | N | An H2 lobe. UC HII and HC HII regions |
| G37.480.10 | 3.8 | 1 | Y | Y | N | An H2 lobe |
| G37.550.20 | … | - | N | N | N | HC HII region |
| G39.100.49 | 1.7 | 1 | Y | Y | N | A bipolar H2 outflow |
| G39.390.14 | 4.5 | 1 | N | Y | N | HII region |
| G40.280.22 | 5.4 | 1 | Y | Y | Y | An H2 lobe |
| G40.280.27 | 5.2 | 1 | Y? | Y | N | An H2 knot |
| G40.600.72 | 4.6 | 1 | N | Y | Y | |
| G43.040.45(a) | 4.2 | 1 | N | N | N | |
| G43.040.45(b) | 4.2 | 1 | N | N | N | |
| G44.010.03 | 5.3 | 1 | N | N | N | |
| G45.470.05 | 5.0 | 1 | N | Y | Y | HII region |
| G45.470.13 | 5.2 | 1 | N | Y | Y | |
| G45.500.12 | 5.3 | 1 | N | N | N | |
| G45.800.36 | 4.6 | 3 | N | Y | N | |
| G48.660.30 | 2.7 | 1 | Y | N | N | A bipolar H2 outflow |
| G49.070.33 | 5.0 | 1 | N | Y | N | |
| G49.270.32 | 5.0 | 1 | N | N | N | |
| G49.270.34 | 5.0 | 1 | N | Y | N | UCHII region |
| G49.420.33 | 12.3 | 1 | Y | Y | N | A bipolar H2 outflow |
| G49.910.37 | 0.8 | 3 | N | N | N | |
| G50.360.42 | 3.2 | 3 | N | Y | N | |
| G53.920.07 | 4.6 | 1 | Y? | Y | Y | Extended H2 emission |
| G54.110.08 | 4.3 | 1 | Y? | Y | N | An H2 lobe or knot |
| G56.130.22 | … | - | N | N | N | |
| G57.610.02 | 4.5 | 3 | Y? | Y | N | H2 extended emission |
| G58.780.64 | 5.0 | 1 | Y? | Y | N | Three H2 knots |
| G58.780.65 | … | - | Y? | N | N | Three H2 knots |
| G58.790.63 | … | - | N | N | N | |
| G59.790.63 | 5.0 | 1 | Y | N | N | An H2 lobe |
| G62.700.51 | … | - | N | Y | Y | |
| MHO number | RA (J2000) | DEC (J2000) | Note |
|---|---|---|---|
| 2304 | 18 10 28.3 | -19 22 31 | An H2 lobe from EGO G11.11-0.11 |
| 2305 | 18 14 39.5 | -17 52 00 | A bipolar H2 outflow along the EW direction from EGO G12.91-0.26 |
| 2306 | 18 18 54.4 | -16 47 46 | Two H2 lobe around EGO G14.33-0.64 |
| 3258 | 18 35 08.1 | -07 35 04 | A bipolar H2 outflow from EGO G24.33+0.14 |
| 2458 | 18 48 50.0 | -03 00 21 | An H2 outflow from EGO G29.96-0.79 |
| 2459 | 18 53 19.0 | +01 24 08 | An H2 lobe from EGO G34.39+0.22 |
| 2460 | 18 54 00.5 | +02 01 18 | An H2 lobe from EGO G35.03+0.35 |
| 2461 | 19 00 07.0 | +03 59 53 | An H2 lobe from EGO G37.48-0.10 |
| 2462 | 19 00 58.1 | +05 42 44 | A bipolar H2 outflow from EGO G39.10+0.49 |
| 2463 | 19 05 41.3 | +06 26 13 | An H2 lobe from EGO G40.28-0.22 |
| 2464 | 19 20 59.1 | +14 46 53 | A bipolar H2 outflow from EGO G49.42+0.33 |
| 2465 | 19 21 48.0 | +13 49 21 | A bipolar H2 outflow from EGO G48.66-0.30 |
| 2624 | 19 25 31.5 | +15 15 50 | A bipolar H2 outflow near EGO G50.36-0.42 |
| 2625 | 19 41 03.1 | +24 01 15 | An H2 lobe from EGO G59.79+0.63 |
| EGO | reference |
|---|---|
| UC HII | |
| G12.200.03 | Urquhart et al. (2009) |
| G12.420.50 | Urquhart et al. (2009) |
| G24.330.14 | Battersby et al. (2010) |
| G35.030.35 | Cyganowski et al. (2011) |
| G39.390.14 | Hofner et al. (2011) |
| G45.470.05 | Urquhart et al. (2009) |
| G49.270.34 | Cyganowski et al. (2011) |
| HC HII | |
| G11.920.61 | Cyganowski et al. (2011) |
| G12.910.26 | van der Tak & Menten (2005) |
| G23.010.41 | Sanna et al. (2010) |
| G24.940.07 | Cyganowski et al. (2011) |
| G28.280.36 | Cyganowski et al. (2011) |
| G28.830.25 | Cyganowski et al. (2011) |
| G34.260.15 | Gaume et al. (1994); Sewilo et al. (2011) |
| G35.030.35 | Cyganowski et al. (2011) |
| G35.200.74 | Gibb et al. (2003); Beuther & Shepherd (2005) |
| G37.550.20 | Sánchez-Monge et al. (2011) |
| Thermal jet | |
| G16.590.05 | Zapata et al. (2006) |
| G19.880.53 | Zapata et al. (2006) |