NIR and optical observations of the failed outbursts of
black
hole binary XTE J1550564††thanks: Based on observations made with the
European Southern Observatory telescopes obtained from the
ESO/ST-ECF Science Archive Facility.
Abstract
Context. A number of low mass X-ray binaries (LMXBs) undergo “failed outbursts” in which, instead of evolving through the canonical states, they remain in a hard state throughout the outburst. While the sources of X-ray and radio emission in the hard state are relatively well understood, the origin of the near infrared (NIR) and optical emission is more complex though it likely stems from an amalgam of different emission processes, occurring as it does, at the intersecting wavelengths of those processes.
Aims. We aim to identify the NIR/optical emission region(s) during a number of failed outbursts of one such low mass X-ray binary and black hole candidate, XTE J1550564, in order to confirm or refute their classification as hard-state, failed outbursts.
Methods. We present unique NIR/optical images and spectra, obtained with the ESO–New Technology Telescope, during the failed outbursts of 2001 and 2000. We compare the NIR/optical photometric, timing, and spectral properties with those expected for the different emission mechanisms in the various LMXB states.
Results. The NIR/optical data are consistent with having come from reprocessing of X-rays in the accretion disk, with no evidence of direct thermal emission from the disk itself. However, the observed variability in high-cadence NIR light curves suggest that the radio jet extends and contributes to the NIR wavelengths.
Conclusions. We find that these failed outbursts did not transition to an intermediate state but remained in a true, hard state where there was no sign of jet quenching or deviation from the observed hard state correlations.
Key Words.:
X-rays: binaries – infrared: stars – X-rays: individuals: XTE J15505641 Introduction
For the majority of their lifetimes, transient low mass X-ray binaries (LMXBs) are in a state of quiescence with faint or non-detected X-ray emission. In quiescence, near infrared (NIR) and optical emission, if detected, is dominated by the main-sequence companion star (with possibly significant contribution from the cold accretion disk). During outburst – on time scales of weeks, months or even longer – there is a dramatic increase in the X-ray, NIR/optical, and radio flux, which is powered by an increased level of accretion onto the central, compact object (black hole or neutron star). Many of these sources are observed to undergo multiple, irregular outbursts (e.g., XTE J1550564 has displayed 5 outburst events in less than a decade) while others may remain in quiescence for decades after their initial discovery (e.g., V2107 Oph was detected in outburst in 1977 but has yet to repeat).
Black hole LMXB outbursts are usually divided into a number of states, based mainly on observable X-ray spectral and timing characteristics. The sources are initially observed in a, generally low intensity, hard state with spectra dominated by power-law emission. They then transition, via an intermediate state, to a soft or thermal-dominant state (so called because the spectrum is dominated by a thermal component). X-ray flux peaks in this state before decreasing and evolving, via a late hard state, back into a quiescent state. For a fuller description of the various possible states and the associated X-ray timing properties, etc., see McClintock & Remillard 2006. While the majority of outbursts from LMXBs follow this standard evolution of X-ray defined states, a number of sources are observed to return to quiescence without displaying a soft state (e.g., 9 sources in Brocksopp et al. 2004 and references therein) and another four have been observed to proceed to an intermediate state before returning to the hard state and quiescence, without reaching the soft state (Capitanio et al., 2009; Ferrigno et al., 2012; Soleri et al., 2013; Wijnands & Miller, 2002). Despite being referred to as “failed outbursts” (or “Soft X-ray transient” outbursts which are not soft; Brocksopp et al. 2004) these outbursts can in fact be quite luminous (e.g., V404 Cyg; Tanaka & Lewin 1995), though most are under-luminous.
While the origin of X-ray emission in the different states is relatively well understood (e.g., McClintock & Remillard 2006), that of the NIR, optical, and ultraviolet (UV) is more complex as the optical wavelengths are at the intersection of a number of different emission mechanisms (for reviews of optical properties of LMXBs see e.g., van Paradijs & McClintock 1995; Charles & Coe 2006). Both intrinsic, thermal emission from the hot, outer accretion disk (e.g., Shakura & Sunyaev 1973; Frank et al. 2002) as well as reprocessing of X-rays in the same region of the disk (e.g., Cunningham 1976; van Paradijs & McClintock 1994) may contribute significant levels of flux at UV, optical, and NIR wavelengths. Recently, evidence has been mounting that the relativistic jet, usually detected in radio, also produces a significant contribution to the NIR – and possibly optical – flux, at least in the hard state (e.g., Jain et al. 2001a; Corbel & Fender 2002; Russell et al. 2006; Chaty et al. 2011), and it is possible that the power law component of the X-ray emission extends to, and contributes at optical wavelengths.
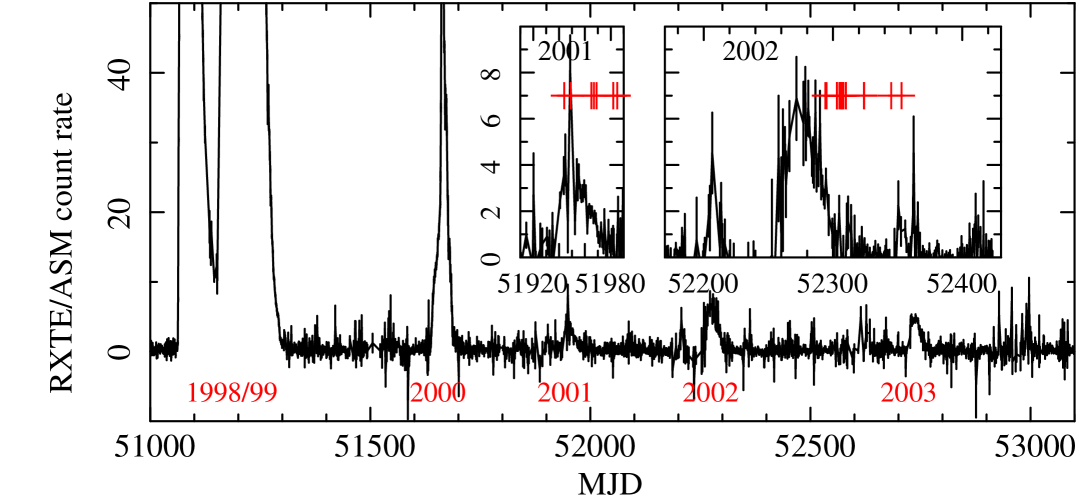
XTE J1550564 has undergone a number of weak, failed outbursts (in 2001 (Tomsick et al., 2001); 2002 (Belloni et al., 2002); and 2003 (Sturner & Shrader, 2005; Aref’ev et al., 2004)) as well as a number of complete (soft state) outbursts in 1998/99 (e.g., Sobczak et al. 2000) and 2000 (e.g., Jain et al. 2001a; see also figure 1). Even if these late time outbursts are considered as rebrightenings or reflarings of the original outburst, this source demonstrates conclusively that failed outbursts are not a separate class of object but are likely caused by differences in the accretion flow onto the black hole or by differences in the systems’ efficiency in converting the accreted matter into observable flux. In this paper we present the only significant NIR/optical observations during the failed outbursts of 2001 and 2002, obtained by the ESO NTT (Table 1), and comprising of all the available unpublished, archived ESO data of the source. In section 2 we introduce the observations and reduction methods, while in section 3 we present the results of our photometric, timing and spectral analyses of the data. We discuss the interpretation of our findings in section 4 and summarise in section 5.
2 Observations & Reduction
2.1 Photometry
| Night | MJD | Filters | Size() | ESO ID |
|---|---|---|---|---|
| February 2 2001 | 51943 | 66.C-0120 | ||
| February 7 2001 | 51948 | 59.A-9004 | ||
| 51948 | * | — | 59.A-9004 | |
| February 23 2001 | 51964 | 59.A-9907 | ||
| February 26 2001 | 51966 | * | — | 66.D-0199 |
| February 27 2001 | 51968 | 66.A-0617 | ||
| March 12 2001 | 51981 | 66.A-0162 | ||
| March 15 2001 | 51984 | 66.A-0162 | ||
| January 18 2002 | 52293 | s | 59.A-9004 | |
| January 19 2002 | 52294 | 59.A-9004 | ||
| January 27 2002 | 52302 | 68.D-0316 | ||
| 52302 | * | — | 68.D-0316 | |
| January 29 2002 | 52304 | 68.D-0316 | ||
| January 30 2002 | 52305 | * | — | 68.D-0316 |
| January 31 2002 | 52306 | 68.D-0316 | ||
| February 1 2002 | 52307 | * | — | 68.D-0316 |
| February 3 2002 | 52309 | 68.D-0316 | ||
| 52309 | * | — | 68.D-0316 | |
| February 17 2002 | 52323 | 68.D-0316 | ||
| March 10 2002 | 52344 | f | 68.D-5771 | |
| March 18 2002 | 52352 | f | 68.D-5771 |
-
Notes.* Spectra; All NIR data were obtained by SofI while optical data were obtained by EMMI unless otherwise noted as s (SUSI2) or f (FORS1).
During the outbursts of 2001 and 2002 optical () data were obtained with the ESO Multi-Mode Instrument (EMMI; Dekker et al. 1986) and the Superb-Seeing Imager (SuSI2) on the m ESO – New Technology Telescope (NTT), as well as with the FOcal Reducer and low dispersion Spectrograph (FORS1) on the m UNIT 3 of the Very Large Telescope (VLT-UT3) (Table 1). Furthermore, during the same period NIR () data were obtained with the Son of ISAAC (SofI) infrared spectrograph and imaging camera on the NTT. These data were reduced using the IRAF package wherein crosstalk correction, bias-subtraction, flatfielding, sky subtraction, bad pixel correction and frame addition were carried out as necessary. The dither pattern, necessary for sky subtraction, was not applied to some of the , and images obtained on MJD 52306 so those images underwent no further analysis.
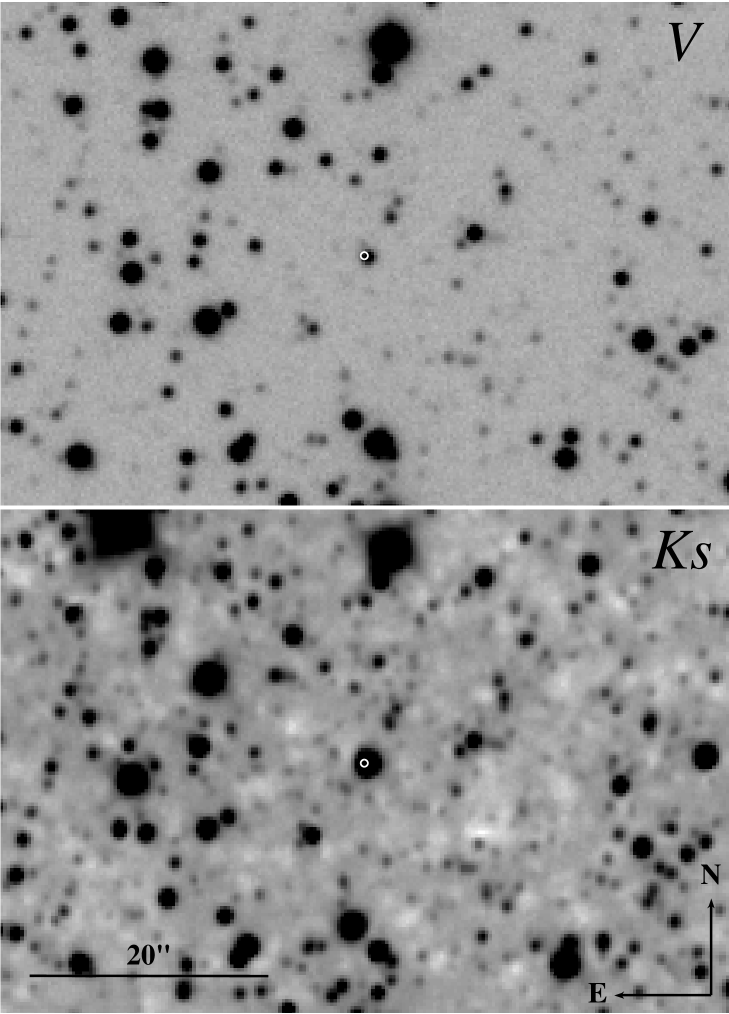
The images were astrometrically calibrated within the GAIA package, against the 2MASS (Skrutskie et al., 2006) or USNO-B1.0 (Monet et al., 2003) catalogues. The position of XTE J1550564 was derived via the point spread function (PSF) of the source in the deep (3240s) -band image on January 30 (MJD 52305; seeing ″) as 15:50:58.67 56:28:35.3, with a positional error111All uncertainties in this paper are given with a confidence of . dominated by the 0.1″ 2MASS systematic uncertainty (Figure 2). This is consistent with the radio position of Corbel et al. (2001) and the optical position of Jain et al. (1999).
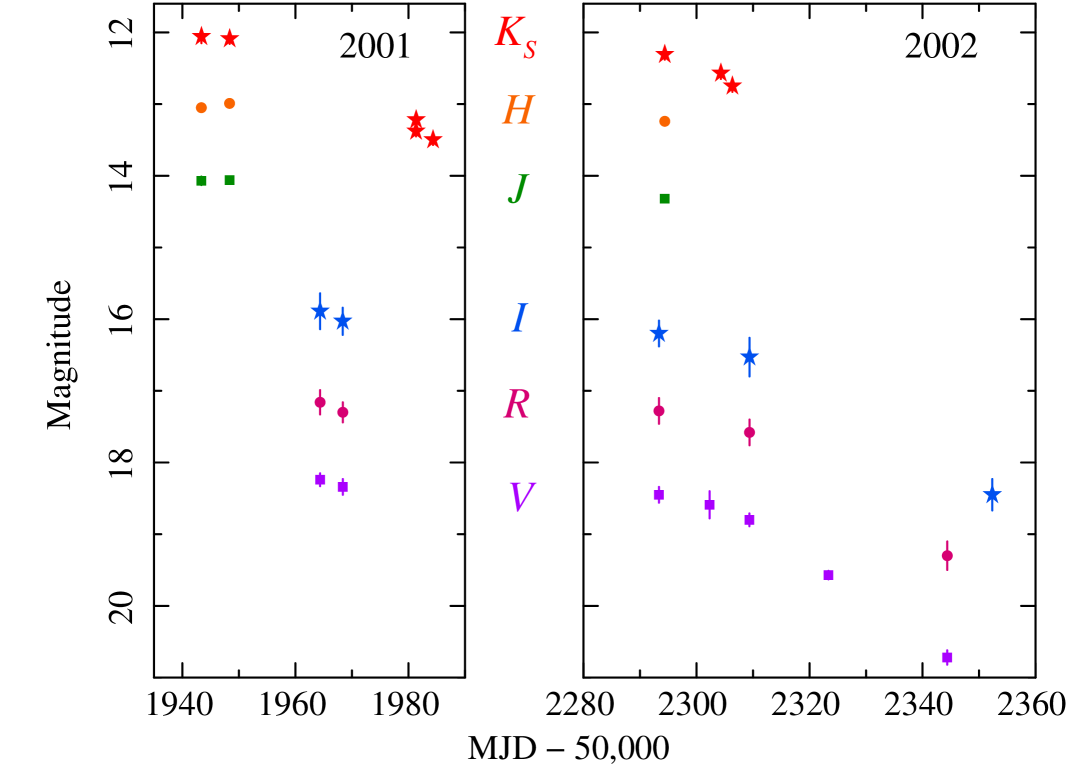
Relative PSF photometry was carried out on the final images using the DAOPHOT package (Stetson, 1987) within IRAF. The NIR and -band magnitudes (Table 2, Figure 3) were calibrated against the 2MASS and GSC 2.3 (Russell et al., 1990) catalogues using objects per image, after outliers and saturated objects were removed. - and -band magnitudes were calibrated against field stars observed by Jain et al. (2001b) and Sánchez-Fernández et al. (1999), noting that the published positions of the latter are incorrect and using the transformation, (Jordi et al., 2006). -band magnitudes were also estimated by this method, and were consistent with the GSC derived values. All derived magnitudes were comparable to magnitudes estimated via Persson et al. (1998) and Landolt (1992) photometric standards observed on some of the nights. Due to the small field of view () some -band images, only objects per image were available in these cases. The FORS1 images were heavily affected by saturation of catalogue sources in the field so magnitudes were derived from 10 relatively isolated field stars, which were in turn derived from the catalogues on nights less affected by saturation.
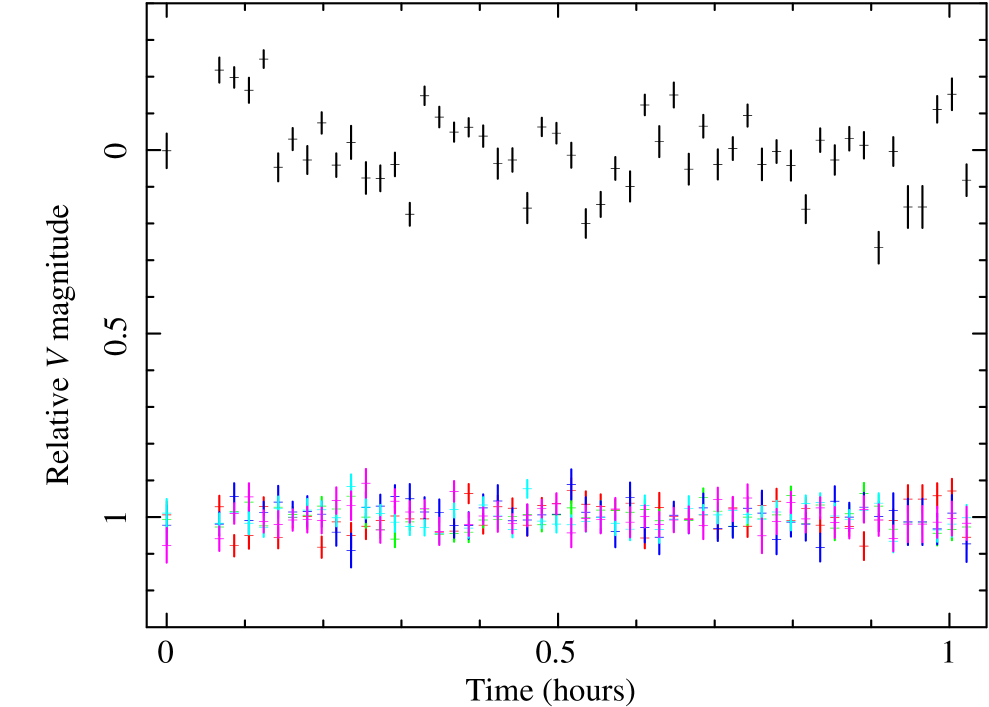
On a number of nights, data consisting of multiple () high-cadence, “fast” photometry, images in - and -band were obtained in order to investigate possible short-term variability of the source (see table 2). PSF photometry was carried out on each of these individual images, again using DAOPHOT. In each, the source magnitude was calculated relative to a number of field stars (12 in NIR and 10 in optical) and normalised so that the average is equal to zero. In addition, we also calculate (relative to the same field stars but normalised to a magnitude of one) the magnitudes of 5 comparison stars per band, of similar magnitude to XTE J1550564 (Table 3). The positions of those objects are derived via PSFs in the 530s -band image on MJD 52324 or the 3240s -band image on MJD 52305 (Figure 2; seeing of both ″) and are dominated by the 0.1″ 2MASS systematic uncertainty.
| MJD | Filter | N Exp (s) | Magnitude |
| 51964.36639 | 18.24 0.09 | ||
| 51968.39107 | 18.34 0.11 | ||
| 52293.35916 | 18.45 0.11 | ||
| 52302.31761 | 18.59 0.19 | ||
| 52309.36426 | 18.80 0.09 | ||
| 52323.35353 | 19.57 0.06 | ||
| 52344.37184 | 20.72 0.10 | ||
| 51964.37249 | 17.16 0.17 | ||
| 51968.38505 | 17.30 0.14 | ||
| 52293.36300 | 17.28 0.18 | ||
| 52309.37640 | 17.58 0.18 | ||
| 52344.38006 | 19.30 0.20 | ||
| 51964.37850 | 15.89 0.25 | ||
| 51968.37908 | 16.03 0.19 | ||
| 52293.36683 | 16.20 0.18 | ||
| 52309.38240 | 16.53 0.27 | ||
| 52352.34852 | 18.45 0.22 | ||
| 51943.35829 | 14.07 0.06 | ||
| 51948.35504 | 14.06 0.04 | ||
| 52294.37304 | 14.32 0.05 | ||
| 51943.37134 | 13.05 0.06 | ||
| 51948.36251 | 12.99 0.06 | ||
| 52294.37886 | 13.24 0.06 | ||
| 51943.37880 | 12.06 0.09 | ||
| 51948.37000 | 12.09 0.07 | ||
| 51981.34750 | 13.38 0.07 | ||
| 51981.35707 | 13.22 0.07 | ||
| 51984.34401 | 13.50 0.07 | ||
| 52294.38468 | 12.31 0.07 | ||
| 52304.31679 | 12.57 0.08 | ||
| 52306.34938 | 12.75 0.08 | ||
| 51948.385 | — | ||
| 51966.363 | — | ||
| 52302.290 | — | ||
| 52305.359 | — | ||
| 52305.385 | — | ||
| 52307.335 | — | ||
| 52307.358 | — | ||
| 52309.339 | — |
| Position | Magnitude | |
|---|---|---|
| 15:50:58.19 56:27:58.2 | 19.35 0.19 | |
| 15:51:00.28 56:29:03.0 | 18.89 0.19 | |
| 15:50:55.82 56:28:32.0 | 19.83 0.19 | |
| 15:50:56.72 56:29:15.8 | 19.03 0.19 | |
| 15:50:57.93 56:29:00.3 | 19.54 0.14 | |
| 15:50:58.41 56:28:11.3 | 12.595 0.038 | |
| 15:50:58.82 56:28:48.9 | 12.379 0.040 | |
| 15:50:55.25 56:28:34.7 | 12.969 0.035 | |
| 15:50:56.73 56:29:15.7 | 13.563 0.050 | |
| 15:50:57.56 56:29:12.1 | 12.721 0.033 |
-
Notes. -band magnitudes are derived as described in section 2, while magnitudes are extracted directly from the 2MASS catalogue.
2.2 Spectral Energy Distributions
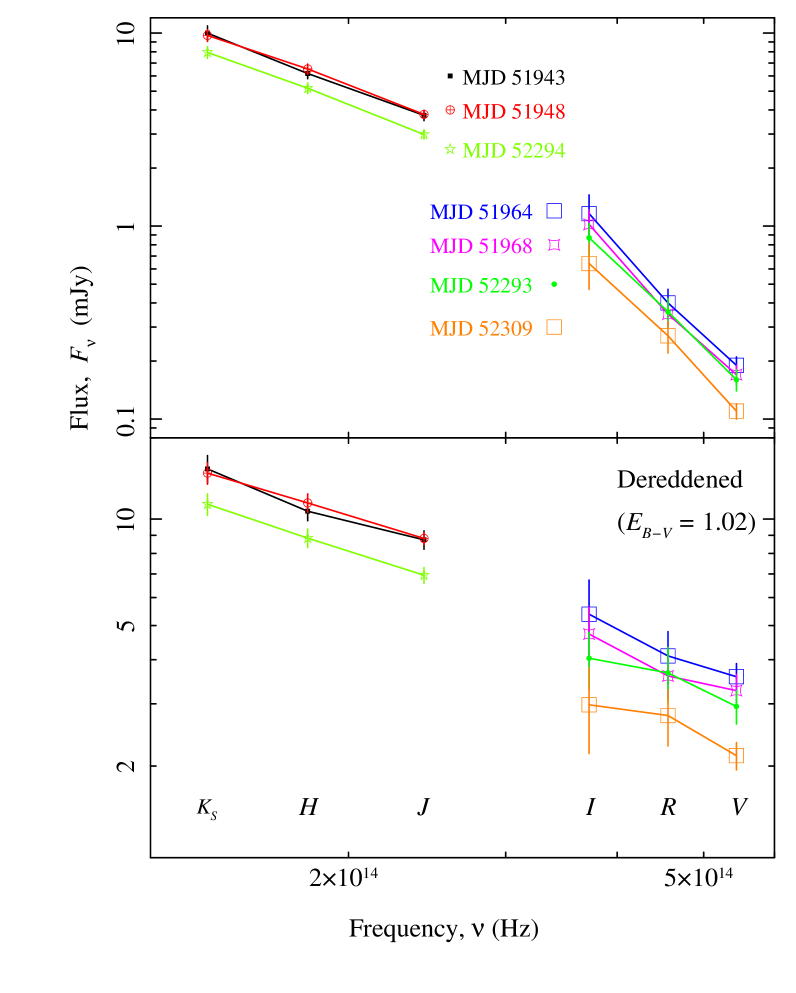
For the purposes of fitting, the observed magnitudes (Table 2) were converted to flux densities, , at frequency (Figure 4), and then to flux per filter, in units of photons cm-2 s-1. This is done via where and are the effective wavelength and full width at half maximum of the filter in question. XSPEC compatible files, for Spectral Energy Distribution (SED) fitting, were produced from the flux per filter value using the FTOOL, flx2xsp. Due to the time difference between epochs of observations, we treat each night separately except for the data taken on the adjoining nights of MJD 52293 and MJD 52294. Due to the time difference between the final I-band image (on MJD 52352) and the corresponding - and -band images (on MJD 52344) we do not consider these in our analysis, this results in 6 independent epochs (see table 4).
Our NIR/optical data were augmented with X-ray spectral data from the Rossi X-ray Timing Explorer (RXTE). Pre-processed Proportional Counter Array (PCA) and High Energy X-ray Timing Experiment (HEXTE; clusters 0 and 1) “Standard Product” spectra were downloaded from the HEASARC archive for each of the seven nights where we had simultaneous optical or NIR data. All RXTE spectra were observed within 0.1-1.0 days of our observations. PCA spectra were fit from 3-25 keV while HEXTE were fit from 25-150 keV. Unabsorbed X-ray fluxes, from 2-10 keV, (for comparison with correlations) were inferred from power-law fits to the spectra at each epoch (Table 4).
| MJD | |
|---|---|
| ergs cm-2s-1 | |
| 51942.730 | 7.1 |
| 51948.501 | 8.5 |
| 51964.309 | 6.4 |
| 51968.590 | 4.4 |
| 52293.447 | 7.8 |
| 52308.843 | 1.4 |
2.3 Spectroscopy
Spectral images were obtained on a number of nights (Tables 1, 2) with EMMI obtaining red (3,850–10,000 Å), low-dispersion spectra using Grism #1 () and SofI obtaining blue (; 9,500–16,400 Å) and red (; 15,300–25,200 Å) low resolution spectra. The data were reduced using the IRAF package wherein crosstalk correction, flatfielding, and bias subtraction were carried out as necessary. To correct for NIR sky, the dithered NIR exposures were summed to create sky images which were subtracted.
Spectra were reduced and extracted within the IRAF package, noao.twodspec, and individual exposures of the same spectra were summed. Due to the crowded nature of the field and a lack of acquisition frames on some nights we were only able to extract spectra for the nights of MJDs 52302, 52305, and 52307. On nights when they were available, wavelength calibrations were performed against helium + argon (optical) or xenon (NIR) lamps whose spectra were extracted using the same parameters as for the relevant source. The (wavelength dependent) resolution of the final spectrum is 7–10 Å, with a wavelength calibration error of Å (optical) or Å (NIR). Atmospheric, telluric features significantly affect the spectra and are corrected for by dividing the source spectrum by that of a telluric standard at a similar airmass, using the telluric tool within IRAF. This procedure often causes artefacts in the corrected spectra and in the case of the optical spectra, these artefacts are dominant so this procedure is not applied. Neither the optical nor the NIR spectra can be flux calibrated, due to a lack of standards, but they have been normalised.
No significant features which could not be associated to artefacts of the telluric correction are found in any of the extracted spectra. To increase the signal to noise, the NIR spectra from MJDs 52305 and 52307 (which exhibited consistent features) were summed but this did not exhibit any additional features.
3 Results
| MJD | Filter | STD | % RMS | dof | |
|---|---|---|---|---|---|
| 52302.31761 | 0.076 () | 8.7 () | 3.6 () | 80 | |
| 52323.35353 | 0.108 () | 6.7 3.6 () | 10.4 () | 52 | |
| 51981.34750 | 0.234 () | 17.8 5.3 () | 63.3 () | 323 | |
| 51984.34401 | 0.274 () | 20.8 6.6 () | 68.3 () | 323 | |
| 52304.31679 | 0.153 () | 10.0 4.6 () | 63.0 () | 323 | |
| 52306.34938 | 0.221 () | 16.4 5.3 () | 33.7 () | 242 |
-
Notes. The standard deviation of the magnitudes, STD, and the associated root mean square variability as percentage of the flux, %RMS, and the (and number of degrees of freedom, dof) of a constant fit to the data are given for the source (and, in brakets, for the worst case of the comparison sources, or the upper %RMS limit implied from the comparison sources).
3.1 High-cadence photometry
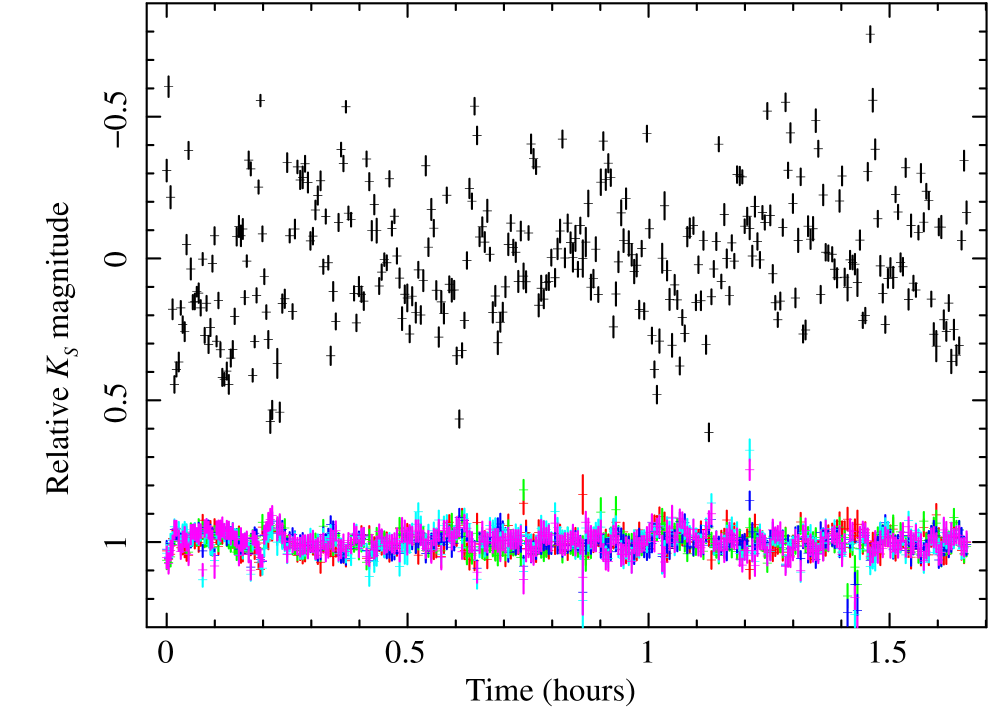
The high-cadence - and -band light curves of XTE J1550564 exhibit significant variability over the observations (see Figures 5 and 6 for examples on MJD 52323 and 51981, respectively), though this is much stronger in the NIR -band than the optical -band. In all four -band light curves, the of a constant fit to the data is inconsistent () with being acceptable and is significantly greater than the of a constant fit to the any of the five comparison objects of similar magnitude (Table 3), even in the worst case of poorest fit (Table 5). Likewise the scatter (standard deviation) of the magnitudes of the source are significantly greater than those of the comparison objects. For the two -band light curves, the scatter of the source and the comparisons are more comparable, at least on MJD 52303, but the of the constant fits to the source are again greater than those to the comparison objects and inconsistent with being an acceptable fit.
While the of the constant fits to the -band comparison objects are all consistent, at level, with those objects having constant magnitudes, the fits to the -band comparison stars are not consistent () with that assumption. PSF photometry, particularly in the NIR, is prone to underestimating the actual errors on magnitude. This is due to the difficulty of accurately modelling the PSF from sources in a crowded field (more likely in NIR observations) and due to the difficulty of obtaining a representative PSF from images where the width is not significantly greater than 1 pixel, as is the case here. Even if we normalise the of the source by that of the worst case comparison, we find that all the - and -band light curves are inconsistent with a constant magnitude, though this should only be used as an approximate guide.
If we use the maximum standard deviation of the comparison sources on each epoch as an estimate of the “background” noise we can calculate a corrected standard deviation of each source light curve and the root mean square variability of the light curve, as a percentage of flux (%RMS, Table 5). The error of the %RMS of the source is given as the %RMS of the background and the upper limit to the variability is given as 3 times the background level. The calculated %RMSs imply that neither of the -band light curves display significant variability, while in all but one case, the light curves display variability of . While this is in contrast to the analysis of the light curves, it is more robust as it is independent of any underestimate of the errors on individual points (assuming that any underestimate is similar for the source and for the comparison stars, which were chosen specifically to be of similar magnitude and hence, of a similar signal-to-noise ratio).
We used the IRAF task, pdm — an implementation of the phase dispersion minimisation method of Stellingwerf (1978) — to test if any of the variability of the light curves displayed a periodicity. However, all tests returned Stellingwerf statistics, for all periods less than twice the duration of the observations, implying no periodic variability.
3.2 Spectral Energy Distributions
In the following XSPEC fits, all 6 epochs of data are fit simultaneously, fixing the absorption (redden) and extinction (tbabs), as well as other parameters on a case by case basis, across all epochs.
Given that the observed quiescent magnitudes (Russell et al., 2011) or the limits placed on those magnitudes by the 2MASS catalogue are magnitudes dimmer than we observe, we assume that the companion star makes no significant impact on our observed spectra. The NIR/optical data alone are poorly constrained but consistent with a single reddened power law (), of different normalisations, of spectral index , and the extinction , but these parameters are highly degenerate and any values in the range for will give acceptable fits. When we include the X-ray data a single power law is no longer an acceptable fit, as the extrapolation of the NIR/optical spectral index underestimates the X-ray flux.
Previous studies of the X-ray spectra of the 2002 outburst (Belloni et al., 2002) show that the system is in a hard state with the spectra being well described by a power-law of spectral index in the range of to , without any thermal component. However, studies of other black hole sources (e.g., Miller et al. 2006; Rykoff et al. 2007; Reis et al. 2010; Reynolds & Miller 2013) show that, even in the hard state, X-ray spectra can be fit by an irradiated disk model that can also describe emission at optical energies. We find that this model (implemented in XSPEC as diskir; Gierliński et al. 2008, 2009) can well describe the broadband data from NIR to X-ray. However, due to the fact that the thermal component makes little contribution to the X-ray flux above 3 keV in this state, as demonstrated by the pure power law models of Belloni et al. (2002), the model is under-constrained and many of the parameters related to the disk component cannot be estimated with much certainty. It is also true that the column density is under-constrained due to the relative weakness of X-ray absorption over the observed energies so we instead adopt that measured from Chandra data (Tomsick et al., 2001; Miller et al., 2003). The extinction is set to the value of , which is derived from a fit to the only epoch (MJD 52293/4) that includes both NIR and optical data which may best constrain extinction. This is consistent with that implied, via the relationship of Güver & Özel (2009), from the X-ray absorption of this source.
The fits to the irradiated disk model are poorly constrained but return photon indices of the power law component, , and disk temperatures, keV, at all epochs. These values are in agreement with the photon indices derived for this source by Belloni et al. (2002) and the disk temperatures measured in the hard state of other LMXBs (e.g., Miller et al. 2006; Rykoff et al. 2007). The other parameters of the fit, even when fixed across epochs, are unconstrained but are in broad agreement with the underlying parameters of Gierliński et al. (2009). Given the poorly constrained nature of these spectra it is important to caution that the fit results should not be over interpreted, however we can state that the data are at least consistent with the irradiated disk model for a range of realistic, physical parameters and energies.
4 Discussion
X-ray observations of the 2001 and 2002 outbursts of XTE J1550564 (Tomsick et al., 2001; Belloni et al., 2002) suggest that the source was in a hard state only, with no reports of a transition to a soft or intermediate state. Defining the state of an LMXB from NIR/optical observations is not as straight forward as from the X-ray due to the multiple emission mechanisms – such as the accretion disk, radio jet, corona, reprocessing (see section 1) – that contribute at those wavelengths. However, variability, which is attributed to the non-thermal emission of the jet or corona, has been observed in the hard state, at least at NIR wavelengths (e.g., Casella et al. 2010; Chaty et al. 2011). In the past decade, a number of correlations have also been suggested that indicate which state the system is in without the need to know exactly which emission mechanism is contributing to the fluxes. This method uses the observed correlations between the X-ray luminosities and the NIR/optical (Russell et al., 2006) or radio (e.g., Corbel et al. 2000, 2003; Gallo et al. 2003; Fender et al. 2010; Coriat et al. 2011) luminosities in different states to imply which state the system is in.
Our detections of short term variability in the high-cadence -band light curves of and non-detections in the -band is consistent with the variabilities implied during the failed 2003 outburst of this source (Chaty et al., 2011). In that outburst, over a similar range of frequencies to ours ( Hz), -band variability was detected at a level of in contrast to a -band upper limit of . These imply that the radio jet, or perhaps the high-energy corona, are making a significant contribution to the NIR flux. Compact radio jets are only observed in the hard state and while the corona can contribute in the soft state, it is usually weak, so any significant emission that can be associated with either implies that the source is in a hard state. Radio emission, consistent with optically thick emission from a compact jet, was observed from this source during the 2002 outburst (Corbel et al., 2002) and, given its flux of 2.5 mJy and spectral index of , it is plausible that it contributed to the NIR flux. Unfortunately, while further radio observations of this source have been obtained with the same instrument during the 2001, 2002, and 2003 outbursts, they have yet to be published and it is beyond the scope of this paper to do so. Assuming that the observed variability is due to the radio jet implies that the jet’s spectral break frequency is at NIR wavelengths – a result consistent with the previously implied break frequencies, both for this source in full outburst, and other LMXB systems (Russell et al., 2013).
The featureless spectra indicate that there is little direct emission from the accretion disk which would be expected in the soft state. While our SEDs are not well constrained, they are consistent (see section 3.2) with the flux being due to reprocessing of X-rays in a relatively cool ( keV) accretion disk, as expected in the hard state ( e.g., Miller et al. 2006; Rykoff et al. 2007; a much higher disk temperature of keV is expected in the soft state, e.g., Sobczak et al. 2000). The absolute -band magnitudes at the various epochs (, assuming a distance of kpc; Jonker & Nelemans 2004) are also consistent with observed correlation with (van Paradijs & McClintock, 1994; Deutsch et al., 2000) if we use the observed period, days (Jain et al., 2001b), and an estimated mass of (Orosz et al., 2002; Muñoz-Darias et al., 2008). This agreement of the observed magnitudes with this relationship is also consistent with those magnitudes being due to reprocessing.
Comparing our derived NIR/optical and X-ray luminosities (along with those from the failed 2003 outburst; Aref’ev et al. 2004; Chaty et al. 2011) with the observed values for other LMXBs (Russell et al., 2006) we find no significant deviation from the hard state correlation. It has been shown (Curran et al., 2012) that sources deviate from this correlation early in the intermediate state so this agreement adds further weight to the suggestion that the system was in the hard state at the time of the optical observations. During the 2001 outburst, our observations span most of the X-ray activity (see figure 1) without displaying any evidence of reaching a hard or intermediate state. Observations of the 2002 outburst and the single epoch of observations in the 2003 outburst (Chaty et al., 2011) were obtained only after the X-ray flux had already peaked and hence we cannot rule out that a transition to an intermediate state occurred; however, if a soft or intermediate state was reached, the transition back to the hard state would not be expected until late times when the accretion rate had dropped significantly.
5 Conclusions
The NIR/optical data of the black hole LMXB system, XTE J1550564, while being consistent with having originated from reprocessing of X-rays in the accretion disk, display variability indicative of a contribution from the radio jet at NIR wavelengths. Hence, the NIR/optical likely combines both emission from the jet and reprocessing. The contribution of the radio jet at such high frequencies is consistent with both previous observations of this source in full outburst and other LMXB systems (Russell et al., 2013), and supports the hard state classification of the system at the time of observations. A comparison of the NIR/optical and X-ray luminosities with those of other LMXBs displays no deviation from the observed hard state correlations (Russell et al., 2006). This suggests that the failed outbursts of 2001, 2002, and 2003 did not transition to an intermediate state, or display signs of jet quenching, but remained in a true, hard state throughout the outburst. Failed outbursts seem only to differ from standard outbursts by their failure to quench the radio jet and reach accretion disk dominated emission and not in their underlying, time-independent, physical structure. Studying them at multiple wavelengths – to constrain physical parameters, such as the frequency of the jet break, the accretion disk temperature and radius – is required to reveal how jet suppression and reactivation relates to accretion parameters in both failed and successful outbursts of LMXBs.
Acknowledgements.
We thank the anonymous referee for their useful comments. This work was supported by the Australian Research Council’s Discovery Projects funding scheme (project number DP120102393) and by the Centre National d’Etudes Spatiales (CNES). This work is based on observations obtained with MINE: the Multi-wavelength INTEGRAL NEtwork. This research has made use of NASA’s Astrophysics Data System, the SIMBAD database, operated at CDS, Strasbourg, France and quick-look results provided by the ASM/RXTE team.References
- Aref’ev et al. (2004) Aref’ev V. A., Revnivtsev M. G., Lutovinov A. A., Sunyaev R. A., 2004, Astronomy Letters, 30, 669
- Belloni et al. (2002) Belloni T., Colombo A. P., Homan J., Campana S., van der Klis M., 2002, A&A, 390, 199
- Brocksopp et al. (2004) Brocksopp C., Bandyopadhyay R. M., Fender R. P., 2004, New A, 9, 249
- Capitanio et al. (2009) Capitanio F., Belloni T., Del Santo M., Ubertini P., 2009, MNRAS, 398, 1194
- Cardelli et al. (1989) Cardelli J. A., Clayton G. C., Mathis J. S., 1989, ApJ, 345, 245
- Casella et al. (2010) Casella P., Maccarone T. J., O’Brien K., et al., 2010, MNRAS, 404, L21
- Charles & Coe (2006) Charles P. A., Coe M. J., 2006, Lewin M., W. H. G. & van der Klis (ed.), Optical, ultraviolet and infrared observations of X-ray binaries. p. 215
- Chaty et al. (2011) Chaty S., Dubus G., Raichoor A., 2011, A&A, 529, A3
- Corbel et al. (2002) Corbel S., Fender R., Tzioumis A., 2002, IAU Circ., 7795, 2
- Corbel & Fender (2002) Corbel S., Fender R. P., 2002, ApJ, 573, L35
- Corbel et al. (2000) Corbel S., Fender R. P., Tzioumis A. K., et al., 2000, A&A, 359, 251
- Corbel et al. (2001) Corbel S., Kaaret P., Jain R. K., et al., 2001, ApJ, 554, 43
- Corbel et al. (2003) Corbel S., Nowak M. A., Fender R. P., Tzioumis A. K., Markoff S., 2003, A&A, 400, 1007
- Coriat et al. (2011) Coriat M., Corbel S., Prat L., et al., 2011, MNRAS, 414, 677
- Cunningham (1976) Cunningham C., 1976, ApJ, 208, 534
- Curran et al. (2012) Curran P. A., Chaty S., Zurita Heras J. A., 2012, A&A, 547, A41
- Dekker et al. (1986) Dekker H., Delabre B., Dodorico S., 1986, ESO’s Multimode Instrument for the Nasmyth focus of the 3.5 M New Technology Telescope, in Society of Photo-Optical Instrumentation Engineers (SPIE) Conference Series, Vol. 627, D. L. Crawford (ed.), Society of Photo-Optical Instrumentation Engineers (SPIE) Conference Series, p. 339
- Deutsch et al. (2000) Deutsch E. W., Margon B., Anderson S. F., 2000, ApJ, 530, L21
- Fender et al. (2010) Fender R. P., Gallo E., Russell D., 2010, MNRAS, 406, 1425
- Ferrigno et al. (2012) Ferrigno C., Bozzo E., Del Santo M., Capitanio F., 2012, A&A, 537, L7
- Frank et al. (2002) Frank J., King A., Raine D. J., 2002, Frank, J., King, A., & Raine, D. J. (ed.), Accretion Power in Astrophysics: Third Edition
- Gallo et al. (2003) Gallo E., Fender R. P., Pooley G. G., 2003, MNRAS, 344, 60
- Gierliński et al. (2008) Gierliński M., Done C., Page K., 2008, MNRAS, 388, 753
- Gierliński et al. (2009) Gierliński M., Done C., Page K., 2009, MNRAS, 392, 1106
- Güver & Özel (2009) Güver T., Özel F., 2009, MNRAS, 400, 2050
- Jain et al. (2001a) Jain R. K., Bailyn C. D., Orosz J. A., McClintock J. E., Remillard R. A., 2001a, ApJ, 554, L181
- Jain et al. (2001b) Jain R. K., Bailyn C. D., Orosz J. A., et al., 2001b, ApJ, 546, 1086
- Jain et al. (1999) Jain R. K., Bailyn C. D., Orosz J. A., Remillard R. A., McClintock J. E., 1999, ApJ, 517, L131
- Jonker & Nelemans (2004) Jonker P. G., Nelemans G., 2004, MNRAS, 354, 355
- Jordi et al. (2006) Jordi K., Grebel E. K., Ammon K., 2006, A&A, 460, 339
- Landolt (1992) Landolt A. U., 1992, AJ, 104, 340
- McClintock & Remillard (2006) McClintock J. E., Remillard R. A., 2006, Lewin M., W. H. G. & van der Klis (ed.), Black hole binaries. p. 157
- Miller et al. (2006) Miller J. M., Homan J., Miniutti G., 2006, ApJ, 652, L113
- Miller et al. (2003) Miller J. M., Marshall H. L., Wijnands R., et al., 2003, MNRAS, 338, 7
- Monet et al. (2003) Monet D. G., Levine S. E., Canzian B., et al., 2003, AJ, 125, 984
- Muñoz-Darias et al. (2008) Muñoz-Darias T., Casares J., Martínez-Pais I. G., 2008, MNRAS, 385, 2205
- Orosz et al. (2002) Orosz J. A., Groot P. J., van der Klis M., et al., 2002, ApJ, 568, 845
- Persson et al. (1998) Persson S. E., Murphy D. C., Krzeminski W., Roth M., Rieke M. J., 1998, AJ, 116, 2475
- Reis et al. (2010) Reis R. C., Fabian A. C., Miller J. M., 2010, MNRAS, 402, 836
- Reynolds & Miller (2013) Reynolds M. T., Miller J. M., 2013, ApJ, 769, 16
- Russell et al. (2006) Russell D. M., Fender R. P., Hynes R. I., et al., 2006, MNRAS, 371, 1334
- Russell et al. (2011) Russell D. M., Maitra D., Dunn R. J. H., Fender R. P., 2011, MNRAS, 416, 2311
- Russell et al. (2013) Russell D. M., Markoff S., Casella P., et al., 2013, MNRAS, 429, 815
- Russell et al. (1990) Russell J. L., Lasker B. M., McLean B. J., Sturch C. R., Jenkner H., 1990, AJ, 99, 2059
- Rykoff et al. (2007) Rykoff E. S., Miller J. M., Steeghs D., Torres M. A. P., 2007, ApJ, 666, 1129
- Sánchez-Fernández et al. (1999) Sánchez-Fernández C., Castro-Tirado A. J., Duerbeck H. W., et al., 1999, A&A, 348, L9
- Shakura & Sunyaev (1973) Shakura N. I., Sunyaev R. A., 1973, A&A, 24, 337
- Skrutskie et al. (2006) Skrutskie M. F., Cutri R. M., Stiening R., et al., 2006, AJ, 131, 1163
- Sobczak et al. (2000) Sobczak G. J., McClintock J. E., Remillard R. A., et al., 2000, ApJ, 544, 993
- Soleri et al. (2013) Soleri P., Muñoz-Darias T., Motta S., et al., 2013, MNRAS, 429, 1244
- Stellingwerf (1978) Stellingwerf R. F., 1978, ApJ, 224, 953
- Stetson (1987) Stetson P. B., 1987, PASP, 99, 191
- Sturner & Shrader (2005) Sturner S. J., Shrader C. R., 2005, ApJ, 625, 923
- Tanaka & Lewin (1995) Tanaka Y., Lewin W. H. G., 1995, X-ray Binaries, 126
- Tomsick et al. (2001) Tomsick J. A., Corbel S., Kaaret P., 2001, ApJ, 563, 229
- Tomsick et al. (2001) Tomsick J. A., Smith E., Swank J., Wijnands R., Homan J., 2001, IAU Circ., 7575, 2
- van Paradijs & McClintock (1994) van Paradijs J., McClintock J. E., 1994, A&A, 290, 133
- van Paradijs & McClintock (1995) van Paradijs J., McClintock J. E., 1995, Optical and ultraviolet observations of X-ray binaries., in W. H. G. Lewin, J. van Paradijs, & E. P. J. van den Heuvel (ed.), X-ray Binaries, p. 58
- Wijnands & Miller (2002) Wijnands R., Miller J. M., 2002, ApJ, 564, 974