Ultrabroadband direct detection of nonclassical photon statistics at telecom wavelength
Abstract
Broadband light sources play essential roles in diverse fields, such as high-capacity optical communications, optical coherence tomography, optical spectroscopy, and spectrograph calibration. Though an ultrabroadband nonclassical state from standard spontaneous parametric down-conversion may serve as a quantum counterpart, its detection and quantum characterization have been a challenging task. Here we demonstrate the quantitative characterization of a multimode structure in such an ultrabroadband (150 nm FWHM) squeezed state at telecom wavelength (1.5 m). The nonclassical photon distribution of our highly multimode state is directly observed using a superconducting transition-edge sensor. From the observed photon correlation functions, we show that several tens of different squeezers are coexisting in the same spatial mode. We anticipate our results and technique open up a new possibility to generate and characterize nonclassical light sources for a large-scale optical quantum network in the frequency domain.
Generating and characterizing nonclassical light fields, are indispensable prerequisites for optical quantum information processing (QIP) KLM01 ; O'Brien09 ; Weedbrook12 . Spontaneous parametric down-conversion (SPDC) in a nonlinear crystal is an established source of nonclassical light field, such as entangled photons or squeezed states MWbook95 ; GKbook05 . Moreover, SPDC can easily generate extremely broadband nonclassical states Okano12 . Although frequencies in such an ultrabroadband state are strongly entangled KR97 ; Grice01 , the state can be decomposed into separable broadband modes under certain assumptions ZC90 ; Law00 ; Sasaki_Suzuki_PRA73_2006 ; Rohde07 . The decomposed multimode state may consist of more than hundreds of broadband modes that is potentially useful for future high-capacity quantum communication network or large-scale quantum information processing.
Toward utilizing the full potential of the ultrabroadband multimode nonclassical light, the first challenge to be overcome is to characterize the nonclassical properties of such a huge quantum system. Though in principle one can fully reconstruct an -mode optical state by the homodyne tomography Breitenbach97 ; Lvovsky09 , it appears not only technically challenging but extremely time-consuming simply because one has to prepare different measurements with different appropriate local oscillators (LOs) for highly multimode states, especially when is large e.g. . So far, multimode analyses under reasonable assumptions have theoretically revealed that the ultrabroadband nonclassical light from SPDC may consist of a multimode squeezed state U'Ren_JSD_thermal_dist_03 ; Christ11 . Nevertheless, the quantitative evaluation of such a huge multimode squeezed state has not been experimentally investigated to date even with the use of any assumptions.
In this paper, we demonstrate the quantum characterization of the ultrabroadband optical state from SPDC at telecom wavelength (centered at m, with an estimated bandwidth of 150 nm) by an alternative very simple approach, an ultrabroadband photon-number-resolving detection (PNRD). We characterize the nonclassical property by the following two observations: First, we directly observe the nonclassical photon statistics of a whole multimode state violating the Klyshko’s criterion Klyshko_original_96 ; Waks06 . Second, by using the method in Christ11 , we demonstrate that our source contains several tens of independent squeezed vacua in the broadband mode basis and determine the degree of squeezing in each mode. These are observed by simply detecting photon-numbers of the whole pulse.
Our study is motivated by several related works. The direct observation of the nonclassical photon statistics of the SPDC source was demonstrated with a visible light photon counter (VLPC) Waks04 ; Waks06 but only at the visible wavelength. The relation between the nonclassical photon statistics and the frequency or spatial multimode structure in the SPDC sources was successfully observed in Avenhaus08 ; Mauerer09 , which could be useful to characterize the multimode squeezed states from SPDC Christ11 ; Goldschmidt13 . In Avenhaus08 ; Mauerer09 ; Goldschmidt13 , multiple avalanche photodiodes (APDs) were used as a PNRD. However, the APD-based PNRD is not suitable for our purpose since its detection efficiency (DE) and the number of countable photons is severely limited.
Here we use a superconducting transition-edge sensor (TES) as an ultrabroadband PNRD. TES has the number resolution at higher photon numbers with DE close to 100 % and the sensitivity in an extremely wide spectral range including all the important optical wavelengths Lita08 ; Fukuda09 ; Fukuda11 ; Gerrits11_OnChipTES . It thus overcomes all technical obstacles to detect ultrabroadband quantum states. Specifically, with an adequate optical coating Fukuda09 , our TES covers the S-, C-, and L-band at telecom wavelength.
Unlike the tomographic approach,
our method does not allow to reconstruct
full information of quantum state.
However, it drastically reduces the number of measurement
(just measuring photon numbers) and still captures
nontrivial quantum property of the state.
We anticipate our results and techniques open up a new way to
fully use nonclassical resources in the frequency domain
Menicucci08 ; Pysher11 ; Pinel12 .
Our light source is a single-beam squeezer in a collinear configuration where the pump, signal, and idler beams are in the same spatiotemporal and polarization mode. The generation process is mathematically described by the following unitary transformation Christ11 ; Lvovsky_Wasilewski_Banaszek2007JMO_Decomposing_OPA_Mode
| (1) | |||||
Here denotes the overall efficiency of the squeezing, is the joint-spectral distribution (JSD) in terms of the signal and idler angular frequencies, and , and () represents the creation operator of the signal (idler) field in the continuous spectrum of (). These continuous modes are, however, not necessarily a convenient representation to deal with the multimode characteristics, because they cannot be decoupled from each other for most of practical JSDs. For a JSD which distributes in an effectively finite range, one can find a more convenient discrete set of decoupled modes ZC90 ; Sasaki_Suzuki_PRA73_2006 .
In fact, when the JSD is engineered to be symmetric, which is the case here, it can then be decomposed into the following form
| (2) |
in terms of a complete orthonormal set Christ11 . Note, this mode corresponds to the shape of the frequency distribution for signal and idler. Here is a modal amplitude corresponding to a squeezing parameter for mode . Introducing the field operators for the broadband basis modes Rohde07 ,
| (3) |
the above transformation can be expressed as
| (4) |
The generated state is a multimode squeezed vacuum state as
| (5) |
Thus this state only includes even number of photons. In practice, however, inevitable losses in the generation, propagation, and detection processes cause the vacuum invasion, making the pure state a mixed one, whose statistics has odd number components as well. If losses are below a certain level, one can still observe even-rich photon-number statistics. Direct observation of this even-odd number oscillation and multimode analysis on the distribution of are our tasks here.
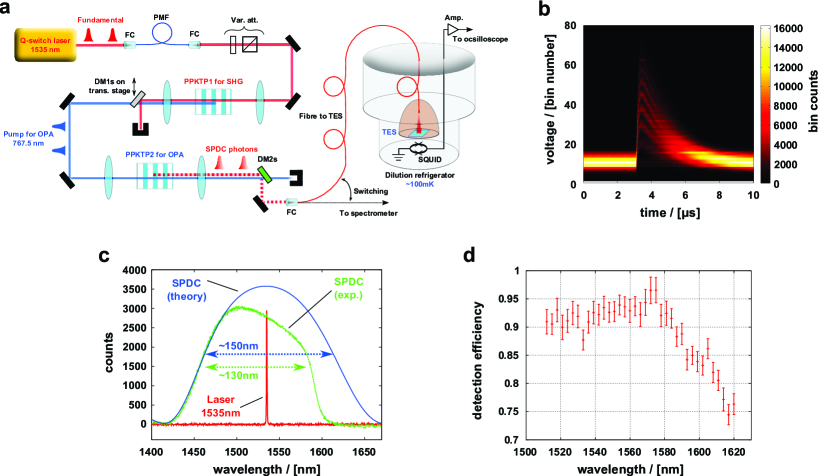
Figure 1a shows the experimental setup. The fundamental light source is a single-longitudinal-mode, passively Q-switched, diode-pumped solid-state laser (Cobolt, Tango), operating at 1535 nm with a pulse width of 4 ns and a repetition rate of 3.1 kHz. This is used as the fundamental light, and is injected into a 10 mm long, periodically poled KTiOPO4 (PPKTP) crystal for second harmonic generation (SHG) at 767.5 nm. This second harmonic light is then used as a pump for squeezing. An unconverted fundamental light after SHG is used as a guiding beam for fiber-coupling to TES, but effectively eliminated by dichroic mirrors when photon counting experiment is implemented. The pump is guided into the second type-0 PPKTP crystal employed as the squeezer. The PPKTP crystals for SHG and the squeezer are mounted on copper stages and temperature-stabilized. The multimode squeezed vacuum state is fiber-coupled and guided to the TES or to a spectrometer. Output waveform from the TES is amplified by a SQUID device and room-temperature electronics (Magnicon). Each waveform was sampled using a digital oscilloscope (DPO7104, Tektronix), and sent to a host computer for noise filtering and data analysis.
Figure 1b shows raw waveforms from the TES. Total waveforms are stored and overlaid here. The red line in Fig. 1c is a spectrum of the fundamental light, whose linewidth is 0.05 nm. The green dotted line is a spectrum of the SPDC measured with the spectrometer (Acton) for a 30 sec accumulation time. Measured full-width at half maximum (FWHM) is roughly 130 nm. The blue line is a theoretically derived spectrum using the present experimental parameters (see Appendix C), which is symmetric about the fundamental light spectrum. The asymmetry seen in the measured spectrum (green dotted line) is an artifact caused by the DE fall-off of an InGaAs photo detector in the spectrometer. Actually the spectrometer DE gradually drops when the wavelength exceeds 1500 nm. Then the DE starts steeply falling at around 1580 nm and reaches almost 0% at around 1650 nm. The blue theoretical spectrum captures the actual SPDC spectrum whose FWHM extends over almost 150 nm in the telecom window, covering the S-, C-, and L-band.
The wavelength dependence of our TES’s DE is shown
in Fig. 1d (also see Appendix A).
It is almost flat from 1512 nm to 1580 nm,
then gradually drops from 1580 nm to 1620 nm.
The absolute DE is at 1535 nm.
Unfortunately,
we were not able to measure DE at wavelengths
shorter than 1510 nm nor longer than 1620 nm,
because of a limited wavelength range of the probe light.
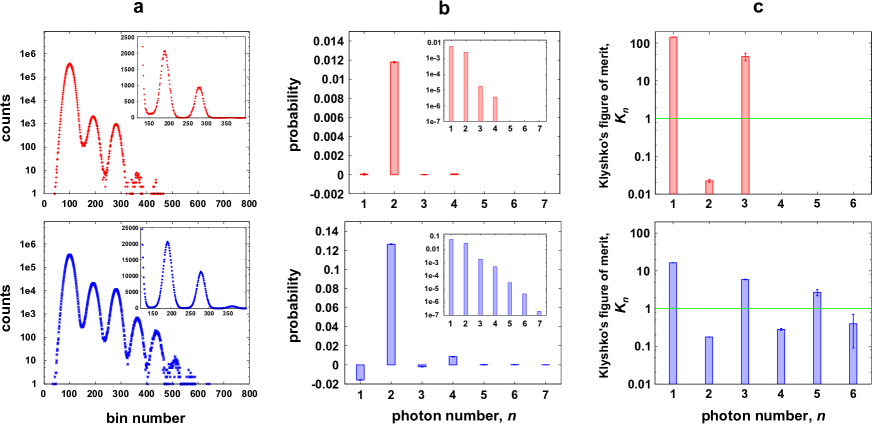
Figure 2 shows the experimental results for the multimode squeezed states. The red (blue) histograms correspond to a weak (strong) pumping condition in common. We used a pump pulse energy of 1 pJ (10 pJ) in the weak (strong) condition. Figure 2a shows the pulse height distribution of TES output waveforms. The total number of events was for each data set. The vertical axes in the main graphs are numbers of counts shown in log scale, while those in the insets are in linear scale. Every peak in each distribution was clearly separated, and was fitted with a Gaussian function in order to determine thresholds for calculating photon-number probabilities. The FWHM of the each Gaussian peak corresponds to an energy resolution and was calculated to be about 0.2 eV, compared with a photon energy (0.8 eV) of the monochromatic fundamental light at 1535 nm.
Figure 2b insets show the photon-probability distributions obtained from the pulse height distributions without any correction of losses. In each condition, the results clearly show super-Poissonian distribution, whose feature could be confirmed by the Fano factors, which are greater than the unity, yielding (red) and (blue), as well as by values, (red) and (blue). In the weak pumping condition, two-photon generation is dominant in the squeezed vacuum state. Then, the overall DE including the fiber-coupling efficiency can be evaluated by comparing the single and the two-photon probabilities, according to the formula, Waks04 . The overall DE was thus estimated to be .
The main graphs in Fig. 2b are reconstructed photon number statistics after compensating the loss using the relation , where and denote ideal (lossless case) and experimentally measured photon-number probabilities, respectively Waks04 . Dark counts were negligible compared to the average photon-number of measured photon statistics. is a cutoff photon-number chosen to be large enough in order to prevent conversion errors by truncating higher photon-numbers. We chose here. The reconstructed statistics in red (upper panel) in the weak pumping condition only contains the two-photon component. On the other hand, the statistics in blue (lower panel) in the strong pumping condition contains the four-photon component apparently. Thus they exhibit even-rich photon-number statistics due to the pairwise photon generation of squeezing. Negative values appeared in single- and three-photon components in the lower panel (in blue histogram) may be due to several reasons including (1) conversion errors as stated in the ref. Waks04 ; Achilles03 , (2) slight degradation of in the strong pumping condition from that determined in the weak pumping one, because the spatial-mode shift of the squeezed state would occur due to the strong pump and thus would reduce the coupling efficiency into the optical fiber to the TES. Further analysis is left open.
We also evaluated the nonclassicality
using Klyshko’s criterion:
( Klyshko_original_96 ; Waks06 .
In Fig. 2c,
the classical limit (green horizontal line)
is clearly violated for even-photon numbers
(2, 4, and 6),
while all the odd-photon numbers do not violate the limit.
Ideally,
squeezed source consists of even-photon numbers
and therefore all the for odd numbers must go infinite.
There were in practice some contributions of odd-photon numbers
caused by the finite DE,
resulting in the finite values for odd photon-numbers.
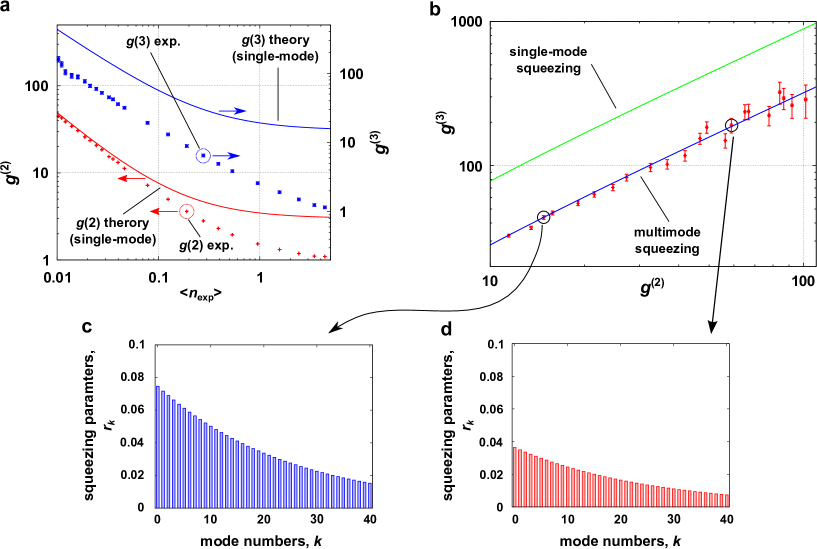
Using the above PNRD data, we evaluate and values and analyze multimode structures of our squeezer by applying the method in Christ11 . Figure 3a shows experimental and values calculated from the photon number statistics using mth factorial moment given by
| (6) |
where and BR97 . The red and blue solid lines are theoretical plots for the single-mode squeezing given by
| (7) |
Because is a loss-tolerant measure, we use in order to compare the experimental and values to the theory. There are clear deviations between the experimental and the theoretical values both for and . Note, values fitted well to the single-mode theory was reported in the ref. Gerrits11_SQZ .
In the multimode case assuming a two-dimensional (2D) Gaussian JSD , mode weight distribution is thermal U'Ren_JSD_thermal_dist_03 . Then and can be expressed as follows Christ11 (also see Appendix B),
| (8) | ||||
| (9) |
with and , where is an optical gain coefficient defined by with the normalized mode weight (). The single parameter determines the thermal mode distribution as . The slope of -vs- can thus be defined as
| (10) |
The red crosses in Fig. 3b show the values as a function of . By fitting the slope of -vs- to using the linear least squares fitting technique, we derived . This corresponds to . Once is determined, each value can be obtained by eqs. (8) and (9) using corresponding and values. Thus we can finally obtain the mode distribution of the squeezing parameter . Reconstructed distributions up to the first 40 modes are shown in Fig. 3c and d for a pump pulse energy of 4 pJ and 1 pJ, respectively. Corresponding optical gains were calculated to be (c) and (d), respectively.
The effective mode-number of the squeezed vacua contained in the reconstructed distribution
can be calculated using the relation Christ11 ,
yielding .
Furthermore, when the standard deviation of is took into account,
is estimated to be within .
This statistical uncertainty is a trade-off for probing the huge amount of modes with the finite PNRD events.
Hence, collecting more PNRD data should reduce the statistical uncertainty.
In this work the nonclassical photon-number distributions as the even-odd photon-number oscillations were observed in an extreme broadband of 150 nm FWHM. This bandwidth is, to our knowledge, the broadest one among those ever realized by any kinds of nonclassical light sources and by any types of photon detectors. The bands were technologically important ones, namely the telecom S-, C-, and L-band. The mode analysis showed that the several tens of orthonormal broadband modes were measured by our ultrabroadband PNR detector. We anticipate our results and technique open up a new possibility to generate and characterize nonclassical light sources for a large-scale optical quantum network in the frequency domain Pysher11 ; Pinel12 ; Menicucci08 .
There are interesting open issues along with this work. Firstly more sophisticated methods for mode identification and characterization are needed to be developed. The method used here is just for evaluating the mode weight distributions under certain assumptions on the SPDC spectral correlation. More direct methods on mode analysis are desired.
Secondly low-loss mode-separating devices should also be developed to implement prospective mode analyzing schemes and should be combined with highly efficient PNR detectors. In this regard, our setup can be extended into a phase-sensitive scheme by introducing phase coherent LOs. When a LO is seeded into the squeezer, squeezed coherent light can be generated, whose photon-number distributions exhibit unique phase dependent oscillation SW_ocsillation_87 ; Koashi_SubPoisson_93 . When, on the other hand, a LO is used at the detection side, then phase-sensitive PNR detection can be realized Takeoka_Bin_Proj_Meas_06 ; Tsujino11 ; Izumi_PNRD_13 ; Becerra_q-receiver_4PSK_13 . By appropriately engineering the LO modes, one can observe quantum states in designated modes in both schemes mentioned above. This would provide a first step toward realizing a quantum-mode analyzer.
Finally broadband light sources play essential roles in diverse fields in the classical domain, such as high-capacity optical communications Ohara06 , optical coherence tomography Choi_Kurokawa2004_Frequency-comb-interferometer , optical spectroscopy Coddington_Newbury2008_Coherent-multiheterodyne-spectroscopy , and spectrograph calibration Ycas_Sigurdsson2012_spectrograph calibration . Supercontinuum sources in the vicinity of the 1550 nm telecommunication wavelength Genty_Dudley2007_Fiber-supercontinuum are of particular importance for wavelength division multiplexing in fiber-optic communications Agrawal10 . Our ultrabroadband source and detection scheme shown here could also provide a way to utilize the multimode nonclassical states for realizing such capabilities in the quantum domain.
Acknowledgements.
We thank R. Jin, G. Fujii, M. Fujiwara, T. Yamamoto, R. Shimizu, M. Koashi, T. Hirano and T. Gerrits for discussions, and E. Sasaki and A. Sekine for technical support. This work was supported by the Founding Program for World-Leading Innovative R&D on Science and Technology (FIRST) program.References
- (1) Knill, E., Laflamme, R., & Milburn, G. J., “A scheme for efficient quantum computation with linear optics,” Nature (London) 409, 46-52 (2001).
- (2) O’Brien, J. L., Furusawa, A., Vučković, J., “Photonic quantum technologies,” Nat. Photon. 3, 687-695 (2009).
- (3) Weedbrook, C., Pirandola, S., Garcia-Patron, R, Cerf, N. J., Ralph, T. C., Shapiro, J. H., and Lloyd, S., “Gaussian quantum information,” Rev. Mod. Phys. 84, 621 (2012).
- (4) Mandel, L., & Wolf, E., Optical Coherence and Quantum Optics (Cambridge University Press, Cambridge, 1995).
- (5) Gerry, C. C. & Knight, P. L., Introductory Quantum Optics (Cambridge University Press, Cambridge, 2005).
- (6) Okano, M., Okamoto, R., Tanaka, A., Subashchandran, S., & Takeuchi, S., “Generation of broadband spontaneous parametric fluorescence using multiple bulk nonlinear crystals,” Opt. Express 20, 13977-13987 (2012).
- (7) Keller, T. & Rubin, M., “Theory of two-photon entanglement for spontaneous parametric down-conversion driven by a narrow pump pulse,” Phys. Rev. A 56, 1534-1541 (1997).
- (8) Grice, W., U’Ren, A. B., & Walmsley, I. A., “Eliminating frequency and space-time correlations in multiphoton states,” Phys. Rev. A 64, 063815 (2001).
- (9) Zhu, C., & Caves, C., “Photocount distributions for continuous-wave squeezed light,” Phys. Rev. A 42, 6794-6804 (1990).
- (10) Law, C. K., Walmsley, I. A., & Eberly, J. H., “Continuous Frequency Entanglement: Effective Finite Hilbert Space and Entropy Control,” Phys. Rev. Lett. 84, 5304-5307 (2000).
- (11) Sasaki, M. & Suzuki, S. “Multimode theory of measurement-induced non-Gaussian operation on wideband squeezed light,” Phys. Rev. A 73, 043807 (2006).
- (12) Rohde, P. P., Mauerer, W., & Silberhorn, Ch., “Spectral structure and decompositions of optical states, and their applications,” New J. Phys. 9, 91 (2007).
- (13) Breitenbach, G., Schiller, S., & Mlynek, J., “Measurement of the quantum states of squeezed light,” Nature (London) 387, 471-475 (1997).
- (14) Lvovsky, A. I. & Raymer, M. G., “Continuous-variable optical quantum-state tomography,” Rev. Mod. Phys. 81, 299-332 (2009).
- (15) U’Ren, A. B., Banaszek, K., & Walmsley, I. A., “Photon engineering for quantum information processing,” Quantum Inf. Comput. 3, 480 (2003).
- (16) Christ, A., Laiho, K., Eckstein, A., Cassemiro, K. N., & Silberhorn, Ch., “Probing multimode squeezing with correlation functions,” New J. Phys. 13, 033027 (2011).
- (17) Klyshko, D. N., “Observable signs of nonclassical light,” Phys. Lett. A 213, 7-15 (1996).
- (18) Waks, E., Sanders, B., Diamanti, E., & Yamamoto, Y., “Highly nonclassical photon statistics in parametric down-conversion,” Phys. Rev. A73, 033814 (2006).
- (19) Waks, E., Diamanti, E., Sanders, B. C., Bartlett, S. D., & Yamamoto, Y., “Direct Observation of Nonclassical Photon Statistics in Parametric Down-Conversion,” Phys. Rev. Lett. 92, 113602 (2004).
- (20) Mauerer, W., Avenhaus, M., Helwig, W., & Silberhorn, Ch., “How colors influence numbers: Photon statistics of parametric down-conversion,” Phys. Rev. A 80, 053815 (2009).
- (21) Avenhaus, M., Coldenstrodt-Ronge, H., Laiho, K., Mauerer, W., Walmsley, I. A., & Silberhorn, Ch., “Photon Number Statistics of Multimode Parametric Down-Conversion,” Phys. Rev. Lett. 101, 053601 (2008).
- (22) Goldschmidt, E. A., Piacentini, F., Berchera, I. R., Polyakov, S. V., Peters, S., Kuck, S., Brida, G., Degiovanni, I. P., Migdall, A., & Genovese, M., “Mode reconstruction of a light field by multiphoton statistics,” Phys. Rev. A 88, 013822 (2013).
- (23) Lita, A. E., Miller, A. J., & Nam, S.-W., “Counting near-infrared single-photons with 95 efficiency,” Opt. Express 16, 3032-3040 (2008).
- (24) Fukuda, D., Fujii, G., Numata, T., Yoshizawa, A., Tsuchida, H., Fujino, H., Ishii, H., Itatani, T., Inoue, S., & Zama, T, “Photon number resolving detection with high speed and high quantum efficiency,” Metrologia 46, S288-S292 (2009).
- (25) Fukuda, D., Fujii, G., Numata, T., Amemiya, K., Yoshizawa, A., Tsuchida, H., Fujino, H., Ishii, H., Itatani, T., Inoue, S., & Zama, T., “Titanium-based transition-edge photon number resolving detector with 98 detection efficiency with index-matched small-gap fiber coupling,” Opt. Express 19, 870-875 (2011).
- (26) Gerrits, T., Thomas-Peter, N., Gates, J. C., Lita, A. E., Metcalf, B. J., Calkins, B., Tomlin, N. A., Fox, A. E., Linares, A. L., Spring, J. B., Langford, N. K., Mirin, R. P., Smith, P. G. R., Walmsley, I. A., & Nam, S.-W., “On-chip, photon-number-resolving, telecommunication-band detectors for scalable photonic information processing,” Phys. Rev. A 84, 060301 (2011).
- (27) Menicucci, N. C., Flammia, S. T., & Pfister, O., “One-Way Quantum Computing in the Optical Frequency Comb,” Phys. Rev. Lett. 101, 130501 (2008).
- (28) Pysher, M., Miwa, Y., Shahrokhshahi, R., Bloomer, R., & Pfister, O., “Parallel Generation of Quadripartite Cluster Entanglement in the Optical Frequency Comb”, Phys. Rev. Lett. 107, 030505 (2011).
- (29) Pinel, O., Jian, P., de Araujo, R., Feng, J., Chalopin, B., Fabre, C., & Treps, N., “Generation and Characterization of Multimode Quantum Frequency Combs,” Phys. Rev. Lett. 108, 083601 (2012).
- (30) Lvovsky, A. I., Wasilewski, W., Banaszek, K. “Decomposing a pulsed optical parametric amplifier into independent squeezers” J. Mod. Opt. 54 721-733 (2007).
- (31) Achilles, D., Silberhorn, Ch., Śliwa, C., Banaszek, K., & Walmsley, I. A., “Fiber-assisted detection with photon number resolution,” Opt. Lett. 28, 2387-2389 (2003).
- (32) Barnett, S. M., & Radmore, P. M., Mehods in Theoretical Quantum Optics (Oxford University Press, New York, 1997).
- (33) Gerrits, T., Stevens, M. J., Baek, B., Calkins, B., Lita, A. E., Glancy, S., Knill, E., Nam, S.-W., Mirin, R. P., Hadfield, R. H., Bennink, R. S., Grice, W. P., Dorenbos, S., Zijlstra, T., Klapwijk, T., & Zwiller, V., “Generation of degenerate, factorizable, pulsed squeezed light at telecom wavelengths,” Opt. Express. 19, 24434-24447 (2011).
- (34) Schleich, W., & Wheeler, J. A., “Oscillations in photon distribution of squeezed states and interference in phase space,” Nature (London) 326, 574-577 (1987).
- (35) Koashi, M., Kono, K., Hirano, T., & Matsuoka, M., “Photon antibunching in pulsed squeezed light generated via parametric amplification,” Phys. Rev. Lett. 71, 1164-1167 (1993).
- (36) Takeoka, M., Sasaki, M., & Lutkenhaus, N., “Binary Projective Measurement via Linear Optics and Photon Counting,” Phys. Rev. Lett. 97, 040502 (2006).
- (37) Tsujino, K., Fukuda, D., Fujii, G., Inoue, S., Fujiwara, M., Takeoka, M., & Sasaki, M., “Quantum Receiver beyond the Standard Quantum Limit of Coherent Optical Communication,” Phys. Rev. Lett. 106, 250503 (2011).
- (38) Izumi, S., Takeoka, M., Ema, K., & Sasaki, M., “Quantum receivers with squeezing and photon-number-resolving detectors for M-ary coherent state discrimination,” Phys. Rev. A 87, 042328 (2013).
- (39) Becerra, F. E., Fan, J., Baumgartner, G., Goldhar, J., Kosloski, J. T. & Migdall, A., “Experimental demonstration of a receiver beating the standard quantum limit for multiple nonorthogonal state discrimination,” Nat. Photon. 7, 147-152 (2013).
- (40) Ohara, T., Takara, H., Yamamoto, Y., Masuda, H., Morioka, T., Abe, M., & Takahashi, H., “Over-1000-channel ultradense WDM transmission with supercontinuum multicarrier source,” J. Lightwave Technol. 24, 2311-2317 (2006).
- (41) Choi, S., Yamamoto, M., Moteki, D., Shioda, T., Tanaka, Y., & Kurokawa, T. “Frequency-comb-based interferometer for profilometry and tomography,” Opt. Lett. 31, 1976-1978 (2006).
- (42) Coddington, I., Swann, W. C., & Newbury, N. R., “Coherent multiheterodyne spectroscopy using stabilized optical frequency combs,” Phys. Rev. Lett. 100, 013902 (2008).
- (43) Ycas, G. G., Quinlan, F., Diddams, S. A., Osterman, S., Mahadevan S., Redman, S., Terrien, R., Ramsey L., Bender, C. F, Botzer, B., & Sigurdsson, S. “Demonstration of on-sky calibration of astronomical spectra using a 25 GHz near-IR laser frequency comb,” Opt. Express 20, 6631-6643 (2012).
- (44) Genty, G., Coen, S., & Dudley, J. M. “Fiber supercontinuum sources (Invited),” J. Opt. Soc. Am. B 24(8), 1771-1785 (2007).
- (45) Agrawal G. P. Fiber-Optic Communication Systems (Wiley, 2010).
Appendix A Calibration of TES’s detection efficiency depending on the wavelength.
We used a continuous-wave (CW), wavelength-tunable ECDL (Santec, TSL-510)
in order to measure the DE’s wavelength dependence.
The CW light beam from the ECDL was connected to the fiber-coupler.
One of the outputs from the coupler was guided to our TES after passing through the variable attenuator.
This power to the TES was heavily attenuated (90 dB) such that the average power was set to be below 1 fW,
and was monitored via the other output port of the coupler using a power meter, whose wavelength sensitivity was precisely calibrated.
The coupler’s splitting ratio and the degree of the attenuation were also precisely measured using the same power meter.
Because photon arrival was random using the CW source,
total counts from the TES was collected by the threshold detector (SR400, Stanford Research).
Photon counts from the TES were a few kHz, and the raw waveforms were not overlapped each other.
We scanned the wavelength at each 3 nm step from 1512 to 1620 nm, and obtained a relative DE as shown in Fig. 1d.
Appendix B Second and third-order correlation functions for the multimode squeezer.
In this multimode “single-beam squeezer” case, the second and third intensity correlation functions are described in the ref. Christ11 as follows,
| (11) | ||||
| (12) |
When a JSD takes a 2D Gaussian shape, forms a thermal distribution defined by a single parameter , as . When the is small enough (), that is valid in our experimental conditions, the following approximations are valid as
| (13) | |||||
| (14) | |||||
| (15) | |||||
Appendix C Specification of PPKTP crystal and squeezing spectrum.
The JSD can be a product of two quantities as
| (17) |
where describes pump-frequency envelop, and describes phase-matching function for the SPDC in a nonlinear crystal BK08 . Explicitly with the crystal length and phase mismatch . denotes a grating period of the PPKTP crystals and 24.2 m in our case. Assuming that the transversal phase-matching is perfect, the longitudinal one can be described as , because we used collinear configuration where pump, signal, and idler are all in the same polarization. Note that the beam propagating direction is taken to be along -axis and is the wave vectors. The frequencies are in a relation of . The corresponding Sellmeier equation for can be found in the ref. Fradkin99 . The blue line in Fig. 1c was theoretically derived using the above formulas and parameters.
References
- (1) Baek, S.-Y., & Kim, Y.-H., “Spectral properties of entangled photon pairs generated via frequency-degenerate type-I spontaneous parametric down-conversion,” Phys. Rev. A 77, 043807 (2008).
- (2) Fradkin, K., Arie, A., Skliar, A., Rosenman, G., “Tunable midinfrared source by difference frequency generation in bulk periodically poled KTiOPO4,” Appl. Phys. Lett. 74, 914-916 (1999).