The Association of Solar Flares with Coronal Mass Ejections During the Extended Solar Minimum
Abstract
We study the association of solar flares with coronal mass ejections (CMEs) during the deep, extended solar minimum of 2007 – 2009, using extreme-ultraviolet (EUV) and white-light (coronagraph) images from the Solar Terrestrial Relations Observatory (STEREO). Although all of the fast (v 900 km s-1) and wide ( 100∘) CMEs are associated with a flare that is at least identified in GOES soft X-ray light curves, a majority of flares with relatively high X-ray intensity for the deep solar minimum (e.g. 110-6 W m-2 or C1) are not associated with CMEs. Intense flares tend to occur in active regions with strong and complex photospheric magnetic field, but the active regions that produce CME-associated flares tend to be small, including those that have no sunspots and therefore no NOAA active-region numbers. Other factors on scales comparable to and larger than active regions seem to exist that contribute to the association of flares with CMEs. We find the possible low coronal signatures of CMEs, namely eruptions, dimmings, EUV waves, and Type III bursts, in 91 %, 74 %, 57 %, and 74 %, respectively, of the 35 flares that we associate with CMEs. None of these observables can fully replace direct observations of CMEs by coronagraphs.
keywords:
Flares; CMEs; STEREO1 Introduction
S-Introduction
The origin of coronal mass ejections (CMEs) is still not well understood to the level that we can predict them in advance, although considerable progress has been made in recent years in observations and numerical models (see, e.g., Chen, 2011, and references therein.) One of the associated phenomena is the solar flare. The solar flare is characterized by a sudden increase in electromagnetic radiation, as a result of heating and particle acceleration, which are usually thought to result from magnetic reconnection. One problem appears to be the lack of consensus as to the role of magnetic reconnection in CMEs, which eject coronal magnetized plasma into the heliosphere.
Intense flares are often observed around the times of extremely energetic CMEs, such as several of those during the October – November 2003 period (e.g. Gopalswamy, et al., 2005). However, less than half of CMEs are associated with flares Munro et al. (1979). Moreover, it has been reported that certain CMEs, typically during solar minimum, may leave no observable signatures in the corona Robbrecht et al. (2009); Ma et al. (2010), not to mention flares. Nevertheless, a flare-associated CME tends to show a characteristic kinematic pattern: that is, starting fast and then decelerating MacQueen and Fisher (1983); Sheeley et al. (1999).
The association of flares with CMEs increases with their peak soft X-ray flux. By definition, a CME is observed with white-light coronagraphs. Their detection sensitivity is higher when the source region is located near the limb because of the way that Thomson scattering works Yashiro et al. (2005). According to Yashiro et al. Yashiro et al. (2005), who carefully made associated CME-flare pairs during 1996 – 2001, the location-averaged CME association rate is roughly 20 %, 50 % and 90 % for C-class, M-class, and X-class flares, respectively. When the two phenomena are associated, they tend to be closely related both temporally (e.g. Zhang et al., 2001; Temmer et al., 2010) and spatially (e.g. Yashiro et al., 2008).
In this article, we study the association of flares with CMEs during the extended minimum after Solar Cycle 23, primarily using remote-sensing data from the Solar Terrestrial Relations Observatory (STEREO: Kaiser et al., 2008). Flares were observed by the Extreme-Ultraviolet Imager (EUVI: Wülser et al., 2004; Howard et al., 2008). To associate flares with CMEs, we compare EUVI with white-light data from the Large Angle Spectroscopic Coronagraph (LASCO: Brueckner et al., 1995) on the Solar and Heliospheric Observatory (SOHO), and the COR-1 and COR-2 coronagraphs Howard et al. (2008) on STEREO. The ambiguity in associating flares with CMEs has been considerably reduced, thanks to the availability of high cadence COR-1 data that cover the corona between 1.4 R and 4.0 R in heliocentric distance, and also to the solar minimum conditions in which successive flares or CMEs tend to occur farther apart in both time and space than when the solar activity is high. In the next section, we briefly review the solar minimum in question, and active regions and flares during the period. After describing the data used in this study, we present the analysis in Section 3. The results are given in Section 4 with some discussion of selected examples. In Section 5 we summarize our study.
2 Flares and Active Regions During 2007 – 2009
General

Following the last X-class flare on 14 December 2006 in Solar Cycle 23, which occurred before the imagers on STEREO started to be operational, not many eruptive events with intense X-ray emission were observed, as we show in Section 4. This situation apparently changed in February 2010, when several CMEs were observed in association with GOES M-class flares. In order to give a glimpse of the last solar minimum, we show in Figure 1 the daily EUV flux from EUVI 195 Å on STEREO-Ahead (A). The average flux per pixel was processed using images taken around 12 UT. This plot also shows that, around February 2010, the spatially-averaged EUV flux resumed the level as of the beginning of 2007.
A catalog of flares observed by EUVI was already published by Aschwanden et al. Aschwanden et al. (2009). It contains a total of 185 flares up to 4 November 2008 that were either above the GOES C1 level (110-6 W m-2 in the 1 – 8 Å band) or detected by the Reuven Ramaty High Energy Solar Spectroscopic Imager (RHESSI: Lin et al., 2002). Its emphasis was on the properties of flares as observed in the EUV wavelengths. However, the CME-flare association was not discussed except in a handful of rare events. Although Aschwanden et al. Aschwanden et al. (2009) found a report of CME occurrence from LASCO, COR1, or COR2 around the times of about one third of the flares, such a report does not necessarily mean that the flare is associated with the CME, unless we make sure that the two phenomena occur close both in space and time. Here we focus on the association of flares and CMEs during the extended minimum after Solar Cycle 23, by comparing EUV and coronagraph images. As shown in Section 4, we find that a much smaller number of flares were associated with CMEs than were indicated by Aschwanden et al. Aschwanden et al. (2009).
During March 2007 – December 2009, 11 M-class and 95 C-class flares occurred. There were no X-class flares. As in Aschwanden et al. Aschwanden et al. (2009), we study all of these M-class and C-class flares, and also some B-class and A-class flares. However, inclusion of the latter flares depends on whether they are associated either with a CME or CME-related signatures, rather than on their detection by RHESSI.
| 1 | 2 | 3 | 4 | 5 | 6 | 7 | 8 | 9 | 10 |
|---|---|---|---|---|---|---|---|---|---|
| AR | Date | Lat. | Long. | Pol. | Area | Comp. | M | C | |
| 10953 | 1 May 2007 | -11 | 308 | O | 520 | 4.0 | 0 | 2 | |
| 10956 | 19 May 2007 | 3 | 71 | ? | 300 | 4.4 | 0 | 2 | |
| 10960 | 7 Jun 2007 | -7 | 178 | O | 540 | 4.3 | 10 | 17 | |
| 10962 | 3 Jul 2007 | -9 | 189 | O | 60 | 2.5 | 0 | 2 | |
| 10963 | 15 Jul 2007 | -6 | 57 | O | 530 | 3.6 | 0 | 19 | |
| 10966 | 9 Aug 2007 | -6 | 66 | O | 40 | 2.9 | 0 | 2 | |
| 10969 | 27 Aug 2007 | -7 | 188 | O | 540 | 2.9 | 0 | 1 | |
| 10978 | 11 Dec 2007 | -8 | 223 | O | 340 | 4.3 | 0 | 10 | |
| 10980 | 8 Jan 2008 | -7 | 237 | O | 30 | 3.0 | 0 | 5 | |
| 10988 | 30 Mar 2008 | -8 | 237 | O | 300 | 3.3 | 0 | 1 | |
| 10989 | 1 Apr 2008 | -12 | 206 | O | 80 | 2.8 | 1 | 0 | |
| 11007 | 1 Nov 2008 | 35 | 254 | N | 80 | 3.8 | 0 | 2 | |
| N-AR∗ | 4 Dec 2008 | -25 | 170 | ? | ? | ? | ? | 0 | 1 |
| 11024 | 5 Jul 2009 | -27 | 247 | N | 230 | 3.7 | 0 | 2 | |
| 11026 | 27 Sep 2009 | -31 | 220 | N | 70 | 2.0 | 0 | 1 | |
| 11029 | 25 Oct 2009 | 15 | 212 | N | 380 | 4.2 | 0 | 11 | |
| 11034 | 15 Dec 2009 | 19 | 252 | N | 20 | 4.0 | 0 | 1 | |
| 11035 | 15 Dec 2009 | 30 | 249 | N | 310 | 4.4 | 0 | 6 | |
| 11036 | 18 Dec 2009 | -28 | 209 | N | 70 | 2.9 | 0 | 3 | |
| 11038 | 19 Dec 2009 | 16 | 204 | N | 20 | 2.0 | 0 | 2 | |
| 11039 | 31 Dec 2009 | -27 | 53 | N | 220 | 3.9 | 0 | 5 |
1: NOAA AR number. 2: Date of central meridian (CM) passage.
3: Latitude. 4: Carrington longitude.
5: Whether the AR belongs to the old (O) or new (N)
solar cycle (23 or 24), depending on how the
positive and negative polarities are aligned East – West
assuming Hale’s law. 6: Maximum sunspot area
(in microhemispheres) during the disk passage. 7: Maximum parameter
Schrijver (2007) in logarithmic during the disk passage.
8: Maximum magnetic complexity in the Mt. Wilson scheme during the disk passage.
9: Number of M-class flares. 10: Number of C-class flares.
∗ Not a NOAA active region.
In Table 1, we show the basic properties of active regions (ARs) in which M- and C-class flares occurred in the period. Only two ARs were responsible for the M-class flares and a total of 20 ARs produced C-class flares. No data analysis is needed for these properties but the parameter Schrijver (2007), which is the total unsigned magnetic flux near the polarity inversion lines, and is used as a measure of magnetic free energy in an AR. According to Schrijver Schrijver (2007), an AR with can, within 24 hours, produce flares whose peak GOES flux is up to W m-2, which is X1.2 for . We compute for every magnetogram taken by the Michelson Doppler Imager (MDI: Scherrer et al., 1995) onboard SOHO that contains the AR within 0.7 R from disk center, and put the maximum value of in the seventh column.
Based on the latitude and Carrington longitude, only AR 10960 and AR 10978 survived more than one solar rotation. They were not traceable in the third rotation, however. This is different from the solar minimum around 1996, in which a single region, which was AR 7978 in the first rotation, survived for four months (e.g. van Driel-Gesztelyi, 1998).
Active regions started to follow the Cycle 24 polarity sometime in 2008, and AR 11024 (July 2009) was the first region with this polarity whose sunspot area exceeded 200 microhemispheres. Note that the polarity of AR 10956 is not given in Table 1. This is because it contained a second bipole that violated Hale’s law Bone et al. (2009). The presence of such a bipole and its interaction with the primary bipole, which followed Hale’s law, may have made the AR more CME-productive (see Section 4), although the most intense flare in the AR was only C2.9. The polarity is unknown also for the region that produced a C-class flare in December 2008. The region had no sunspot and therefore was not a NOAA AR.
3 Associating Flares with CMEs
Procedure
3.1 Data
We limit our analysis to flares during March 2007 – December 2009. This is partly to isolate the solar minimum away from the notable activities in Solar Cycles 23 and 24. Each flare detected by the GOES X-ray Sensor (XRS) is studied using EUVI data. EUVI is a normal-incidence telescope on board STEREO with four EUV wavelength bands (171 Å, 195 Å, 284 Å and 304 Å) similar to those of the Extreme-ultraviolet Imaging Telescope (EIT: Delaboudinière et al., 1995) on SOHO. EUVI observes the Sun in 20482048 1.6′′ pixels. The field of view (FOV) in the North – South and East – West directions extends to 1.7 R.
EUVI data are analyzed primarily to study three signatures closely related to CMEs (e.g. Hudson and Cliver, 2001), namely eruptions, coronal dimming and coronal waves. Eruptions in EUV may be a lower-temperature counterpart of X-ray ejections that are often associated with CMEs Nitta and Akiyama (1999); Kim et al. (2005); Tomczak and Chmielewska (2012). Dimming and waves are usually best captured in images in the 195 Å band (e.g. Wills-Davey and Thompson, 1999), dominated by Fe xii lines, even though significant contributions from the Fe xxiv line due to hot flare plasma are seen during intense flares Nitta et al. (2013a).
Despite the importance of the 195 Å band, the typical cadence of images in this band was only ten minutes because 171 Å images were given higher priority. This was changed in August 2009, when the 195 Å band was finally made the primary wavelength band. The typical cadences before the change were 2.5, 20, and 10 minutes for the 171 Å, 284 Å, and 304 Å bands, respectively. After August 2009, in addition to 195 Å images at the five – minute cadence, 304 Å images have been taken every ten minutes. Images in the remaining two bands have been taken at lower cadences except during occasional campaign observations. Early in the mission the same flares were observed by both STEREO spacecraft. But more flares were observed by only one spacecraft at later times due to increased separation of STEREO from the Sun–Earth line. With the rate of 22∘/year drift of each STEREO spacecraft, STEREO-B (STEREO-A) was 68∘ East of (64∘ West of) the Sun–Earth line on 31 December 2009.
3.2 Online Flare List and Analysis
The present study comes largely from the online EUVI flare list with extensive movies we maintain at secchi.lmsal.com/EUVI/MOVIES_FLARES_CMES. The list goes beyond 2010, but its main purpose is to provide movies and plots for flares during 2007 – 2009. The front page of the list at the above address shows basic parameters of the flares, including simplified ranks of the four CME-related attributes as described below. More substantial material is contained in the page for each event that is located one layer deeper and accessible by clicking the start time in the front page. For example, “2007/12/31 00:37” leads to secchi.lmsal.com/EUVI/MOVIES_FLARES_CMES/event_20071231_00.html for the flare SOL2007-12-31T01:11111For SOL identification convention, see Solar Phys. 263, 1, 2010. doi:10.1007/s11207-010-9553-0. Let us call it the event page.
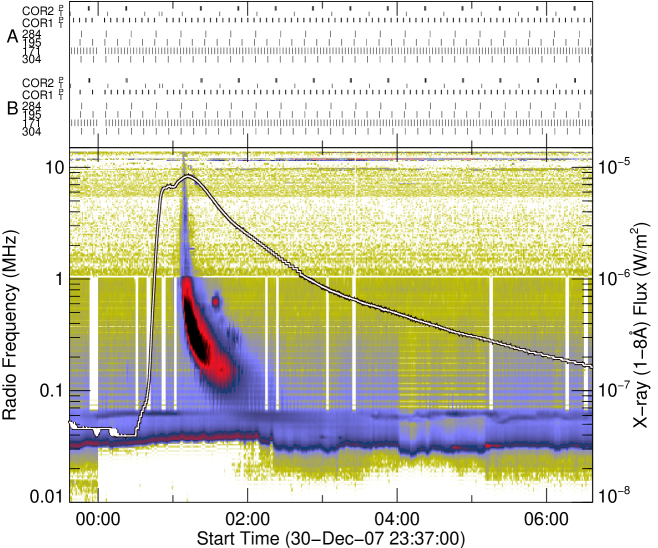
In the event page, the first item to look at is the plot that shows data coverage plotted with respect to the GOES X-ray light curve (Figure 2). We use this to find if the lack of a CME or CME-related signatures is due to unexpected long data gaps or poor cadence. Figure 2 also shows a radio dynamic spectrum from Wind/WAVES. This readily tells us if the flare is accompanied by a Decametric-Hectometric (DH) Type III burst, which is due to nonthermal electrons that escape into the heliosphere along open field lines. We find that the flares associated with a CME are often accompanied by a Type III burst (see Section 4), which may bear additional information on the interface between the CME expansion and neighboring open field regions (see Yan et al., 2006). We rank the flare in terms of the association with a Type III burst in the following manner: i) No Type III burst, ii) Type III burst delayed with respect to the flare impulsive phase, iii) Type III burst that is weak especially at high frequencies (1 MHz), although appearing in the impulsive phase, iv) Clear Type III burst up to the highest frequency (13.75 MHz) of Wind/WAVES, appearing in the impulsive phase. In this scheme the event shown in Figure 2 is ranked ii), meaning that the Type III burst is delayed with respect to the impulsive phase. It is possible that the timing of the Type III burst with respect to the impulsive phase may hold useful information on the role of magnetic reconnection in the overall CME processes. Rank iii) flares suggest that the source region may be occulted, or that the electrons responsible for the Type III burst are accelerated only in the high corona, such as above 2 R in heliocentric distance.
The event page is populated with links to movies. Inspecting these movies is an essential part of the present study, which nevertheless accommodates some quantitative analysis as well. First, we make partial frame (PF) movies of the flare region in all of the available wavelengths, which consist of 640640 imagesin full resolution, spanning an approximately 1717′ field-of-view (FOV). The FOV is manually adjusted to capture the CME signatures as well as the flare center.
In all wavelengths but 304 Å, the PF movies contain intensity images and both running and base (pre-event subtracted) difference images. The inclusion of base-difference images is specifically to find long-term coronal dimming, which does not come out in more commonly used running-difference images Attrill et al. (2007). In order to make base-difference images, we try to take out solar rotation, using the SolarSoft routine drot_map.pro, which assumes differential rotation at the zero height from the photosphere. This assumption is obviously not correct, and the inaccuracy builds up with time, so the length of the movies should in principle not exceed six hours for regions close to central meridian. The off-limb portion is not de-rotated because we do not know the longitude of each pixel. This can also produce artificial dimming or brightening caused by the interplay between the unknown intensity distribution and solar rotation.
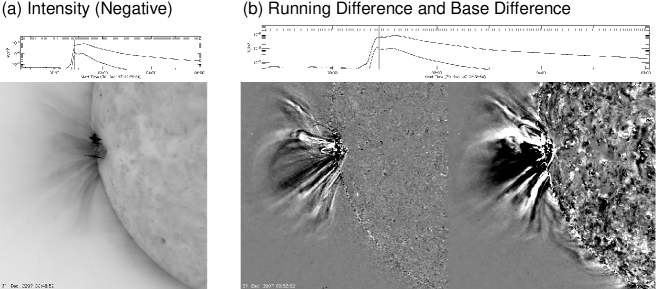
The movies incorporate GOES X-ray light curves on which the times of the images are indicated. This helps us find the temporal relation of the CME signatures with the flare development. In Figure 3 we show snapshots from the PF movies of the event plotted in Figure 2. Figure 3(a) shows an intensity images in 171 Å. Figure 3(b) shows a running-difference image on the left and base-difference image on the right. The running (base)-difference image reflects the time difference of ten minutes (two hours). The dimming beneath the front is clearer in the base difference image.
These PF movies allow us to rank the flare in terms of how eruptive it is in the lower corona: i) No eruption, ii) Confined eruption, iii) Jet-like eruption, and iv) Loop-like eruption. We tend to connect rank iii) events to narrow CMEs and rank iv) events to normal (flux-rope) CMEs. (Chen Chen (2011) discusses the possible distinction of narrow and normal CMEs). The wavelength at which the eruption is seen most clearly depends on the event, probably reflecting different plasma temperature distributions in different eruptions.
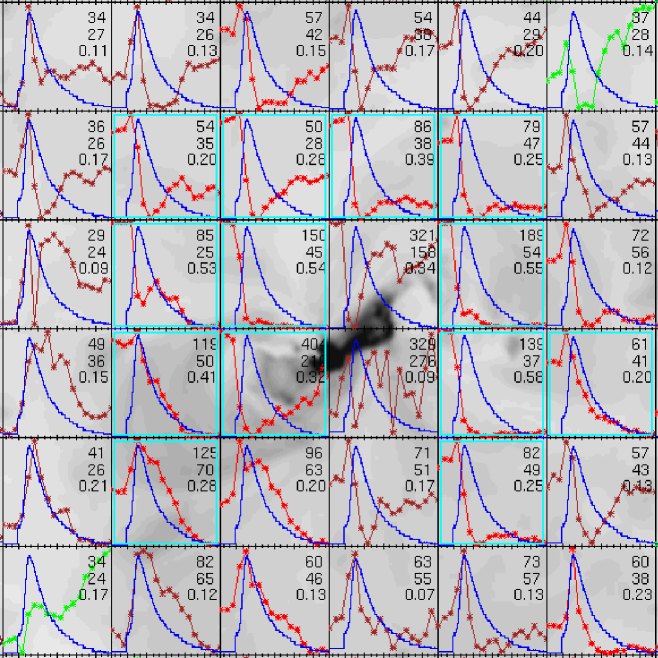
In order to characterize coronal dimming beyond visual inspection of the movies, we average the 640640 full-resolution PF images into 1616 macropixels, and follow the temporal variations of the flux in each macropixel. We plot the flux variations on top of a representative full-resolution image. These plots in all the available wavelength bands are linked in the event page. We color-code the flux curves to easily find macropixels that show substantial dimming. They are plotted in light green (red) if the flux increases (decreases) in the plotted time interval. Those plotted in brown indicate that the difference between the first and last points is small. The flux variations can be compared with the normalized GOES light curve (in blue). The maximum flux , minimum flux and normalized difference ( are shown. As an example, we show in Figure 4 the central part of one of the plots. Here we look for macropixels that undergo dimming by more than 10 % of the pre-flare level and stay dimmed for more than an hour. In Figure 4, these macropixels are marked by boxes in cyan. We count macropixels with 10 % dimming in different wavelengths depending on their availability and use the numbers to rank the flare in terms of the magnitude of dimming: i) 0 – 5 macropixels, ii) 6 – 10 macropixels, iii) 10 macropixels in one wavelength band, iv) 10 macropixels in two wavelength bands and v) 10 macropixels in three wavelength bands. The event used in Figure 4 is ranked to be v), since it has more than ten macropixels with ten % dimming in the 171 Å, 195 Å, and 284 Å bands. Note that after August 2009, it has become difficult to assign ranks iv) and v) because of the lack of images at a reasonable cadence at 171 Å or 284 Å. Despite the concern that dimming at only one wavelength may represent temperature effects rather than mass evacuation due to a CME, we have leanred that deep dimming at 195 Å is usually a reliable coronal signature of CMEs. Therefore we consider rank iii) to represent CME-related dimming as significant as ranks iv) and v).
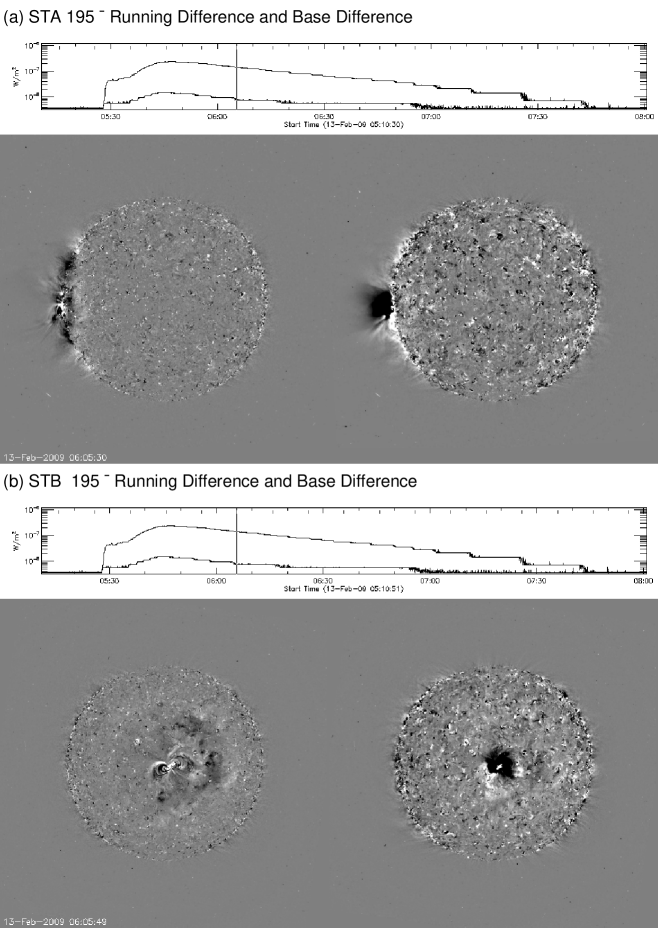
Next, we look for EIT or EUV waves and study their relations with CMEs. See Patsourakos and Vourlidas Patsourakos and Vourlidas (2012) for the most recent review on EUV waves. To determine whether the flare is associated with EUV waves, the event page also carries movies of full-disk (FD) images in the 195 Å band. EUV waves usually appear most pronounced in 195 Å images, and they often propagate beyond the FOV of the PF images extracted around the flare region. Snapshots from FD movies are shown in Figure 5. This particular event (also used for Figure 4) was observed by STEREO-A and STEREO-B almost 90 degrees apart, which provide both the disk and limb views of the eruption. Thus this event has been extensively studied (e.g. Patsourakos and Vourlidas, 2009; Kienreich, Temmer, and Veronig, 2009; Cohen et al., 2009). We rank the flare in terms of the association with an EUV wave on the basis of visual inspection of these movies. The ranking is: i) No wave, ii) Marginal wave, iii) Smaller-scale wave (propagating to a distance less than 0.5 R, iv) Large-scale wave. The example in Figure 5 is clearly rank iv). Note that this ranking is simply based on the appearance of the propagating front. It could be more physics-based if we used the measured speed of the front. Warmuth and Mann Warmuth and Mann (2011) proposed a scheme to differentiate the origin of EUV waves on the basis of the kinematics. However, we could not identify similar distinct subgroups in our sample.
| Date and Time | GX | Loc. | A or B1 | AR2 | 3 | 3 | CME4 |
|---|---|---|---|---|---|---|---|
| 8 May 2007 05:51 | B1.2 | S05 E90 | B | N-AR | 419 | 366 | v |
| 16 May 2007 17:19 | C2.9 | N00 E35 | B | 10956 | 283 | 274 | iv |
| 19 May 2007 12:48 | B9.5 | N00 E03 | A | 10956 | 341 | 521 | v |
| 20 May 2007 04:52 | B6.7 | N00 W07 | A | 10956 | -195 | 275 | v |
| 22 May 2007 14:30 | B3.9 | N03 W38 | A | 10956 | 322 | -217 | v |
| 23 May 2007 07:15 | B5.3 | N03 W53 | B | 10956 | 357 | -307 | v |
| 3 Jun 2007 09:23 | C5.3 | S08 E61 | B | 10960 | 4435 | 2715 | iv |
| 6 Aug 2007 01:45 | B4.2 | S07 E44 | B | 10966 | 276 | NA | iii |
| 6 Aug 2007 09:05 | C1.5 | S05 E41 | A | 10966 | 392 | 365 | iv |
| 6 Aug 2007 15:24 | C1.1 | S05 E38 | B | 10966 | 295 | 167 | iv |
| 7 Dec 2007 04:35 | B1.4 | S05 W06 | A | 10977 | 289 | 277 | v |
| 8 Dec 2007 17:08 | N-FL | S05 W27 | A | 10977 | 269 | 192 | v |
| 31 Dec 2007 00:37 | C8.3 | S10 E106 | B | 10980 | 241 | 248 | v |
| 2 Jan 2008 06:51 | C1.1 | S06 E72 | B | 10980 | 88 | 108 | v |
| 7 Jan 2008 02:26 | B1.2 | N38 W02 | A | 10981 | 366 | 315 | ii |
| 25 Mar 2008 18:36 | M1.7 | S11 E80 | B | 10989 | 435 | -447 | v |
| 5 Apr 2008 15:36 | A5.8 | S08 W105 | A | 10987 | 4085 | -4115 | v |
| 16 Apr 2008 19:37 | A5.2 | N30 W04 | A | 10990 | 335 | 257 | ii |
| 26 Apr 2008 13:41 | B3.8 | N10 E10 | B | N-AR | 275 | -208 | v |
| 4 Nov 2008 03:17 | C1.0 | N37 W47 | A | 11007 | 260 | 201 | v |
| 11 Dec 2008 05:22 | B2.6 | S26 W61 | A | 11009 | 305 | 370 | iii |
| 11 Dec 2008 09:22 | C1.4 | S25 W88 | A | N-AR | 214 | 287 | ii |
| 10 Feb 2009 23:00 | B1.3 | S06 E75 | B | 11012 | 262 | -210 | v |
| 12 Feb 2009 16:10 | B4.1 | S06 E58 | B | 11012 | 250 | 402 | iii |
| 13 Feb 2009 05:35 | B2.3 | S06 E46 | B | 11012 | 232 | 267 | v |
| 27 Feb 2009 07:10 | A3.0 | N27 W10 | A | 11012 | 182 | 200 | iii |
| 1 Oct 2009 02:47 | B7.0 | N23 W80 | A | 11027 | 221 | - | ii |
| 15 Dec 2009 23:10 | N-FL | S33 W53 | A | N-AR | 195 | - | i |
| 16 Dec 2009 01:02 | C5.3 | N30 W06 | A | 11035 | 434 | - | v |
| 21 Dec 2009 23:34 | B4.1 | S27 W44 | A | 11036 | 348 | - | iii |
| 22 Dec 2009 04:50 | C7.2 | S27 W46 | A | 11036 | 403 | - | v |
| 22 Dec 2009 15:10 | C1.1 | S27 W51 | A | 11036 | 335 | - | i |
| 22 Dec 2009 20:23 | C1.3 | N16 W51 | A | 11038 | 302 | - | i |
| 23 Dec 2009 10:09 | C6.4 | S28 W62 | A | 11036 | 321 | - | iii |
1. A or B indicates which EUVI data are used to measure the speed. A
(B) means EUVI on STEREO-A (B).
2. AR number assigned by NOAA. N-AR means no active region or outside
numbered active regions.
3. The minus sign indicates that the front appears in negative.
4. The CME rank i) – iv). See the definition given in Section 3.3.
5. Measured along the limb.
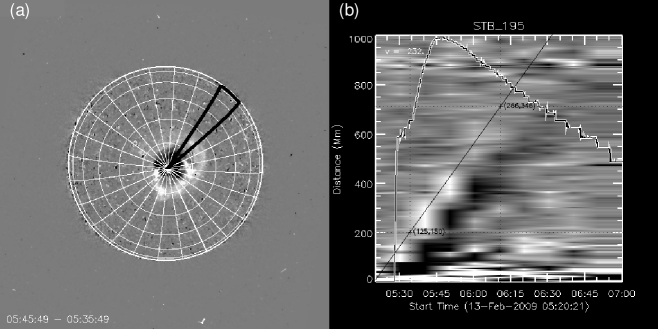
Irrespective of flares, we have surveyed all of the EUVI data between March 2007 and December 2009 and found 34 EUV waves, including small ones that correspond to rank iii) as mentioned above. They are given in Table 2. Most of them are associated with flares, but a few minor ones are not associated with any increase in the GOES X-ray flux. For each wave, we have measured the distance of the front from the center of the eruption or flare along the great circle, and studied the speed of the front corrected for the curvature of the solar surface. This technique is widely used for detecting and characterizing EUV waves (e.g. Podladchikova and Berghmans, 2005). We make distance–time plots for 24 equally-spaced sectors. The fronts appear as bright ridges in running-difference distance–time plots (Figure 6). In many cases, the ridges appear only in a small number of sectors. We choose the sector that shows the front clearly and yields the highest speed. This speed is entered in the sixth (195 Å) and seventh (171 Å) columns of Table 2. The same EUV waves were often observed by EUVI on both STEREO-A and STEREO-B while their separation was small. In these cases we give the measured speed from one spacecraft only, after confirming its consistency with that from the other spacecraft within the uncertainties. The uncertainties are estimated to be as large as 100 km s-1 on the basis of multiple attempts to trace the ridges.
The typical 195 Å cadence was ten minutes until August 2009, which is comparable to that of EIT, so the measurement of the speed of the front in EUVI data is nowhere as refined as in the 12 second data from the Atmospheric Imaging Assembly (AIA: Lemen et al., 2012) onboard the Solar Dynamics Observatory (SDO: Pesnell, Thompson, and Chamberlin, 2012). As of May 2013, more than 30 articles have been published on AIA observations of EUV waves (mostly case studies) as cited by Nitta et al. Nitta et al. (2013b), who conducted an ensemble study of large-scale coronal propagating fronts observed by AIA. A few limb events in Table 2 do not show EUV waves on disk, but we clearly see indications of large-scale disturbances over the limb. We measure their speed along the limb at the height of 0.15 R, which is consistent with the stereoscopic estimates of the height of EUV waves (see Patsourakos et al., 2009; Kienreich, Temmer, and Veronig, 2009), similar to the work by Downs et al. Downs et al. (2011) and Liu et al. Liu et al. (2012). Despite large uncertainties, we confirm that the speed of the EUV waves during solar minimum basically conforms to the range of those observed by EIT Thompson and Myers (2009). We also find examples of faster fronts in 171 Å than in 195 Å due to a better cadence as argued by Long et al. Long et al. (2008). However, we point out that in many cases the EUV wave is not as well defined at 171 Å as at 195 Å. In some cases it appears as a dark ridge as marked in Table 2, probably as a result of heating, as discussed by Wills-Davey and Thompson Wills-Davey and Thompson (1999), who analyzed data from both EIT and the Transition Region and Coronal Explorer (TRACE: Handy et al., 1999).
3.3 Associating Flares with CMEs
Lastly, we determine whether the flare is associated with a CME, which involves ranking the outflow or the lack thereof in coronagraph data. We first check the CDAW LASCO CME catalog (cdaw.gsfc.nasa.gov/CME_list/, see Yashiro et al., 2004). Using the spatial and temporal proximities, it is possible to determine whether the flare is associated with a CME. However, there are many ambiguous events because LASCO’s FOV starts only at 2.2 R from disk center and the cadence is typically between 10 and 60 minutes. The ambiguities in many of these cases may be resolved by STEREO/COR-1 data because their cadence is typically five (or ten) minutes and they cover the heliocentric distance of 1.4 – 4.0 R. If a CME is associated with the flare, we expect it to emerge in COR-1 data before it is observed by COR-2 or LASCO.
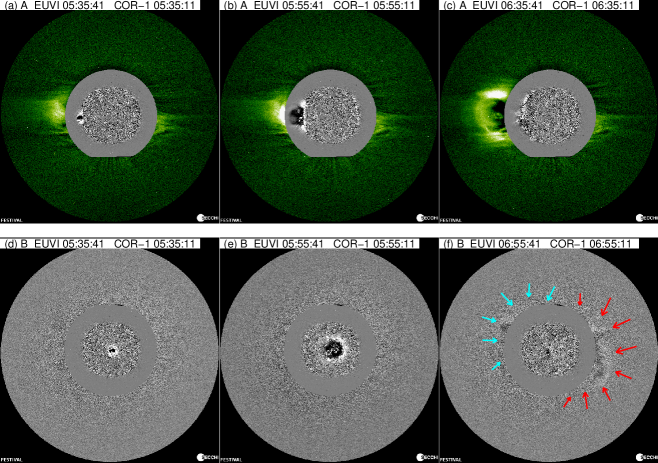
We extensively use the convenient software FESTIVAL Auchère et al. (2008) as included in SolarSoft Freeland and Handy (1998) to make EUVI and COR-1 (and COR-2) composite movies. Snapshots from such movies are shown in Figure 7, where we first note an EUV wave and then a CME. The CME is more easily seen in the limb view from STEREO-A. From STEREO-B, this event occurred close to disk center, making it hard to observe the CME. However, difference movies clearly show the CME coming from the west and northeast limbs. It is noted that some outflows in the COR-1 FOV disappear before reaching the COR-2 FOV. Indeed, these outflows are usually not found by the Computer Aided CME Tracking (CACTus: Robbrecht and Berghmans, 2004; Robbrecht, Berghmans and van der Linden 2009) as applied to COR-2 data (secchi.nrl.navy.mil/cactus).
Fully characterizing or modeling individual CMEs is beyond the scope of the present work. Instead, we rank the outflows in coronagraph data in the following manner: i) No outflow, ii) Outflow that disappears within 3 R, iii) Narrow CME, typically narrower than 30∘, iv) CME detectable up to 10 R, v) CME detectable beyond 10 R. Defining CMEs as eruptions of flux ropes into the heliosphere, this ranking is meant to distinguish CMEs from other, but possibly related, physical processes such as waves (rank ii)) and jets (rank iii)). In our classification, only rank v) may represent real CMEs, but they may be grouped into rank iv) by the interplay between the direction of motion of the CME (with respect to the plane of the sky) and the limited sensitivity of the instrument. Therefore we consider rank iv) and v) events to be real CMEs. The CME ranking comes primarily from the CDAW CME Catalog and CACTus, but we conduct our own measurements when needed. An example of the CME ranking is shown in the last column of Table 2 for EUV waves.
4 CME-Associated Flares
| 1 | 2 | 3 | 4 | 5 | 6 | 7 | 8 | 9 | 10 | 11 |
|---|---|---|---|---|---|---|---|---|---|---|
| Date and Time | A09 | GX | Loc. | AR | D | E | W | III | ||
| 25 Mar 2007 13:22 | A4.2 | S13 W77 | 10947 | 199 | 39 | iv | iv | i | i | |
| 2 May 2007 18:05 | B3.8 | S15 W14 | 10953 | 275 | 95 | v | iv | i | i | |
| 8 May 2007 05:51 | B1.2 | S05 E90 | N-AR | 462 | 52 | iv | iv | iv | iii | |
| 15 May 2007 09:28 | B1.0 | N04 E57 | 10956 | 163 | 53 | ii | iii | i | iii | |
| 15 May 2007 15:27 | 40 | C1.0 | N00 E50 | 10956 | 190 | 65 | i | iii | i | iv |
| 15 May 2007 18:02 | 41 | B3.2 | N00 E48 | 10956 | 491 | 134 | v | iv | ii | iv |
| 16 May 2007 17:19 | 43 | C2.9 | N00 E35 | 10956 | 371 | 75 | ii | iv | iv | iv |
| 19 May 2007 12:48 | 46 | B9.5 | N00 E03 | 10956 | 958 | 106 | v | iv | iv | iv∗ |
| 20 May 2007 04:52 | B6.7 | N00 W07 | 10956 | 275 | 92 | v | iv | iv | iii | |
| 22 May 2007 00:25 | B1.2 | N03 W20 | 10956 | 260 | 81 | ii | iv | ii | iii | |
| 22 May 2007 14:30 | B3.9 | N03 W38 | 10956 | 544 | 108 | v | iv | iv | iv∗ | |
| 23 May 2007 07:15 | 48 | B5.3 | N03 W53 | 10956 | 679 | 90 | iii | iv | iv | iv∗ |
| 26 May 2007 16:34 | B1.8 | N03 W105 | 10956 | 197 | 79 | iv | iv | i | i | |
| 1 Jun 2007 22:17 | 59+ | C2.8 | S08 E82 | 10960 | 584 | 75 | ii | iv | i | i |
| 3 Jun 2007 09:23 | 72 | C5.3 | S08 E61 | 10960 | 467 | 71 | v | iv | iv | iv∗ |
| 16 Jul 2007 00:50 | B2.9 | N03 W57 | 10964 | 307 | 34 | iv | iv | i | i | |
| 6 Aug 2007 09:05 | 132 | C1.5 | S05 E41 | 10966 | 379 | 60 | i | iv | iv | iv∗ |
| 6 Aug 2007 15:24 | 133 | C1.1 | S05 E38 | 10966 | 207 | 54 | iii | iv | iv | iv |
| 18 Aug 2007 11:24 | B3.3 | S08 E106 | 10969 | 516 | 46 | ii | iv | i | iv | |
| 24 Aug 2007 02:49 | A4.6 | S09 E18 | N-AR | 183 | 118 | iii | iv | i | iv | |
| 7 Dec 2007 04:35 | B1.4 | S05 W06 | 10977 | 284 | 55 | iv | iv | iv | iv | |
| 31 Dec 2007 00:37 | 175 | C8.3 | S10 E90 | 10980 | 995 | 164 | v | iv | iv | ii∗ |
| 2 Jan 2008 06:51 | 177 | C1.1 | S06 E72 | 10980 | 676 | 143 | v | iv | iv | i |
| 25 Mar 2008 18:36 | 183 | M1.7 | S11 E80 | 10989 | 1103 | 112 | v | iv | iv | iv∗ |
| 5 Apr 2008 15:39 | A5.8 | S08 W105 | 10987 | 962 | 209 | iv | iv | iv | i | |
| 26 Apr 2008 13:41 | B3.8 | N10 E10 | N-AR | 515 | 281 | v | iv | iv | iv∗ | |
| 17 May 2008 10:05 | B1.7 | S08 E26 | N-AR | 630 | 123 | ii | iv | i | iv | |
| 14 Jun 2008 23:32 | A4.7 | S10 W01 | 10998 | 243 | 73 | iv | iv | i | iii | |
| 4 Nov 2008 03:17 | 185 | C1.0 | N37 W47 | 11007 | 732 | 66 | ii | iv | iii | iv |
| 10 Feb 2009 23:00 | B1.3 | S06 E75 | 11012 | 312† | 56† | iv | iv | iv | iv | |
| 13 Feb 2009 05:35 | B2.3 | S06 E46 | 11012 | 328† | 44† | v | iv | iv | ii | |
| 31 Oct 2009 15:12 | B3.0 | N17 W94 | 11029 | 499 | 58 | iii | i | i | i | |
| 13 Dec 2009 09:17 | B1.4 | N20 E26 | 11034 | 406 | 75 | iii | iv | ii | ii | |
| 16 Dec 2009 01:02 | B1.4 | N30 W02 | 11035 | 276 | 360 | v | iv | iv | i | |
| 22 Dec 2009 04:50 | C7.2 | S27 W46 | 11036 | 318 | 47 | iii | iv | iv | iv |
1: Flare onset time. 2: Event number in Aschwanden et al. (2009). 3: GOES flare class. 4: Location in heliographic coordinates. 5: NOAA active region number. N-AR stands for regions without NOAA active regions. 6: CME linear speed (km s-1) from the CDAW CME catalog unless otherwise noted. 7: CME width (degrees) from the CDAW CME catalog unless otherwise noted. 8: Rank for dimming. 9: Rank for eruptions. 10: Rank for EUV waves. 11: Rank for the association with Type III bursts.
+ Aschwanden et al. (2009) lists the interval 21:35 – 22:35 UT represented by the preceding M2.1 flare, which is not associated with a CME.
† CME parameters taken from CACTus.
∗ Metric Type II burst.
In Table 3, we give the results of the analysis described in Section 3.2. Rather than listing all of the flares we studied, namely 11 M-class, 95 C-class and tens of B-class and less intense flares, we show only those flares associated with a CME with the CME rank of iv) and v). The mean speed and width of the CME are given in the sixth and seventh columns. Most of them are taken from the CDAW CME Catalog, and they are not corrected for the angle between the plane of the sky and the direction of the CME propagation expected for the location of the source region. The CME speed as observed in LASCO-C2 and -C3 data should be taken as a lower limit, since the CME is often seen to decelerate already in this FOV. It may be surprising that only 35 flares are included, and more so that a majority of them are B-class and less intense flares. M- and C-class flares are not as strongly associated with CMEs found for Solar Cycle 23 (Yashiro et al., 2005). The association rate is much lower than the frequency of reports of CME occurrence that were shown by Aschwanden et al. Aschwanden et al. (2009). In fact, Table 3 includes only 13 of the 159 overlapping flares in Aschwanden et al. Aschwanden et al. (2009), as indicated in the second column. More recently, Bein et al. Bein et al. (2011) studied statistically the properties of 95 impulsively accelerated CMEs, mostly flare-associated, during the overlapping period (January 2007 – May 2010). It appears that many of them were from 2010 (after the period that we deal with here), when the activity level resumed to be comparable to that of early 2007.
Despite the low association rate of flares with CMEs, we note that all of the four fast ( 900 km s-1) and wide (100∘) CMEs during the period of interest are associated with a flare that is at least identified in GOES soft X-ray light curves. In the same period, there are a number of wide front-side CMEs not associated with a flare, but they are never faster than 500 km s-1.
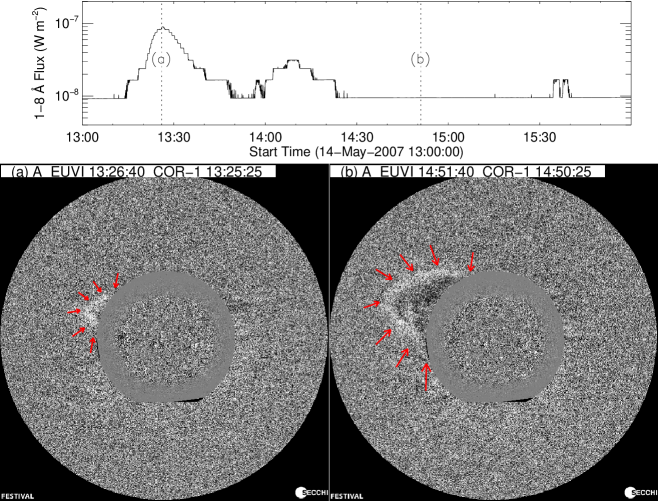
Table 3 would have been a little longer if we had included a few flares whose association with a CME is dubious. Figure 8 shows an example. There was an A8 flare on 14 May 2007, whose emission in EUV was so weak that it was difficult to locate it in EUVI intensity images. Shortly after the flare, at 14:06 UT, LASCO observed a CME at the heliocentric distance of 2.4 R. Although its linear speed was only 225 km s-1, the CME was as wide as 72∘ and the front was traceable to 17 R. Therefore, it is rank 5 in our scheme. However, using data from COR-1 on STEREO-A, we do not believe that the A8 flare was associated with this CME, although we cannot rule out the possibility. The main reason is that the front-like structure was already seen at 2 R in COR-1 data near the flare peak (Figure 8(a)), suggesting the CME launch from a high altitude, generally not accessible to a minor flare. The flare region, AR 10956, was already 10∘ inside the east limb, but the two STEREO spacecraft were separated by only 8∘ at the time, and it was not clear if there was a large-scale structure behind the east limb that could have accounted for this CME.
Let us examine the flare-CME association in terms of the signatures in non-coronagraphic observations. See columns 8 – 11 of Table 3, which show ranks of the flares in terms of the respective observables as we introduced in Section 3.2. As expected, most of the CME-associated flares appear to be highly eruptive in the low corona. The 9th column shows that 32 of 35 (91 %) flares are rank iv), indicating a broad, loop-like eruption which looks unconstrained. Note that this criterion comes from visual inspection of images and that it may be quite subjective. It is nevertheless straightforward to distinguish rank iv) events from confined (failed) eruptions (rank ii)) and jets (rank iii)). Coronal dimming (in the 8th column) with ranking of iii) or higher is seen in 26 (74 %) CME-associated flares. It is possible that our constraints may be too strong in terms of the depth of dimming (10 % less than the pre-flare intensity) and the number of macro-pixels. Note also that using the same number of pixels for the ranking of both disk and limb flares could be misleading because we do not know which part of the 3D coronal structure becomes dimmer due to mass evacuation in the CME processes. An EUV wave is seen in a smaller number (20) of the CME-associated flares. This may be because not all CMEs go through the phase of fast lateral expansion, which is proposed to be an essential ingredient of EUV waves Patsourakos and Vourlidas (2012). It is also interesting to compare Table 3 with Table 2, where 21 of 34 (62 %) EUV waves are shown to be associated with a clear CME. Lastly, although 74 % of the CME-associated flares show a Type III burst, the number is much less if we limit to a clear Type III burst that is observed at the highest frequency of Wind/WAVES (13.75 MHz) and in the impulsive phase. Flares not associated with a Type III burst tend to be more gradual, including those associated with a filament eruption. For example, the B3.0 flare SOL2009-10-31T15:24 is associated with a slow filament eruption. No clear Type III burst is observed, nor is an EUV wave detected. Therefore, it appears that a Type III burst may be characteristic of only a certain subset of CMEs.
20070603_06_09_pfss
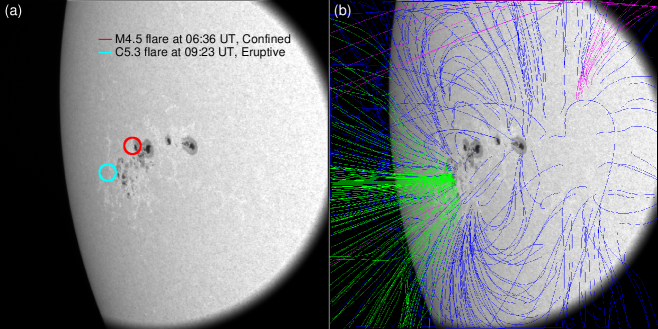
Finally we discuss active regions in terms of productivity of CME-associated flares. First, we point out that several CME-associated flares occurred in tiny active regions or in regions without sunspots (therefore without NOAA region numbers). According to Table 3, as many as ten CME-associated flares occurred in AR 10956. They are predominantly B-class flares and there was no M-class flare from this region (Table 1). In contrast, flares in AR 10960, including 10 M-class and 17 C-class flares, are hardly CME-associated. It is speculated that the co-existence of bipoles following and not following Hale’s law Bone et al. (2009) in AR 10956 may have made the difference in terms of productivity of CME-associated flares. This special configuration may be more important than the sunspot area, the parameter (Schrijver, 2007), and the Mount Wilson sunspot classification scheme as given in the sixth, seventh and eighth columns of Table 1. Another factor that may affect whether the flare is associated with a CME may be its location with respect to the active region and global magnetic field. Figure 9 compares the locations of flares in AR 10960. Most flares in AR 10960 are confined, and they occur close to the center of the region as encircled in red in Figure 9(a). An exceptionally eruptive flare in AR 10960 is observed on the periphery (encircled in cyan). This is consistent with earlier studies (e.g. Akiyama, Yashiro, and Gopalswamy, 2007; Wang and Zhang, 2007; Liu, 2008) indicating that the overlying and surrounding magnetic field is an important factor to determine if the flare is associated with a CME. Moreover, the field is largely open around the location of the eruptive flare (Figure 9(b)), indicating less strapping force. Another example comes from late March 2008, when three active regions (AR 10987, 10988, and 10989) emerged around the same time in the same hemisphere and in a narrow longitude span of 60∘. In terms of the sunspot area and the parameter, AR 10988 was expected to be more active, but the two energetic CMEs avoided it and occurred in the other regions (Nitta, 2011). It is possible that the presence of open field in AR 10987 and AR 10989, and the lack thereof in AR 10988, may be an important factor.
5 Summary
S-Summary
The main objective of this article is to document the low association of flares with CMEs during the solar minimum following Cycle 23. We have isolated a 34-month period that is not too close to the times of elevated activity in Cycle 23 or 24. We carefully compare EUVI and coronagraph data during the period to associate each flare with a CME. Such an analysis was not part of the EUVI flare catalog compiled by Aschwanden et al. Aschwanden et al. (2009), or the mission-long version recently generated by Aschwanden et al. Aschwanden et al. (2013). It may be relatively straightforward to automate flare detection in high-cadence EUV images. However, it is necessary to compare EUV and white-light images carefully before finding pairs of associated flares and CMEs. Today this is still done manually.
Here we define CMEs as outflows that are not too narrow and are found beyond the heliocentric distance of 5 R, in order to distinguish them from other processes such as waves and jets. In a way we follow the criticism of Patsourakos and Vourlidas Patsourakos and Vourlidas (2009) against the “careless” use of the term “CME”, which may give rise to unnecessary confusion when discussing solar eruptive phenomena. We have found only 35 CME-associated flares, 24 of which are B-class or less intense. This reminds us that a CME can be launched without strong magnetic reconnection responsible for intense flares, even though extremely energetic CMEs tend to be associated with intense flares. Some active region properties, such as the sunspot area, the parameter, and complexity on the basis of the Mount Wilson sunspot classification scheme, may largely account for intense flares. However, CMEs may be more intimately related to other properties, such as the co-existence of bipoles with different polarities, weaker overlying and surrounding field, and proximity to open field regions.
Hudson and Cliver Hudson and Cliver (2001) discussed how to observe CMEs without a coronagraph. The proposed CME signatures in EUV images are often observed in the flares that we study, but none of them are observed in all of the CME-associated flares. We have not tested the association in the opposite direction, i.e. how well do they serve as sufficient conditions for CMEs, except for the case of EUV waves. For EUV waves, 13 of 34 events (38 %) are not associated with CMEs. This indicates that EUV waves may not be as tightly linked with CMEs as often thought (e.g. Cliver et al., 2005; Chen, 2009). This is consistent with the recent work using AIA data Nitta et al. (2013b). The other three observables may also fail to be sufficient conditions for CMEs. In particular, we often see Type III bursts not associated with a CME. Therefore, we still cannot rely on low coronal observations alone to detect and characterize CMEs. Different manifestations of CMEs in the low corona suggest that there may be more than one mecahnism or a particular magnetic topology for launching CMEs.
Acknowledgements
This work has been supported by the NASA STEREO mission under NRL Contract No. N00173-02-C-2035. We thank the referee for useful comments that are largely reflected in the revised manuscript.
References
- Akiyama, Yashiro, and Gopalswamy (2007) Akiyama, S., Yashiro, S., Gopalswamy, N.: 2007, Adv. Space Res. 39, 1467. doi: 10.1016/j.asr.2007.03.033
- Aschwanden et al. (2009) Aschwanden, M.J., Wuelser, J.-P., Nitta, N.V., Lemen, J.R. : 2009, Sol. Phys. 256, 3. doi: 10.1007/s11207-009-9347-4
- Aschwanden et al. (2013) Aschwanden, M.J., Wuelser, J.-P., Nitta, N.V., Lemen, J.R., Freeland, S., Thompson, W.T.: 2013, Sol. Phys., In press.
- Attrill et al. (2007) Attrill, G.D.R., Harra, L.K., van Driel-Gesztelyi, L., Démoulin, P.: 2007, ApJ 656, L101. doi: 10.1086/512854
- Auchère et al. (2008) Auchère, F., Soubrié, E., Bocchialini, K., LeGall, F.: 2008, Sol. Phys. 248, 213. doi: 10.1007/s11207-008-9163-2
- Bein et al. (2011) Bein, B.M., Berkebile-Stoiser, S., Veronig, A.M., Temmer, M., Muhr, N., Kienreich, I., Utz, D., Vršnak, B.: 2011, ApJ 738, 191. doi: 10.1088/0004-637X/738/2/191
- Bone et al. (2009) Bone, L.A., van Driel-Gesztelyi, L., Culhane, J.L., Aulanier, G., Liewer, P.: 2009, Sol. Phys. 259, 31. doi: 10.1007/s11207-009-9427-5
- Bougeret et al. (1995) Bougeret, J.-L., Kaiser, M.L., Kellogg, P.J., Manning, R., Goetz, K., Monson, S.J., Monge, N., Friel, L., Meetre, C.A., Perche, C., Sitruk, L., Hoang, S.: 1995, Space Sci. Rev. 71, 231. doi: 10.1007/BF00751331
- Bougeret et al. (2008) Bougeret, J.-L., Goetz, K., Kaiser, M.L., Bale, S.D., Kellogg, P.J., Maksimovic, M., Monge, N., Monson, S.J., Astier, P.L., Davy, S., Dekkali, M., Hinze, J.J., Manning, R.E., Aguilar-Rodriguez, E., Bonnin, X., Briand, C., Cairns, I.H., Cattell, C.A., Cecconi, B., Eastwood, J., Ergun, R.E., Fainberg, J. Hoang, S., Huttunen, K.E.J., Krucker, S., Lecacheux, A., MacDowall, R.J., Macher, W., Mangeney, A., Meetre, C.A., Moussas, X., Nguyen, Q.N., Oswald, T.H., Pulupa, M., Reiner, M.J., Robinson, P.A., Rucker, H., Salem, C., Santolik, O., Silvis, J.M., Ullrich, R., Zarka, P., Zouganelis, I.: 2008, Space Sci. Rev. 136, 487. doi: 10.1007/s11214-007-9298-8
- Brueckner et al. (1995) Brueckner, G.E., Howard, R.A., Koomen, M.J., Korendyke, C.M., Michels, D.J., Moses, J.D., Socker, D.G., Dere, K.P., Lamy, P.L., Llebaria, A., Bout, M.V., Schwenn, R., Simnett, G.M., Bedford, D.K., Eyles, C.J.: 1995, Sol. Phys. 162, 357. doi: 10.1007/BF00733434
- Chen (2009) Chen, P.F.: 2009, ApJ 698, L112. doi: 10.1088/0004-637X/698/2/L112
- Chen (2011) Chen, P.F.: 2011, Living Rev. Solar Phys. 8, 1. doi: 10.12942/lrsp-2011-1
- Cliver et al. (2005) Cliver, E.W., Laurenza, M., Storini, M., Thompson, B.J.: 2005, ApJ 631, 604. doi: 10.1086/432250
- Cohen et al. (2009) Cohen, O., Attrill, G.D.R., Manchester, W.B., Wills-Davey, M.J.: 2009, ApJ 705, 587. doi: 10.1088/0004-637X/705/1/587
- Delaboudinière et al. (1995) Delaboudinière, J.-P., Artzner, G.E., Brunaud, J., Gabriel, A.H., Hochedez, J.F., Millier, F., Song, X.Y., Au, B., Dere, K.P., Howard, R.A., Kreplin, R., Michels, D.J., Moses, J.D., Defise, J.M., Jamar, C., Rochus, P., Chauvineau, J.P., Marioge, J.P., Catura, R.C., Lemen, J.R., Shing, L., Stern, R.A., Gurman, J.B., Neupert, W.M., Maucherat, A., Clette, F., Cugnon, P., van Dessel, E.L.: 1995, Sol. Phys. 162, 291. doi: 10.1007/BF00733432
- Downs et al. (2011) Downs, C., Roussev, I.I., van der Holst, B., Lugaz, N., Sokolov, I.V., Gombosi, T.: 2011, ApJ 728,2. doi: 10.1088/0004-637X/728/1/2
- Freeland and Handy (1998) Freeland, S.L. and Handy, B.N.: 1998, Sol. Phys. 182, 497. doi: 10.1023/A:1005038224881
- Gopalswamy, et al. (2005) Gopalswamy, N., Yashiro, S., Liu, Y., Michalek, G., Vourlidas, A., Kaiser, M.L., Howard, R.A.: 2005, J. Geophys. Res. 110, A09S15. doi: 10.1029/2004JA010958
- Handy et al. (1999) Handy, B.N., Acton, L.W., Kankelborg, C.C., Wolfson, C.J., Akin, D.J., Bruner, M.E., Caravalho, R., Catura, R.C., Chevalier, R., Duncan, D.W., Edwards, C.G., Feinstein, C.N., Freeland, S.L., Friedlaender, F.M., Hoffmann, C.H., Hurlburt, N.E., Jurcevich, B.K., Katz, N.L., Kelly, G.A., Lemen, J.R., Levay, M., Lindgren, R.W., Mathur, D.P., Meyer, S.B., Morrison, S.J., Morrison, M.D., Nightingale, R.W., Pope, T.P., Rehse, R.A., Schrijver, C.J., Shine, R.A., Shing, L., Strong, K.T., Tarbell, T.D., Title, A.M., Torgerson, D.D., Golub, L., Bookbinder, J.A., Caldwell, D., Cheimets, P.N., Davis, W.N., Deluca, E.E., McMullen, R.A., Warren, H.P., Amato, D., Fisher, R., Maldonado, H., Parkinson, C.: 1999, Sol. Phys. 187, 229. doi: 10.1023/A:1005166902804
- Howard et al. (2008) Howard, R.A., Moses, J.D., Vourlidas, A., Newmark, J.S., Socker, D.G., Plunkett, S.P., Korendyke, C.M., Cook, J.W., Hurley, A., Davila, J.M., Thompson, W.T., St Cyr, O.C., Mentzell, E., Mehalick,K., Lemen, J.R., Wuelser, J.-P., Duncan, D.W., Tarbell, T.D., Wolfson, C.J., Moore, A., Harrison, R.A., Waltham, N.R., Lang, J., Davis, C.J., Eyles, C.J., Mapson-Menard, H., Simnett, G.M., Halain, J.P., Defise, J.M., Mazy, E., Rochus, P., Mercier, R., Ravet, M.F., Delmotte, F., Auchère, F., Delaboudinière, J. P., Bothmer, V., Deutsch, W., Wang, D., Rich, N., Cooper, S., Stephens, V., Maahs, G., Baugh, R., McMullin, D., Carter, T.: 2008, Space Sci. Rev. 136, 67. doi: 10.1007/s11214-008-9341-4
- Hudson and Cliver (2001) Hudson, H.S., Cliver, E.W.: 2001, J. Geophys. Res. 106, 25199. doi: 10.1029/2000JA004026
- Kaiser et al. (2008) Kaiser, M.L., Kucera, T.A., Davila, J.M., St.Cyr, O.C., Guhathakurta, M., Christian, E.: 2008, Space Sci. Rev. 136, 5. doi: 10.1007/s11214-007-9277-0
- Kienreich, Temmer, and Veronig (2009) Kienreich, I. W., Temmer, M., Veronig, A.M.: 2009, ApJ 703, L118. doi: 10.1088/0004-637X/703/2/L118
- Kim et al. (2005) Kim, Y.-H., Moon, Y.-J., Cho, K.-S., Kim, K.-S., Park, Y.D.: 2005, ApJ 622, 1240. doi: 10.1086/428031
- Lemen et al. (2012) Lemen, J.R., Title, A.M., Akin, D.J., Boerner, P.F., Chou, C., Drake, J.F., Duncan, D.W., Edwards, C.G., Friedlaender, F.M., Heyman, G.F., Hurlburt, N.E., Katz, N.L., Kushner, G.D., Levay, M., Lindgren, R. W., Mathur, D. P., McFeaters, E.L., Mitchell, S., Rehse, R.A., Schrijver, C.J., Springer, L.A., Stern, R.A., Tarbell, T.D., Wuelser, J.-P., Wolfson, C.J., Yanari, C., Bookbinder, J.A., Cheimets, P.N., Caldwell, D., DeLuca, E.E., Gates, R., Golub, L., Park, S., Podgorski, W.A., Bush, R.I., Scherrer, P.H., Gummin, M.A., Smith, P., Auker, G., Jerram, P., Pool, P., Soufli, R., Windt, D.L., Beardsley, S., Clapp, M., Lang, J., Waltham, N.: 2012, Solar Phys. 275, 17. doi: 10.1007/s11207-011-9776-8
- Lin et al. (2002) Lin, R.P., Dennis, B.R., Hurford, G.J., Smith, D.M., Zehnder, A., Harvey, P.R., Curtis, D.W., Pankow, D., Turin, P., Bester, M., Csillaghy, A., Lewis, M., Madden, N., van Beek, H.F., Appleby, M., Raudorf, T., McTiernan, J., Ramaty, R, Schmahl, E., Schwartz, R., Krucker, S., Abiad, R., Quinn, T., Berg, P., Hashii, M., Sterling, R., Jackson, R., Pratt, R., Campbell, R.D., Malone, D., Landis, D., Barrington-Leigh, C.P., Slassi-Sennou, S., Cork, C., Clark, D., Amato, D., Orwig, L., Boyle, R., Banks, I.S., Shirey, K., Tolbert, A.K., Zarro, D., Snow, F., Thomsen, K., Henneck, R., McHedlishvili, A., Ming, P., Fivian, M., Jordan, J., Wanner, R., Crubb, J., Preble, J., Matranga, M., Benz, A., Hudson, H., Canfield, R.C., Holman, G.D., Crannell, C., Kosugi, T., Emslie, A.G., Vilmer, N., Brown, J.C., Johns-Krull, C., Aschwanden, M., Metcalf, T., Conway, A.: 2002, Sol. Phys. 210, 3. doi: 10.1023/A:1022428818870
- Liu (2008) Liu, Y.: 2008, ApJ 679, L151. doi: 10.1086/589282
- Liu et al. (2012) Liu, W., Ofman, L., Nitta, N.V., Aschwanden, M.J., Schrijver, C.J., Title, A.M., Tarbell, T.D.: 2012, ApJ 753, L52. doi: 10.1088/0004-637X/753/1/52
- Long et al. (2008) Long, D.M., Gallagher, P.T., McAteer, R.T.J., Bloomfield, D.S. : 2011, ApJ 680, L81. doi: 10.1086/589742
- Ma et al. (2010) Ma, S., Attrill, G.D.R., Golub, L., Lin, J.: 2010, ApJ 722, 289. doi: 10.1088/0004-637X/722/1/289
- MacQueen and Fisher (1983) MacQueen, R.M., Fisher, R.R.: 1983, Sol. Phys. 89, 89. doi: 10.1007/BF00211955
- Munro et al. (1979) Munro, R.H., Gosling, J.T., Hildner, E., MacQueen, R.M., Poland, A.I., Ross, C.L.: 1979, Sol. Phys. 61, 201. doi: 10.1007/BF00155456
- Nitta (2011) Nitta, N.V.: 2011, Sol. Phys. 274, 219. doi: 10.1007/s11207-011-9806-6
- Nitta and Akiyama (1999) Nitta, N., Akiyama, S.: 1999, ApJ 525, L57. doi: 10.1086/312322
- Nitta et al. (2013a) Nitta, N.V., Aschwanden, M.J., Boerner, P.F., Freeland, S.L., Lemen, J.R., Wuelser, J.-P.: 2013, Sol. Phys. in press. doi: 10.1007/s11207-013-0307-7
- Nitta et al. (2013b) Nitta, N.V., Schrijver, C.J., Title, A.M., Liu, W.: 2013 ApJ submitted.
- Patsourakos and Vourlidas (2009) Patsourakos, S., Vourlidas, A.: 2009, ApJ 700, L182. doi: 10.1088/0004-637X/700/2/L182
- Patsourakos and Vourlidas (2012) Patsourakos, S., Vourlidas, A.: 2012, Sol. Phys. 281, 187. doi: 10.1007/s11207-012-9988-6
- Patsourakos et al. (2009) Patsourakos, S., Vourlidas, A., Wang, Y.-M., Stenborg, G., Thernisien, A.: 2009, Sol. Phys. 259, 49. doi: 10.1007/s11207-009-9386-x
- Pesnell, Thompson, and Chamberlin (2012) Pesnell, W.D., Thompson, B.J., Chamberlin, P.C.: 2012, Sol. Phys. 275, 3. doi: 10.1007/s11207-011-9841-3
- Podladchikova and Berghmans (2005) Podladchikova, O., Berghmans, D.: 2005, Sol. Phys. 228, 265. doi: 10.1007/s11207-005-5373-z
- Robbrecht and Berghmans (2004) Robbrecht, E., Berghmans, D.: 2004, A&A 425, 1097. doi: 10.1051/0004-6361:20041302
- Robbrecht, Berghmans and van der Linden (2009) Robbrecht, E., Berghmans, D., van der Linden, R.A.M.: 2009, ApJ 691, 1222. doi: 10.1088/0004-637X/691/2/1222
- Robbrecht et al. (2009) Robbrecht, E., Patsourakos, S., Vourlidas, A.: 2009, ApJ 701, 283. doi: 10.1088/0004-637X/701/1/283
- Scherrer et al. (1995) Scherrer, P., Bogart, R.S., Bush, R.I., Hoeksema, J.T., Kosovichev, A., Schou, J., Rosenberg, W., Springer, L., Tarbell, T., Title, A., Wolfson, C., Zayer, I., The MDI Engineering Team: 1995, Sol. Phys. 162, 129. doi: 10.1007/BF00733429
- Schrijver (2007) Schrijver, C.J.: 2007, ApJ 655, L117. doi: 10.1086/511857
- Sheeley et al. (1999) Sheeley, N.R., Jr., Walters, J.H., Wang, Y.-M., Howard, R.A.: 1999, J. Geophys. Res. 104, 24739. doi: 10.1029/1999JA900308
- Temmer et al. (2010) Temmer, M., Veronig, A.M., Kontar, E.P., Krucker, S., Vršnak: 2010, ApJ 712, 1410. doi: 10.1088/0004-637X/712/2/1410
- Thompson and Myers (2009) Thompson, B.J., Myers, D.C.: 2009, ApJS 183, 225 doi: 10.1088/0004-637X/183/2/225
- Tomczak and Chmielewska (2012) Tomczak, M., Chimielewska, E.: 2010, ApJS 199, 10 doi: 10.1088/0067-0049/199/1/10
- Veronig et al. (2010) Veronig, A.M., Muhr, N., Kienreich, I.W., Temmer, M., Vršnak, B.: 2010, ApJ 716, L57. doi: 10.1088/2041-8205/716/1/L57
- van Driel-Gesztelyi (1998) van Driel-Gesztelyi, L.: 1998, In Allisandrakis, C.E. and Schimieder, B. (eds.), Three-Dimensional Structure of Solar Active Regions, CS-155, Astron. Soc. Pac., 202.
- Wang and Zhang (2007) Wang, Y., Zhang, J.: 2007, ApJ 665, 1428. doi: 10.1086/519765
- Warmuth and Mann (2011) Warmuth, A., Mann, G.: 2011, A&A 532, A151. doi: 10.1051/0004-6361/201116685
- Wills-Davey and Thompson (1999) Wills-Davey, M.J., Thompson, B.J.: 1999, Sol. Phys. 190, 467 doi: 10.1023/A:1005201500675
- Wülser et al. (2004) Wuelser, J.-P., Lemen, J.R., Tarbell, T.D., Wolfson, C.J., Cannon, J.C., Carpenter, B.A., Duncan, D.W., Gradwohl, G.S., Meyer, S.B., Moore, A.S., Navarro, R.L., Pearson, J.D., Rossi, G.R., Springer, L.A., Howard, R.A., Moses, J.D., Newmark, J.S., Delaboudinière, J.-P., Artzner, G.E., Auchère, F., Bougnet, M., Bouyries, P., Bridou, F., Clotaire, J.-Y., Colas, G., Delmotte, F., Jerome, A., Lamare, M., Mercier, R., Mullot, M., Ravet, M.-F., Song, X., Bothmer, V., Deutsch, W.: 2004, Proc. SPIE 5171, 111. doi: 10.1117/12.506877
- Yan et al. (2006) Yan, Y., Pick, M., Wang, M., Krucker, S., Vourlidas, A.: 2006, Sol. Phys. 239, 277. doi: 10.1007/s11207-006-0202-6
- Yashiro et al. (2004) Yashiro, S., Gopalswamy, N., Michalek, G., St. Cyr, O.C., Plunkett, S.P., Rich, N.B., Howard, R.A.: 2004, J. Geophys. Res. 109, A07105. doi: 10.1029/2003JA010282
- Yashiro et al. (2005) Yashiro, S., Gopalswamy, N., Akiyama, S., Michalek, G., Howard, R.A.: 2005, J. Geophys. Res. 110, A12S05. 10.1029/2005JA011151
- Yashiro et al. (2008) Yashiro, S., Michalek, G., Akiyama, S., Gopalswamy, N., Howard, R.A.: 2008, ApJ 673, 1174. doi: 10.1086/524927
- Zhang et al. (2001) Zhang, J., Dere, K.P., Howard, R.A., Kundu, M.R., White, S.M.: 2001, ApJ 559, 452. doi: 10.1086/323212