Radio emission at the centre of the galaxy cluster Abell 3560: evidence for core sloshing?
Abstract
Context. The present paper deals with the interplay between the radio emission associated with the dominant galaxy in clusters and the properties of the surrounding intracluster medium (ICM), studied on the basis of its X–ray emission.
Aims. Previous radio observations of the galaxy cluster A 3560, located in the Shapley Concentration core, revealed the presence of complex radio emission associated with the brightest cluster member. To understand the origin of such radio emission we performed a detailed multiwavelength study, with high quality proprietary data in the radio and X–ray bands, and by means of optical data available in the literature.
Methods. We observed the cluster with the Giant Metrewave Radio Telescope, the Very Large Array and the Australia Telescope Compact array at 240 and 610 MHz, 1.28, 1.4, 2.3, 4.8 and 8.4 GHz, and performed a detailed morphological and spectral study of the radio emission associated with the brightest cluster galaxy (BCG). Furthermore, we observed the cluster with the – and observatories, to derive the properties of the intracluster gas. Finally, we made use of literature data to obtain the bidimensional distribution of the galaxies in the cluster.
Results. The radio emission, associated with the north–eastern nucleus of the dumb–bell BCG, is the result of two components: an active radio galaxy, with jets and lobes, plus aged diffuse emission, which is not refurbished with new electrons at present. Our data show that the radio active nucleus of the BCG has extended X–ray emission, which we classify as a low–luminosity corona. A residual image of the – brightness distribution shows the presence of a spiral–like feature, which we interpret as the signature of gas sloshing. The presence of a sub–group is clear in the surface brightness residual map, and it is supported also by the – temperature analysis. The optical bidimensional analysis shows substructure in A 3560. A galaxy clump has been found at the location of the X–ray sub–group, and another group is present south of the cluster core, in the region where the spiral–like feature has been detected. The aged part of the radio emission closely follows the spiral pattern of the X–ray residual brightness distribution, while the two active radio lobes are bent in a completely different direction. We conclude that the complex radio emission associated with the cluster BCG is the result of a minor merger event in A 3560. The aged diffuse emission is strongly affected by the sloshing motion in the intracluster gas, and most likely bears information on the trajectory of the cluster BCG during the dynamical evolution of the cluster. On the other hand, the bent jets and lobes of the current radio AGN activity may reflect a complex gas velocity field in the innermost cluster regions and/or sloshing–induced oscillations in the motion of the cD galaxy.
Key Words.:
radio continuum: galaxies - galaxies: clusters: general - galaxies: clusters: individual: A 35601 Introduction
The central regions of galaxy clusters are sites of wonder. The bright magnitude of the central dominant galaxies (often showing multiple nuclei), the distribution of the intracluster medium (ICM), visible through thermal Bremsshtrahlung emission in the X–ray band, the morphology of the non–thermal radio emission associated with the central galaxy and other cluster members, and, in a number of cases, the diffuse radio emission coming from the ICM itself, are the observational signatures of the processes leading to formation of clusters, and bear invaluable information on their dynamical state.
The brightest cluster galaxies (BCGs), the most massive and luminous elliptical galaxies in the Universe, show extreme broad band properties, most likely related to their formation history, i.e. galaxy mergers and accretion in a hierarchical scenario of cluster formation (Lin & Mohr lin04 (2004), Bernardi et al. bernardi06 (2006)). They are usually active in the radio band: the fraction of radio loud BCGs is much higher than for the other elliptical galaxies, reaching up to 30% for L W Hz-1, and their radio luminosity function is the highest among elliptical galaxies (Best et al. best07 (2007)). The radio loud BCGs are usually transition objects between Fanaroff–Riley (Fanaroff & Riley fr74 (1974)) type I and II radio galaxies (Owen & Laing owen89 (1989)), and in many cases their morphology clearly reflects a strong interaction between the radio plasma and the dense ICM in the central cluster regions: the radio jets and lobes are often distorted and bent in a wide–angle shape, most likely as a consequence of a number of mechanisms, such as “cluster weather”(Burns burns98 (1998); Mendygral et al. mendygral12 (2012)), bulk motions in the ICM induced by the dynamical accretion of clusters, galaxy motion with respect to the ICM.
It has been recently proposed that merger–induced gas sloshing in the central regions of galaxy clusters may be responsible for the bent morphology of the central radio galaxy (Clarke et al. clarke04 (2004); Ascasibar & Markevitch ascasibar06 (2006); Paterno–Mahler et al. pm13 (2013)). This mechanism may also provide the turbulence needed to re–accelerate the relativistic electrons responsible for the emission in “mini–halos” (Giacintucci & Mazzotta giacintucci08 (2008); ZuHone et al. zuhone13 (2013); Giacintucci et al. in prep.), diffuse steep spectrum synchrotron radio sources with linear size of the order of 500 kpc which are found in an increasing number of dynamically relaxed clusters (Giacintucci et al. 2011a and references therein).
With the advent of the Chandra and XMM–Newton X–ray observatories, over the past decade it has become clear that the interplay between the radio emission and the ICM in the central regions of galaxy clusters and groups may take the form of mechanical feedback to the ICM to prevent gas cooling (see McNamara & Nulsen mcnamara07 (2007) and mcnamara12 (2012)). Indeed, a large fraction of massive galaxy clusters and groups have cooling regions centered on the radio loud cluster dominant galaxy, and a direct observational link between the active galactic central nucleus and the cooling ICM has been clearly established (i.e., Sun sun09 (2009); Birzan et al. birzan08 (2008); Mittal et al. mittal09 (2009); Birzan et al. birzan12 (2012)). Combined radio/X–ray studies show several impressive examples of cavities in the X–ray brightness distribution filled by radio lobes in rich clusters (some examples are Perseus, Fabian et al. fabian11 (2011) and references therein; MS 0735+7421, Gitti et al. gitti07 (2007) and McNamara & Nulsen mcnamara12 (2012); Hydra A, Gitti et al. gitti11 (2011)) as well as in poor groups (i.e. HCG 62, Gitti et al. gitti10 (2010); NGC 5044, David et al. david11 (2011); the “group survey” performed with the Giant Metrewave Radio Telescope, GMRT, Giacintucci et al. 2011b ). Observational support to the AGN/ICM feedback is finally provided by the evidence for recurrent bursts of radio activity from the central galaxy (e.g. NGC 1407, Giacintucci et al. giacintucci12 (2012)) resulting in the presence of multiple cavities filled with radio emitting relativistc plasma (i.e. A 262, Clarke et al. clarke09 (2009); NGC 5044, David et al. david11 (2011); NGC 5813, Randall et al. randall11 (2011)).
In the context of the interaction between the central radio galaxy and the
intracluster medium in galaxy clusters, A 3560 represents an intriguing case.
The cluster (z=0.048, richness class 3,
Lh-2erg s-1,
T=3.8 keV111We adopt a
CDM cosmology, with ,
H0=71 km s-1Mpc-1. At the distance of A 3560 1′′=0.928
kpc., Bardelli et al. bardelli02 (2002), hereinafter B02) is located
(corresponding to a projected distance of 3.3 Mpc) south
of the A 3558 cluster complex, the most massive structure in the Shapley
Concentration, an exceptional region in the southern sky where cluster
mergers and group accretion are still ongoing at the present cosmological
epoch (Bardelli et al. 1998a and 1998b ).
Beppo–SAX observations of A 3560 show that the ICM distribution is
drop–shaped on the large scale, with a tail pointing north, in the direction
of the A 3558 complex (B02). The X–ray brightness peak is off–centered
from the centroid of the large scale gas distribution, and is coincident with
the position of the BCG.
The cluster radio emission is dominated by the powerful radio galaxy
J 1332–3308 (RA,
Dec,
P),
associated with one of the two nuclei of the dumb–bell BCG.
1.4 GHz and 5 GHz images at arcsecond resolution (B02), obtained with the
Very Large Array (VLA, Socorro, New Mexico), clearly show a complex radio
emission, as it is often found at the centre of galaxy clusters. Beyond the
activity associated with the north–eastern component of the dumb–bell
system, consisting of a core and two extended lobes, other features are
visible in those images, whose connection with the nuclear activity is not
obvious. B02 concluded that the unusual and complex morphology of
J 1332–3308 could be either due to cluster weather, or the result of
recurrent activity in the BCG.
Here we present a detailed multiwavelength study of J 1332–3308 and of the properties of the ICM in A 3560, performed with the aim to understand the origin of the various components of the radio emission. Our analysis is based on data taken with the GMRT, VLA and Australia Telescope Compact Array (ATCA) over the frequency range 240 MHz – 8.46 GHz, on XMM–Newton and Chandra proprietary data, and on optical data available in the literature. The paper is organised as follows: in Sect. 2 we describe the radio and X–ray observations and the data analysis; the radio images and radio spectral study are presented in Sect. 3 and 4 respectively; in Sect. 5 we analyze the XMM-Newton and Chandra X–ray data, we examine the optical information from the literature, and perform a combined radio, X–ray and optical study of the cluster. Our results are discussed and interpreted in Sect. 6, and conclusions are given in Sect. 7. Throughout the paper we will use the convention S .
| Project ID | Array | Observing Date | Time | u–v range | ||
|---|---|---|---|---|---|---|
| MHz | MHz | hour | k | |||
| 14TVa01 | GMRT | 12-08-08 | 240 | 8 | 8a | 0.05 – 20 |
| 14TVa01 | GMRT | 12-08-08 | 610 | 32 | 8a | 0.2 – 50 |
| 14TVa01 | GMRT | 16-08-08 | 1280 | 32 | 8a | 0.4 – 90 |
| AV234 | VLA-BnA | 20-06-98 | 1425 | 100 | 0.25b | 1.5 – 60 |
| AV234 | VLA-BnA | 20-06-98 | 4860 | 100 | 0.25b | 5 – 200 |
| AV246 | VLA-CnB | 13-03-00 | 8460 | 100 | 0.25b | 2 – 100 |
| hy13c | ATCA | 17-05-94 | 2366 | 128 | 2.5b | 0.5 – 50 |
2 Observations and data reduction
In order to study the spectrum of the radio emission of J 1332–3308 with at least 5 data points, and possibly reveal emission over a scale larger than that imaged in B02, we performed observations over a wide range of frequencies and angular resolutions. In particular, we observed J 1332–3308 at 240 MHz, 610 MHz and 1.28 GHz with the GMRT; at 1.4 GHz, 4.86 GHz and 8.46 GHz with the VLA. To complete the spectral coverage of our analysis we made use of ATCA archival data at 2.36 GHz. Table 1 provides the details of the observations.
2.1 The GMRT observations
The 1.28 GHz and 610 MHz observations were performed using both the upper
and lower side bands. The observations at 610 MHz and 240 MHz were carried
out using the dual receiver 240/610 MHz. The total observing bandwidth
was 32 MHz at 1.28 GHz and at 610 MHz, and 8 MHz at 240 MHz.
The data were collected in spectral–line mode at all frequencies, i.e. 256
channels at 1.28 GHz and 610 MHz, and 64 channels at 240 MHz, with a spectral
resolution of 125 kHz/channel. The calibration and data reduction were
performed using the NRAO Astronomical Image Processing System (AIPS) package.
An accurate editing was needed to identify and remove the data affected by
radio frequency interference (RFI) at 240 MHz. In order to find a compromise
between the size of the dataset and the need to minimize bandwidth smearing
effects within the primary beam, after bandpass calibration the
channels in each individual dataset were averaged to 6 channels of 1
MHz each at 240 MHz, and 2 MHz each at 610 MHz and 1.28 GHz.
The field of view around A 3560 includes the strong source J 133335–330523
(PKS 1330–328, RA,
Dec), located at
east of the cluster centre, which required multi–field calibration and
imaging. Moreover, at 240 MHz special care was taken to remove the effects of
the strong extended () radio galaxy PKS 1333–33
(Killeen et al. killeen86 (1986)), located at south–east of
the cluster centre222The total flux density of PKS 1333–33, after
correction for the primary beam attenuation, is S Jy,
in very good agreement with the total spectrum obtained using the total
intensity information available in the literature and in the data archives..
After a number of phase self-calibration cycles, we produced the final
images at each frequency. At 1.28 GHz and 610 MHz the upper and lower side
band datasets were self-calibrated separately and then combined to make
the final images. In order to compare the emission at different frequencies
and on different angular scales we produced full resolution and tapered images,
covering a resolution range from
to .
The rms noise level (1) achieved in the final full resolution images is mJy b-1 at 1.28 GHz, mJy b-1 at 610 MHz and mJy b-1 at 240 MHz (see Table 2). The average residual amplitude errors in our data are of the order of 5% at 1.28 GHz and 610 MHz, and of the order of 8% at 240 MHz. The most relevant parameters of the final full resolution images are reported in Table 2.
2.2 The VLA observations
J 1332-3308 was observed with the VLA in the hybrid BnA configuration at 1.4 and 4.86 GHz, and with the CnB configuration at 8.46 GHz (see Table 1) as part of a project devoted to the study the nuclear activity of the extended radio galaxies in the central cluster complexes of the Shapley Concentration (Venturi et al. in prep.). At all frequencies the observing bandwidth was 100 MHz. Following a standard approach, the data were edited, self–calibrated and imaged using AIPS. The 1 rms ranges from mJy b-1 to mJy b-1 to from 4.86 GHz to 1.425 GHz respectively. The residual amplitude errors are of the order of few %. The most relevant parameters of the final full resolution images are reported in Table 2.
| Array | Resolution | P.A. | rms | Stot | |
|---|---|---|---|---|---|
| MHz | ∘ | mJy b-1 | mJy | ||
| GMRT | 240 | 18.611.6 | –3 | 2.0 | 4850 399 |
| GMRT | 610 | 8.25.0 | 0 | 0.30 | 2678 134 |
| GMRT | 1280 | 4.72.1 | 25 | 0.10 | 1289 63 |
| VLA-BnA | 1425 | 4.23.7 | 61 | 0.13 | 1021 31 |
| ATCA | 2366 | 9.46.2 | 2 | 0.15 | 675 34 |
| VLA-BnA | 4860 | 1.71.2 | 13 | 0.020 | 229 12(a) |
| VLA-CnB | 8460 | 2.71.8 | 44 | 0.025 | 213 11 |
Notes: (a) This value is underestimated and should be considered as a lower limit (see Sect. 3.1).
2.3 X-ray observations and data reduction
We complemented the radio information on J 1332–3308 with two X-ray observations on A 3560 performed with XMM–Newton and Chandra, in order to characterize the interaction between the central radio galaxy and the ICM. Details on the observations are provided in Table 3.
| Instrument | Obs.ID | Detector | Exposure (ks) |
|---|---|---|---|
| MOS1 | 29 | ||
| XMM-Newton | 0205450201 | MOS2 | 31 |
| pn | 21 | ||
| Chandra | 12883 | ACIS-S3 |
2.3.1 XMM–Newton data analysis
XMM–Newton observed A 3560 in 2004 for a total exposure of 46 ks. We generated calibrated event files using the SAS software v. and we removed soft proton flares using a double filtering process, first in a hard (10–12 keV) and then in a soft (2–5 keV) energy range. The resulting clean exposure times are 29, 31, and 21 ks for MOS1, MOS2, and pn, respectively. The event files were filtered according to
ATTERN }  and {\verb FLAG } criteria.
Bright point-like sources were detected using a procedure based on the
SAS task  {\verb edetect_chain }  and removed from the event files.
As background files, we merged nine blank field observations,  we
reprojected them to match the source observation and renormalized by the
ratio of the count-rates in an external region and in the hard band to
account for possible temporal variations of the particle background
(more details in Leccardi et al. \cite{leccardi10}).
This procedure does not introduce substantial distortions in the soft
energy band, where the cosmic background components are more important,
because we limited our analysis to regions where the source outshines
the background in the soft band by more than one order of magnitude.\\
For the spectral analysis, we extracted spectra for the three E
IC
detectors, with their corresponding redistribution matrix file (RMF)
and effective area (ARF). We performed spectral fitting within XSPEC
v, jointly for the three detectors in the energy band
keV. We used an absorbed APEC model, leaving as free parameters the
ICM temperature, the metal abundance, and the normalization, while we
fixed the redshift () and to the galactic value
(, Kalberla et al. kalberla (2005))
2.3.2 Chandra data analysis
We obtained an exploratory observation pointed at the centre of A 3560 with Chandra in Cycle 12. The cluster was observed in April 2012 for 20 ks with the ACIS-S instrument. We reduced the observation with the software CIAO v and the calibration database (CALDB) version . We reprocessed data from level 1 event files, following the standard Chandra data-reduction threads333http://cxc.harvard.edu/ciao/threads/index.html. We applied the standard corrections to account for a time-dependent drift in the detector gain and charge transfer inefficiency, as implemented in the CIAO tools. From low surface brightness regions of the active chips we extracted a light-curve ( keV) to identify and excise periods of enhanced background. We detected point sources with the CIAO tool wavdetect.
3 The complex morphology of J 1332–3308
At all frequencies, the field of view of A 3560 is dominated by the radio galaxy J 1332–3308, associated with the dominant dumb–bell central cluster galaxy. The strong source J 133335–330523 is a background object at redshift z 0.08 (see Section 2.1), which becomes relevant at low frequencies, owing to its steep spectrum and less severe primary beam attenuation. The remaining few radio sources in the field are background objects, with and without optical identification.
3.1 The active core and the lobes
Figure 1 shows the radio emission associated with the BCG in A 3560 in decreasing frequency and resolution order. In the left panel we provide the radio emission of J 1332–3308 at 4.86 GHz and 8.46 GHz (red and black contours respectively), imaged at comparable angular resolution, overlaid on the optical red DSS–2 frame. At both frequencies the radio galaxy shows an active nucleus, two extended lobes and further emission south of the southern lobe, referred to as “diffuse emission” hereinafter. The core of the radio emission is associated with the north–eastern nucleus of the dumb–bell system. There is a clear radio emission gap between the core and the lobes of the radio galaxy: only the southern jet becomes visible at (i.e. 14 kpc) from the core, to merge with the southern lobe. We did not classify it as a jet in the 4.8 GHz image presented in B02, due to its worse quality, and referred to it as “filament”. The set of images presented in this paper leaves no doubt on the origin of this feature, which we will refer to as “southern jet” hereinafter.
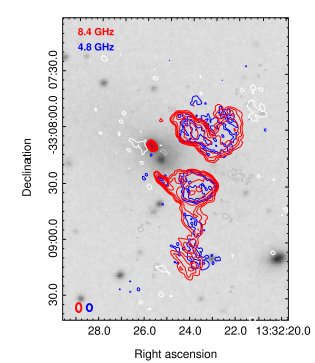
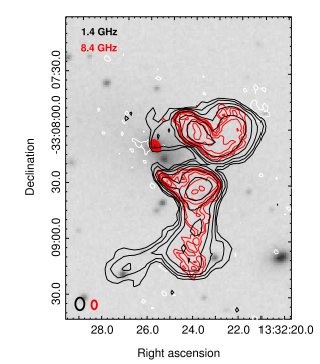
We note that the central u–v gap at 4.86 GHz (see Table 1) does not allow the detection of emission exceeding an angular size of . Since the extended emission is the dominant feature of J 1332–3308 at all frequencies, the 4.86 GHz flux density measured from our observations is considerably underestimated. For this reason we will not consider this frequency in the spectral analysis carried out in Sect. 4.1.
In the central panel of Fig. 1 we report the radio emission at 1.4 GHz and at 8.4 GHz (black and red contours respectively). This overlay shows further interesting features. At 1.4 GHz a brigde of emission connects the radio core with the northern lobe. This feature, clearly visible in the central and right panel of Fig. 1 at 1.4 GHz and 2.3 GHz, is most likely related to the extended radio emission rather than to a jet itself (see Sect. 3.2). Moreover, the radio emission south of the southern lobe is considerably more extended than at the higher frequencies, and it is characterized by a boxy brightness distribution. Finally, a thin “spur” is detected east of the southernmost part of the radio emission (see next subsection). All these features are labelled in the left panel of Fig. 2, for a proper comprehension.
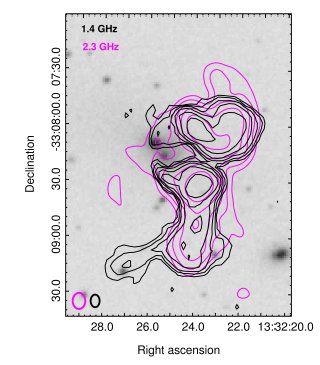
The right panel of Fig. 1 shows the ATCA 2.3 GHz image (blue contours), with the VLA 1.4 GHz contours overlaid for comparison. The ATCA observations were centered on the Shapley Concentration cluster A 3562, located more than 1∘ north of A 3560 (Venturi et al. venturi00 (2000)), thus the emission from J 1333–3308 suffers from severe primary beam attenuation, which reduces the signal–to–noise level in the sky region we are dealing with. A bridge of emission between the core and the lobes is visible in the figure, as already noticed at 1.4 GHz.
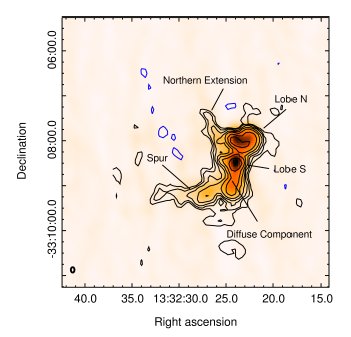
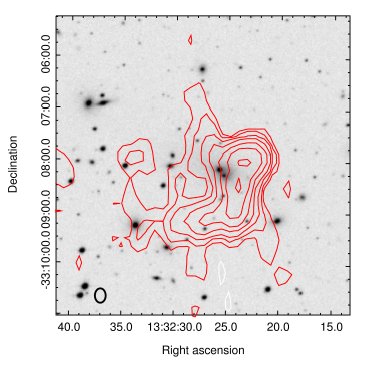
3.2 Large scale radio emission
The left panel of Fig. 2 shows an overlay of the 610 MHz (contours) and 240 MHz GMRT radio emission (colour scale), while the right panel reports the radio contours at 240 MHz overlaid on the red DSS–2 plate. It is clear that at 610 MHz and 240 MHz the extent of J 1332–3308 is considerably larger than at frequencies around and above 1.4 GHz, especially eastwards. Beyond the core, the lobes, the southern jet and the diffuse component, visible at all frequencies, we further image two filamentary structures: the spur, already visible at 1.4 GHz, is considerably more extended here, and the northern extension, located north–east of the core. These are labelled in the left panel of Fig. 2. The 240 MHz contours in the right panel of Fig. 2 clearly show that that the spur and the northern extension seem to form a portion of a ring, east of the location of the BCG.
The lenght of the spur considerably increases with decreasing frequency, going from 28 kpc at 1.4 GHz, to 90 kpc at 240 MHz. Hints of the ”northern extension” are visible at 1.4 GHz, too, however only the low frequency images support the reliability of this feature (left panel of Fig. 2). Assuming that even these faint features belong to J 1332–3308, the total extent of the radio galaxy at 240 MHz is , i.e. 220 kpc.
Our set of images clearly shows that the radio emission associated with the BCG at the centre of A 3560 is very complex. In particular, the connection between the spur, the northern extension and the diffuse component with the other AGN features of J 1332–3308 (radio core and lobes) is not trivial, and may hide a rather complex physical origin of the whole radio emission.
4 Spectral analysis
In order to understand the nature of the various components of the complex
radio emission of J 1332–3308, we used the datasets presented here to
perform a spectral study of this source in the frequency range 240 MHz – 8.46
GHz, by means of the information at 6 different frequencies. As
clarified in Sect. 3.1, the 4.86 GHz data are not used in this analysis.
In the previous section we did not show the 1.28 GHz GMRT images,
since they do not add any information to the 1.4 GHz image.
However, we used the flux density information
at this frequency to perform our spectral analysis.
The total spectrum of the source and the integrated spectra of its components
are discussed in subsection 4.1. The spectral index images of the source are
presented in subsection 4.2.
4.1 Integrated spectra
The total integrated spectrum of J 1332–3308 was derived using the
flux density measurements reported in the last column of Table 2.
To those values we
added the flux density value at 150 MHz derived from the TGSS
(TIFR GMRT Sky Survey444http://tgss.ncra.tifr.res.in/),
which has a resolution of ,
p.a. 30∘, and rms () 11 mJy b-1 in the A 3560
field region.
The total flux density of J 1332–3308 at this frequency is
S Jy.
The flux density measurements at each frequency were obtained by means of
the AIPS task TVSTAT integrating within the 3 contour level at each
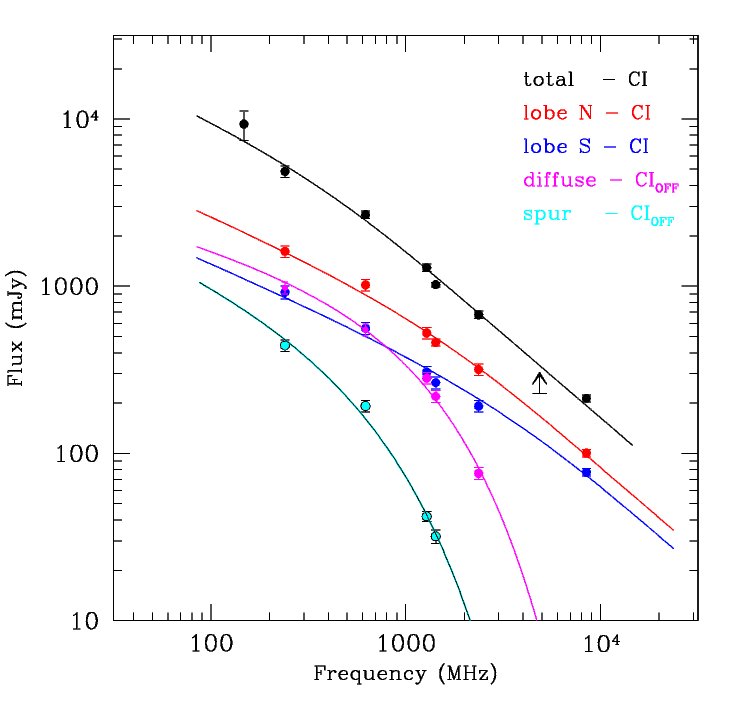
frequency. The total spectrum is reported in Fig. 3 (black), with
the spectral fit overlaid (see Sect. 4.2).
The total flux density of J 1332–3308 is dominated by the extended
components, and the resulting spectrum is steep, with
, if fitted with a single power–law.
The total flux density values of J 1332–3308 reported in Table 1 are
slightly higher than the sum of the individual components at each observing
frequency, the difference increasing from 5% to 10% with
decreasing frequency. This highlights the presence of diffuse emission,
expecially at frequencies 1.4 GHz.
The study of the integrated spectrum of each individual component of the
radio emission of J 1332–3308 required further imaging at resolutions
different than those reported in Figs. 1 and 2, so as to derive flux
density values at comparable resolutions.
The VLA and ATCA images used for the integrated spectra are those presented
in Table 2. At 610 MHz we produced a tapered image with a resolution of
, p.a. -17.9∘, achieving a
1 rms 0.55 mJy b-1 in order to detect all the diffuse
emission (spur and diffuse component).
The core emission of J 1332–3308 can be isolated only at 8.4 and 4.8 GHz
(see Fig. 1), but a consistent estimate of its flux density was made
also at 2.3 GHz and at 1.4 GHz, searching for the peak of the emission
in the core area using the task IMFIT.
No estimate of the core flux density was possible at frequencies below
1.4 GHz.
As pointed out in Sect. 3.2, and clear from Figs. 1 and 2, the size of
the spur increases considerably at decreasing frequency. In order
to estimate its total spectrum we integrated the 1.4 GHz and 610 MHz flux
density over the same region of the 240 MHz emission. The flux density
values of each individual component are reported in Table 3. We point out
that the uncertainties associated with each measurement take into account
the difficulty in isolating the individual components, especially at
low frequency and at resolutions lower than .
| Component | SS | |
|---|---|---|
| MHz | mJy | |
| Lobe N | 8460 | 1005 |
| 4860 | 1196(a) | |
| 2366 | 31825 | |
| 1425 | 46023 | |
| 1280 | 52542 | |
| 610 | 101780 | |
| 240 | 1614129 | |
| Lobe S | 8460 | 774 |
| 4860 | 864(a) | |
| 2366 | 19215 | |
| 1425 | 26521 | |
| 1280 | 30625 | |
| 610 | 56045 | |
| 240 | 100981 | |
| Jet S | 8460 | 7.00.2 |
| 4860 | 4.60.3(a) | |
| 2366 | 172 | |
| 1425 | 262 | |
| 1280 | 313 | |
| 610 | 696 | |
| Diffuse comp. | 8460 | 171 |
| 4860 | 161(a) | |
| 2366 | 766 | |
| 1425 | 21918 | |
| 1280 | 28222 | |
| 610 | 55044 | |
| 240 | 97878 | |
| Core | 8460 | 5.70.2 |
| 4860 | 3.90.3(a) | |
| 2366 | 3.70.2 | |
| 1425 | 1.90.2 | |
| Spur | 1425 | 323 |
| 1280 | 423 | |
| 610 | 19215 | |
| 240 | 44235 |
Notes: (a) See text in Section 3.1.
The spectra of the northern and southern lobes (Fig. 3, red and
blue respectively) are similar in shape, steepness and normalization,
indicating a common origin and evolution.
The northern lobe has an average spectral index
= 0.880.05, slightly steeper than that
of the southern one, = 0.75.
The spectra of both lobes show a flattening at 610 MHz, with
= 0.500.13 and
= 0.630.13 for the northern and southern lobe
respectively. Due to the large uncertainties associated with the low
frequency flux density measurements, these values agree within
1 (see Table 3).
The spectral index of the southern jet (not shown) is
= 0.870.06 (see Table 3), a typical value for
arcsecond scale radio jets. The core shows an inverted spectrum, with
, as
expected for a compact component with optically thick emission. The radio
nucleus is thus currently active.
The spectra of the diffuse component and of the spur (Fig. 3, magenta and cyan respectively) differ considerably from the lobes, suggesting a different evolutionary stage and/or a different origin of the radio emitting plasma. In both cases a pronounced steepening at frequencies MHz is clear: in the frequency range 240–610 MHz the spectral index is 0.620.16 and 0.890.16 respectively for the diffuse components and the spur, while at higher frequencies we have respectively , and .
4.2 Spectral fit and radiative ages
The integrated spectra of the various components of emission of J 1332–3308 provide invaluable information on their radiative ages, which we estimated by fitting our data using the Synage++ package (Murgia murgia01 (2001)). The total spectrum of the source and the curved spectra of the lobes (Fig. 3) are best fitted by a continuous injection model (CI, Kardashev kardashev62 (1962)), in which the radio source is continuously refurbished by a flow of relativistic particles with a power–law energy distribution in a region of constant magnetic field. In all cases we assumed a fixed injection spectral index , which provides the best fit. The best fit values for are reported in Tab. 4.
The major steepening of the diffuse component and of the spur for 1 GHz (Fig. 3) require a composite fit, with injection followed by a nuclear switch–off of the supply of freshly accelerated particles, and a “relic” phase (CIOFF model, Murgia et al. murgia11 (2011)). The best fit is provided assuming a fixed injection spectral index . The best fit values for are reported in Tab. 4.
In both cases we obtained toff/t, where toff/trad is the ratio between the dying phase and the age of the component. This result suggests that for both components the injection of fresh electrons has ceased long ago, and the spectrum is now dominated by radiative losses.
We estimated the radiative age of all components under the assumption of equipartition (see Giacintucci et al. giacintucci12 (2012) for details) and using the break frequency derived from the spectral fit by means of the relation:
where BCMB=3.25(1+z)2. Our results are reported in Table 4.
For the lobes, the equipartition values for the magnetic field and internal pressure are typical of active extended radio galaxies. The derived radiative ages point to a very new cycle of activity, consistent with the inverted spectrum of the core. If we assume that the source is in the plane of the sky, and take into account the bent morphology of the jets, we obtain a plausible value for the advance speed of the two lobes, i.e. v0.06c, consistent with previous studies (e.g., Myers & Spangler myers85 (1985); Scheuer scheuer95 (1995)).
The estimated radiative ages for the diffuse component and the spur deserve a comment. They are of the order of 100–200 Myr, i.e. two orders of magniture older than the lobes. These values should be taken with care, since in both cases considerable mixing with the ICM might have already taken place, however they are very similar to what is found both for dying radio galaxies in clusters (Murgia et al. murgia11 (2011)), and for the aged emission in restarted radio galaxies (e.g. NGC 1407, Giacintucci et al. giacintucci12 (2012)).
We wish to add a final comment of the total spectrum of J 1332–3308 (Fig. 3). Its shape and spectral fit are typical of active radio galaxies, since the flux density of the lobes dominates at all frequencies (as clear from Tab. 3), however the analysis performed on the individual components clearly shows that the total radio emission is actually formed by a blend of an active radio galaxy and aged plasma. Any conclusion drawn from the total spectrum itself would thus suffer from serious biases.
4.3 Spectral index imaging
We imaged the spectral index distribution of the radio emission in
J 1332–3308 in two frequency ranges:
the distribution of provides information on the lobes and on the diffuse component; the
distribution of allows us to address the nature
of the filamentary features (the spur and the northern extension) visible
at low frequencies (see Fig. 2), best suited to trace aged relativistic plasma.
In order to ensure a comparable u–v coverage in the images used to produce
the spectral index distribution in the two frequency ranges, we used the
data in the common portion of
the u–v plane of the respective datasets. As a consequence, the quality
of the individual images used to derive the spectral index distribution
is slightly worse than that of the final images presented in Section 3.
To produce the spectral index image we clipped the images at each
frequency for pixel values below the level.
The resolution of the image is
, while that of
is .
Our results are shown in Fig. 4, with total intensity contours overlaid.
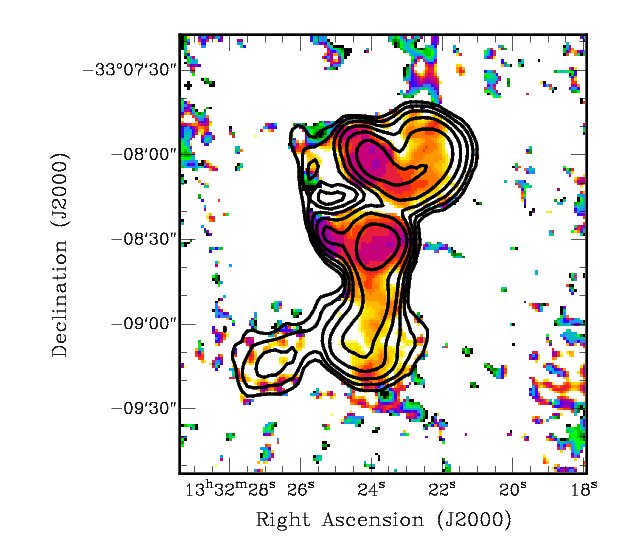
The 1.4–8.4 GHz spectral image (left panel of Fig. 4) clearly shows that the lobes steepen away from the core of the radio emission, with the spectral index in the range 0.6 (purple) to 1.1 (orange) going from the highest to the lowest surface brightness regions respectively. This image shows a continuity of the spectral index distribution from the jet to the southern lobe, consistent with the idea that the jet is refurbishing the lobe with fresh electrons. The spectral index shows substructure along the diffuse component: in the central ridge (orange), then it steepens out to (yellow) going outwards. This trend reflects the sharp boxy surface brightness distribution of this component at all frequencies.
The 240–610 MHz spectral index image (right panel of Fig. 4)
clearly shows that the radio emission in J 1332–3308 consists of two separate
parts: the lobes and the diffuse component form a flat plateau, with values
(orange), where electrons are still characterized by their
original power–law distribution, without significant evolution due to
ageing. On the other hand, the filamentary eastern features of the radio
emission, i.e. the spur and the northern extension, are considerably steeper.
The spectral index of the spur steepens from 1 (purple)
to 1.8 (blue) going eastwards.
The northern extension is the steepest feature, with .
No transverse gradients are visibile, and the spur and northern extension
seem to trace a portion of a ring of steep radio emission.
We point out the consistency between the spectral index values in the
imaging and in the integrated spectra of each individual component in
J 1332–3308.
| Component | P | Beq | Pmin | trad | |
|---|---|---|---|---|---|
| W Hz-1 | MHz | G | dyne cm-2 | Myr | |
| Lobe N | 8.4 | 1780 | 5.8 | 1.9 | 1.9 |
| Lobe S | 5.2 | 4100 | 7.2 | 2.3 | 1.0 |
| Diff. Comp. | 5.1 | 300 | 6.0 | 2.1 | 130 |
| Spur | 2.3 | 300 | 5.0 | 1.3 | 170 |
5 X–ray and optical properties of A 3560
To understand the origin of the unusual radio emission at the centre of A 3560 and investigate a possible connection with the ICM, we made use of proprietary X–ray data and optical literature information to study the thermal properties and dynamical state of the cluster. Details on the X–ray observations and on data reduction are provided in Sec. 2.3.
5.1 ICM structure of A3560
In the left panel of Fig. 5 we show the XMM–Newton image obtained from the combination of MOS1, MOS2 and pn cameras, as described in Rossetti et al. (rossetti07 (2007)). The X–ray surface brightness is asymmetryic, with a north–western elongation in the direction of the A 3558 Shapley cluster complex, with a positional shift between the centre of the inner and outer isophotes, suggestive of a disturbed dynamical state. We used this image to produce a residual image of the surface brightness distribution. We masked out point sources and calculated the average surface brightness, making different assumptions on the centroid of the model and on the geometry of the emission. In particular, we approximated the X–ray isophothes with concentric circular or elliptical annuli, centered either on the peak or on the centroid of the X–ray emission. In each case we then subtracted this symmetric model from the image and divided the resulting image by the model. This approach allows us to provide a quantitative information on the relative asymmetric variations of the source.
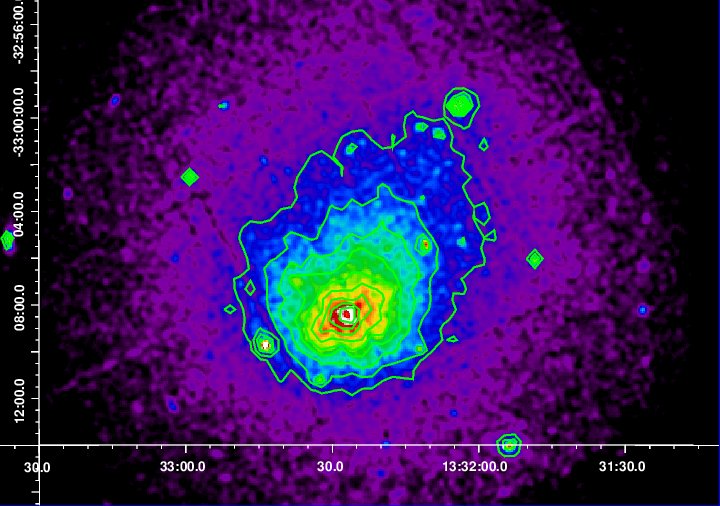
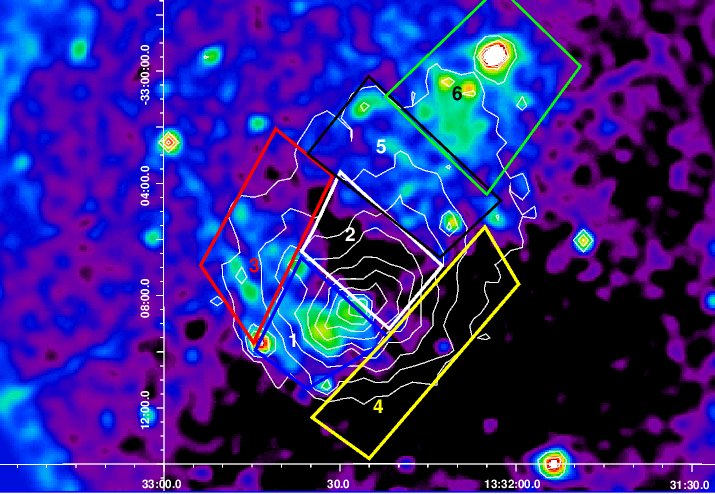
The result of our residual analysis, obtained with the circular symmetry centred on the X–ray peak, is shown in the right panel of Fig. 5. The most remarkable feature in that image is the shape of the excess emission in the southern part of the cluster: it starts from the X–ray surface brightness peak, and peaks just south–east of the cluster centre, following a clockwise spiral–like shape, as clearly visible in region 1. This feature is visible in all residual images we extracted under different geometries, as well as in an unsharp mask analysis performed as further check, and therefore we regard it as reliable. The shape of this feature recalls the spiral residuals which have been observed in a number of clusters (e.g, Laganá et al. lagana08 (2008) and lagana10 (2010)), and in simulated residual images of sloshing clusters (e.g., Ascasibar & Markevitch ascasibar06 (2006), Roediger et al. roediger11 (2011), 2012a and 2012b ). They are interpreted as the signature of gas sloshing induced in the central cluster regions by minor mergers. However, the shape of this excess is not unambiguous and its interpretation is not straightforward: it may also be due to gas of a merging subcluster stripped during the interaction. Another remarkable feature of our residual image is the presence of diffuse excess emission at north–west from the cluster centre, suggestive of substructure (included in region 6 in the right panel of Fig. 7). We will discuss the possible interpretation of both features in Sec. 6.1.
We used the residual image to select regions for spectral analysis, shown in the right panel of Fig. 5. Regions 1 and 3 were chosen to follow the spiral–like surface brightness excess in the inner and outer parts, and regions 2, 4 and 5 as control regions. Region 6 follows the north–western elongation and corresponds to the location of the excess emission. For each region, we extracted and analized spectra as described in Sec. 2.3.1, the best fit parameters are reported in Table 6. The cluster does not show significant temperature variations and we do not have any indication of a cool core, which may support the suggestion from the X–ray image that A3560 is not a relaxed system. Region 6 shows a slightly lower temperature compared to the cluster average, although the difference is only mildly significant. The absence of significant temperature variations is confirmed also by the temperature map we obtained from XMM-Newton data using the technique in Rossetti et al. (rossetti07 (2007)). We do not show the map here since we could not recover significant temperature structure: best fit values in each bin are all in the range keV well consistent within each other and with the values in Table 6, since typical error bars in the XMM-Newton temperature map are of the order keV.
An XMM–Newton temperature analysis of A 3560 was performed also by Hudaverdi et al. (hudaverdi10 (2010)). They also found evidence for a north–western cold peak, with T 3.0 keV, which they proposed to be a sub–cluster. Compared to our analysis, their cold peak is more prominent with respect to the average cluster temperature, however they did not include error estimates, therefore a detailed comparison with our results is not possible.
We performed a metal abundance analysis in the same regions shown in Fig. 5 . Only the central part of the “spiral” (region 1) shows a significant excess with respect to the cluster mean. It is interesting to note that region 2 is located close to the cluster centre, too, but it features a lower metallicity, thus the excess observed in region 1 cannot be explained with the metal abundance peak typically observed in the central region of cool core clusters. A non–central metal abundance excess, located in a region of enhanced surface brightness (and therefore with low entropy) can be interpreted as a “cool core remnant” (Rossetti & Molendi rossetti10 (2010)), i.e. what remains of the cluster cool core after a merger. Alternatively, the enriched gas could also belong to a merging subcluster (Sec. 6.1).
| Region | Temperature (keV) | Metal Abundance (solar) |
|---|---|---|
| 1 (blue) | ||
| 2 (white) | ||
| 3 (red) | ||
| 4 (yellow) | ||
| 5 (black) | ||
| 6 (green) | (fixed) |
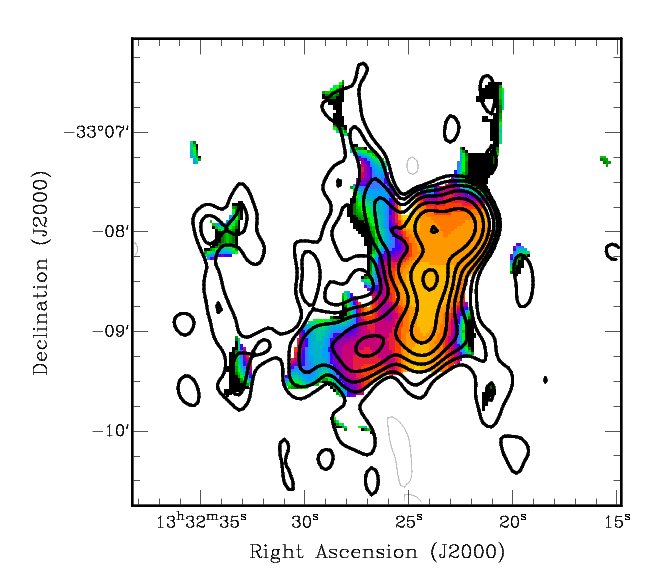
5.2 Connection between radio and X–ray emission
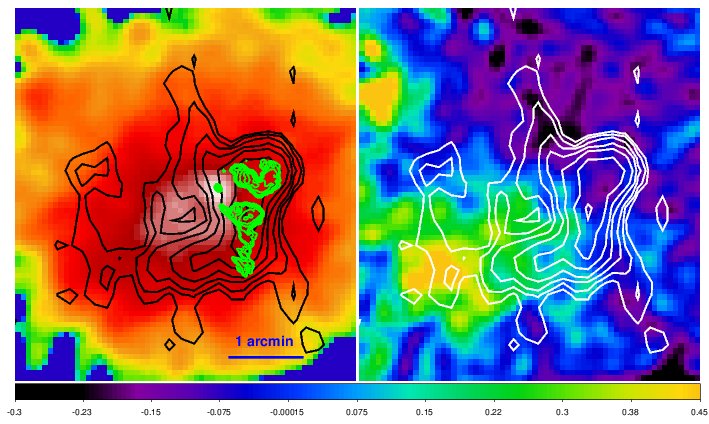
We compared the distribution of the radio emission of J 1332–3308 with the characteristics of the ICM in the central region. In the left panel of Fig. 6 we show a zoom of the XMM image (shown in Fig. 5) with radio contours of J 1332–3308 overlaid. The X–ray image has been smoothed with a gaussian function with FWHM=30′′ .
The emission peak in the XMM image is coincident with the radio active nucleus of the BCG, as clear from the 8.4 GHz radio contours overlaid. Moreover, the X–ray/radio overlay clearly shows that the extended radio emission imaged at 240 MHz east of the active dumb–bell nucleus follows the regions where the X–ray emission is brighter. This is clearly seen also in the right panel of Fig. 6, which zooms into the central region of the residual map: the southern region of the diffuse radio emission and the spur follow the central part of the spiral–like excess discussed in Sec. 5.1. At a qualitative level, the X–ray/radio comparison suggests that the steep spectrum components of the radio emission of J 1332–3308, i.e. the diffuse component, the spur and the northern extension, are strongly influenced by the ICM at the cluster centre.
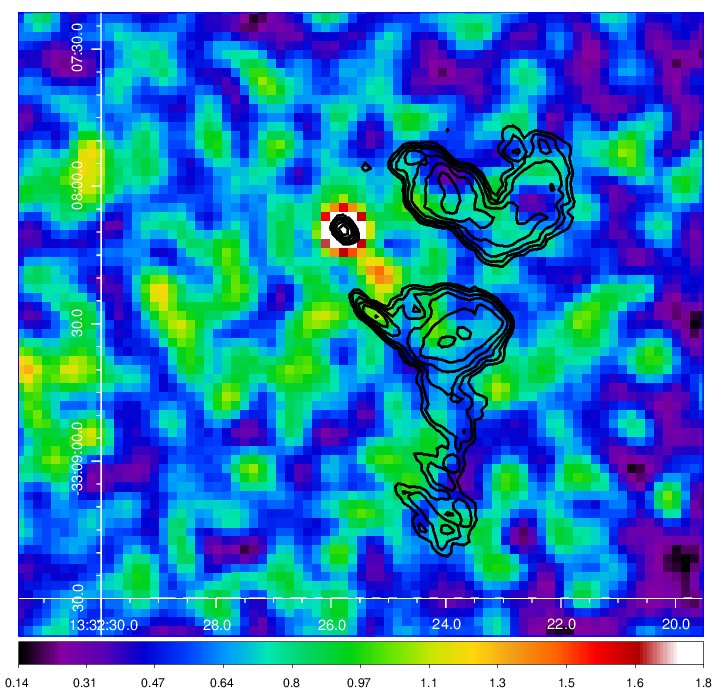
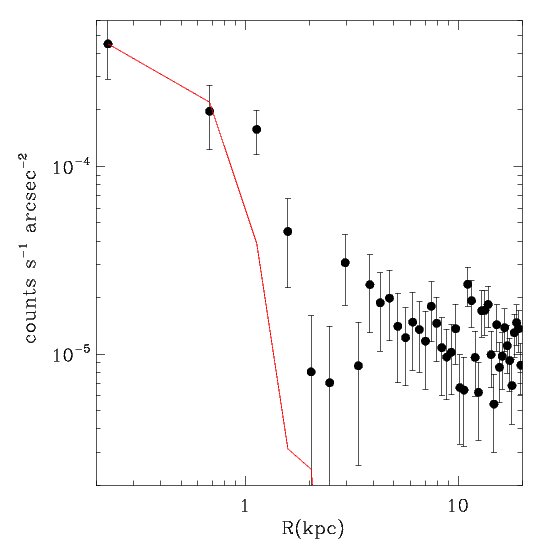
We analyzed the central part of the cluster in more detail by means of a high resolution image (Fig.7, left panel) obtained from our more recent observation: the image is very noisy because of the short exposure time and faintness of the cluster, but we can still recognize a bright rim, corresponding to the more central part of the excess in the residual map, and an X–ray source associated with the north–eastern nucleus of the dumb–bell galaxy. This X–ray source looks more extended than other point–like sources in the field, therefore we extracted a surface brightness profile from the full resolution image and compared it to the PSF.555We calculated the Point Spread Function at the location of the source at keV, using the Chandra Ray Tracing (ChaRT) tool. The result is given in the right panel of Fig. 7, which shows that the X–ray source is qualitatively more extended than the PSF.
From the surface brightness profile, shown in Fig. 7 (right), we subtracted a model composed by the PSF plus a constant to account for the cluster emission, which we estimated fitting the data between 5 and 20 kpc. Below 5 kpc the data exceed the model at more than 6, therefore this source can be considered extended according to Sun et al. (sun07 (2007)). Unfortunately the low number of counts in the observation (34 in the keV energy range) does not allow a full spectral characterization, as it is consistent both with a power–law and with a thermal model. We applied the spectral criterion proposed by Sun et al. (sun07 (2007)) for faint X-ray sources: fitting the spectra with a power–law model the lower limit of the spectral index is larger than , thus the spectrum is more similar to a thermal model with an insignificant iron L–shell hump than to the flatter spectra of AGNs. Therefore, we classify this source as a candidate low–luminosity X–ray corona. Assuming that all the emission from this source is associated with the corona, we provide an upper limit for its luminosity in the keV energy range, , which is consistent with the luminosity of the faint coronae in Sun (sun09 (2009)).
5.3 Galaxy density distribution
Very little redshift information is available in this region of the sky. Willmer et al. (willmer99 (1999)) derived the velocity for 33 galaxies and obtained controversial results with respect to possible subclustering.
In order to describe the dynamical state of A 3560, we collected the redshift data available in the literature. Using the NED database, we found 285 redshifts, mainly from Willmer et al. (willmer99 (1999)) and from the WING Survey (Cava et al. cava09 (2009)). We checked the consistency of the two databases using the information on the 26 common galaxies, and obtained a negligible sistematic shift, i.e. 19 km s-1. The external error on the redshift determination is relatively small, too, i.e. 44 km s-1.
We computed the cluster mean velocity (v) and velocity dispersion () with the bi–weight estimators (Beers et al. beers90 (1990)), and we found v=14656 km s-1 and km s-1 respectively. The value of is well consistent with the X–ray temperature derived from the XMM–Newton observations (Table 5). Statistical tests do not show significant deviation from the gaussianity. However, our redshift sample is biased against the central part of the cluster, and does not allow a proper analysis in the region we are dealing with here.
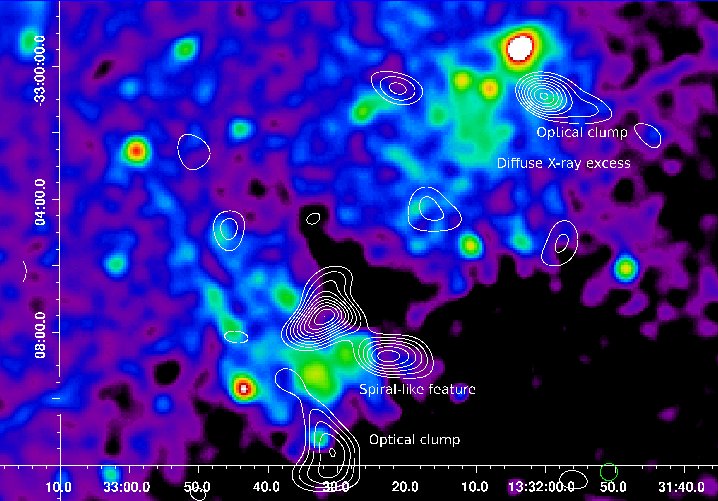
In the X–ray study, we identified a possible substructure north–west of the core which could be undergoing a merger with the main cluster in the plane of the sky, very difficult to detect in the redshift space. We then performed a bi–dimensional analysis in order to detect possible sub–clumps. The WING Survey (Valentinuzzi et al. valentinuzzi09 (2009)) is in principle the best suited database, but unfortunately an instrumental rib is located just on the dominant galaxy, preventing a substructure analysis in this region. We thus used the central part of the APM survey (Irvin irvin85 (1985)), which is limited to R=21.5. To detect substructure, we used the Adaptive Kernel method (DEDICA algorithm) as implemented by Pisani (pisani96 (1996)), and applied to clusters by Bardelli et al. (1998b ). Our results are given in Fig. 8 which shows the substructure analysis over whole cluster field as obtained from the APM catalogue (white contours) overlaid on the X–ray surface brightness redisuals.
The distribution of the galaxies is bimodal at the cluster centre, with
two peaks of comparable mass. The radio BCG is located just between
the two condensations. Two further significant clumps (labelled in Fig.
8) have been detected.
One is located close to the diffuse X–ray brightness residual
emission, while the other is close to the spiral–like X–ray surface
brightness excess at the cluster centre (see Fig. 8, and
regions 6 and 1 respectively in the right panel of Fig. 5).
None of these two optical clumps is coincident with the X–ray
features. However, misplacements between gas and galaxies
have already been observed in some cluster mergers, as expected due to
the different behaviour of the collisional (gas) and the non–collisional
(galaxies and dark matter) components.
Although not used in the analysis of the cluster centre, the WINGS
bidimensional distribution of galaxies supports the existence of these two
clumps, and confirms that they are both off–placed with respect to the
features detected in the X–ray band.
6 Discussion
In this paper we present a detailed radio, X–ray and optical analysis of the cluster A 3560 and of the BCG at its centre, associated with the radio galaxy J 1332–3308. The cluster is located at the southern periphery of the A 3558 cluster complex, in the core of the Shapley Concentration. Our study is based on proprietary high sensitivity radio observations – GMRT at 1280, 610 and 240 MHz; VLA at 1.4, 4.86 and 8.46 GHz; ATCA at 2.3 GHz– and on proprietary XMM–Newton and Chandra data, while the optical analysis was performed using literature and archival information.
The multifrequency radio images show that the radio emission associated with the brightest cluster galaxy at the centre of A 3560 is enigmatic, and cannot be simply interpreted as an active radio galaxy providing the whole relativistic plasma. Moreover, our optical and X–ray analysis suggest that the cluster has recently undergone a minor merger. Our results can be briefly summarized as follows:
-
•
The radio emission associated with the cluster BCG is characterized by an AGN component, with an active core and two lobes, and by extended diffuse emission. The latter is best imaged at frequencies below 1 GHz, it is asymmetric with respect to the active radio galaxy, and extends eastwards with respect to the location of the BCG. The overall size of the diffuse radio emission is 220 kpc. A detailed radio spectral study shows that the diffuse emission has a very steep spectrum, with for MHz. Its radio plasma is aged (t tlobes) and is not currently fed by the active nucleus.
-
•
A morphological comparison between the emission of the radio galaxy and the X–ray surface brightness of the ICM as imaged by XMM–Newton shows a clear correlation of features, the radio emission following the X–ray excess emission.
-
•
The radio core is associated with the northern nucleus of the BCG and with an X–ray extended source in the Chandra image, which we classify as a low–luminosity corona. The radio and X–ray properties of the BCG in A 3560 are consistent with those of coronae in poor cluster BCGs, as found in other studies (Sun sun09 (2009) and references therein).
-
•
The temperature of the ICM, as derived from XMM–Newton observations, is kT3.5 keV. The overall shape of the X–ray surface brightness distribution is elongated in the south–east/north–west direction, with a positional shift between the centre of the inner and outer isophotes, suggestive of an unrelaxed dynamical state. A residual image shows the presence of a spiral structure at the cluster centre, which appears to be associated with the diffuse 240 MHz radio emission. The analysis of the gas temperature is consistent with the presence of a subcluster, located north–west of the cluster centre. Finally, the ICM in the central regions featuring a surface brightness excess is more enriched in metals than the other central parts of the cluster. This may suggest that A 3560 has undergone a cool core phase in an earlier stage of its evolution (Rossetti & Molendi rossetti10 (2010)).
-
•
A bidimensional optical analysis shows that the galaxies in the central cluster region have a bimodal distribution, the two groups having comparable density. Two more clumps are identified: one is located north–west of the cluster centre, and it is the possible optical counterpart of the gas feature detected from the X–ray analysis, the other is located close to the surface brightness excess south of the cluster centre.
6.1 Core sloshing at the centre of A 3560 and its consequences on the radio emission
The interpretation of the dynamical state of A 3560 from the X–ray and optical data (Sec. 5.1) is not straightforward. Our spectral and imaging analysis suggest an unrelaxed dynamical state but the lack of significant thermodynamic features, due to the isothermality of the cluster, does not help in recovering the merging history of this cluster. The only significant variations we detected in the ICM are in the residual image, which shows substructure, possibly associated to a galaxy concentration, to the north–west, and a spiral–like excess, enriched in metals, close to the centre of the cluster.
We propose a scenario where A 3560 is undergoing an off–axis minor merger event, which may have induced gas motions in the cluster core, leaving a signature in the form of a spiral residual. This scenario is similar to the sloshing phenomenon (Ascasibar & Markevitch ascasibar06 (2006)) which usually induces cold fronts in the ICM of the main cluster. We do not observe cold fronts in A 3560: we searched for arc–like features and discontinuities in the XMM-Newton image and profiles, but we could not find any significant indication. However, we cannot rule out the presence of cold fronts in the inner part of the cluster (): unfortunatley, our XMM-Newton data are not well suited to resolve the central region, and the superior angular resolution of Chandra is hampered by the poor statistics of the observation. Moreover, A 3560 is a non cool core cluster, different from the clusters with steep entropy profile which usually host sloshing cold fronts (e.g. Ghizzardi et al. ghizzardi10 (2010)), although with a few notable exceptions (e.g. A2142, Markevitch et al. markevitch00 (2000), Rossetti et al. rossetti13 (2013)). Simulations of off-axis mergers in non cool core clusters (i.e. clusters without a steep entropy profile) show that these mergers induce complex motions in cluster cores and asymmetric gas structure that would be seen in the residual maps but do not generate cold fronts (see Fig. 12 of Ascasibar & Markevitch ascasibar06 (2006)). We suggest a similar “sloshing-like” scenario for A 3560. The identification of the perturber is not trivial, and projection effects may further complicate the interpretation of the observations. Our X–ray and optical analysis suggest that the group located north–west of the cluster core, in the direction of A3558, is the most likely candidate.
Alternatively, the excess close to the cluster centre, enriched in metals, may be associated with stripped gas from a colliding subcluster. A second optical condensation is present just south of the cluster core, close to the feature visible in the X–ray surface brightness residual image (see Fig. 8 and Sect. 5.3). It is thus possible that A 3560 is a multiple merger, and that the X–ray features close to the centre are a direct effect of the interaction, rather than an indirect one as in the sloshing–like scenario.
The properties of the radio emission associated with the BCG support and strengthen the idea of dynamical activity at the cluster centre. The diffuse emission is aged, and not currently fed by nuclear activity. Our estimates of the radiative ages (Sect. 4.2) are consistent with the idea that this older plasma may have been deposited in the ICM by a previous cycle of activity of the BCG, and either left behind by the motion of the BCG around the cluster centre, or affected by the interaction with the ICM environment. In the former scenario, and assuming that the ICM is at rest in the potential well of the cluster, the ring–shaped morphology of the spur (right panel of Fig. 2) contains information on the trajectory of the BCG, in its orbit around the cluster centre. The spectral steepening of the spur going from west to east (right panel of Fig. 4) would suggest an anticlock–wise orbital motion. The size and shape of the possible trajectory (in the plane of the sky) is , and assuming a value for the radiative age of the diffuse emission of the order of t yr (Sect. 4.2) , we obtain an indicative value for the velocity of the BCG of 1000 km s-1, which is very high for cluster BCGs. The most extreme values reported so far for this class of objects are of the order of 6–700 km s-1 (e.g., A 3653, Pimbblet et al. pimbblet06 (2006) and references therein). Our estimate should be taken with care, considering the uncertainties related to the age estimate of the diffuse radio emission, and the over–simplified assumptions on the galaxy velocity and trajectory (see below).
An alternative possibility for the origin of the radio emission of J 1332–3308 is that the aged diffuse emission is dragged and wrapped up by the the gas motion at the cluster centre, as the radio/X–ray overlays in Fig. 6 strongly suggest. This association is naturally explained in the sloshing–like scenario, while it would be only a chance superposition if the gas excess was due to a merging substructure, unrelated with the radio-emitting BCG. For this reason, we favour the former scenario for the merging history of this cluster.
If the north–western group is indeed the perturber of A 3560, then the shape of the diffuse radio emission, and its extension east of the location of the BCG, suggest that the minor merger might have taken place from south–east to north–west. On the other hand, the orientation of the lobes (Fig. 1) shows that at the location of the active nucleus the radio plasma is experiencing a motion in the east–west direction: it is impossible to discriminate between an eastward motion of the BCG, and a velocity field westwards in the ICM. Nevertheless, the overall morphology of the radio emission indicates the presence of a complex velocity field in the inner cluster regions. Ascasibar & Markevitch (ascasibar06 (2006)) proposed that both gas sloshing and the peculiar velocities of cD galaxies can be generated by the same minor merger events. It is possible that the bent morphology of the jets and lobes of J 1332–3308 is the signature of the oscillations of the BCG in A 3560 as consequence of the minor merger. As a final remark, we point out that according to Ascasibar & Markevitch (ascasibar06 (2006)) the trajectory of the dark matter and gas peak in the plane of the merger tend to form a circle (Fig. 4 in their paper), which is consistent with the trajectory derived for the BCG on the basis of the diffuse emission.
Most likely both an orbital motion of the BCG around the cluster centre, and gas sloshing in the ICM are responsible for the peculiar radio emission at the centre of A 3560. Therefore, we can safely conclude that the overall morphology and properties of J 1332–3308 are strongly influenced by the interaction with the external medium, and are the result of the dynamical activity at the cluster centre.
6.2 The low–luminosity X–ray corona of the BCG
Another important piece of information is the presence of a small ( 5 kpc) low–luminosity corona in the inner region of the BCG.
Coronae are common in BCGs both in rich and poor environments, and can be considered scaled versions of cluster cool cores (Sun sun09 (2009)). The 1.4 GHz radio luminosity of J 1332–3308, as well as its morphology, are consistent with the known high radio luminosity corona galaxies. Moreover, the radio power of the BCG and the X–ray properties of A 3560 are consistent with the corona class objects studied in Sun (sun09 (2009)). Indeed if we overlay the upper limit for the X–ray luminosity of the corona and the radio luminosity of J 1332–3308 in Fig. 1 of Sun (sun09 (2009)), this source is not an outlier in the distribution and falls well within the region of low X–ray luminosity high radio power objects in the corona class. Finally, the radio emission of J 1332–3308 shows a clear gap between the nucleus and the lobes (Fig. 1 and Section 3.1), as it has been found in other radio loud galaxies with a corona, both in rich clusters (e.g., NGC 4874 in Coma, Sun et al. sun07 (2007)) and in groups (e.g., AWM 04, O’Sullivan et al. osullivan11 (2011)). All the above provides further support to the suggestion that indeed the BCG in A 3560 hosts a low–luminosity corona.
Sun et al. (sun07 (2007)) showed that the central parts (i.e. 4 kpc) of coronae may survive gas stripping in unrelaxed dense environments, such as minor merger induced sloshing motions, and even major mergers. The long time scale of gas sloshing (of the order of the Gyr), combined with the cool temperatures of coronae, suggest that their lifetime is long, and that some mechanism, beyond the possible replenishment from stellar mass loss, must be present to preserve them. Our data are not suitable to address this point, however we can safely conclude that the detection of a corona in the cD galaxy at the centre of A 3560 is another piece of evidence in favour of the presence of mechanisms preventing the evaporation of galactic coronae.
7 Conclusions
The radio galaxy J 1332–3308, associated with the north–western nucleus
of the dominant cluster galaxy in A 3560, is very peculiar. It consists
of an active component in the form of a core, jets and radio lobes, and of
aged diffuse emission extending over a scale of 220 kpc.
The multiband X–ray and optical analysis, performed to address the origin
of this radio galaxy, supports the idea that A 3560 is a very interesting
example of radio AGN/ICM interaction in a minor merger.
The X–ray observations suggest a minor merger scenario between the main cluster and a group: the surface brightness X–ray residual image shows the presence of a spiral–like feature in the central region, a typical signature of gas sloshing. Moreover, excess emission is detected north–west of the cluster centre, suggestive of a sub–cluster, whose presence is supported also by the temperature analysis.
The galaxy distribution is bimodal at the cluster centre. A third condensation is found north–west, in the direction of the Shapley Concentration core, at the location of the X–ray sub–cluster. Finally, another optical clump is located south of the cluster centre, close to the spiral–like structure seen in the residual X–ray image.
A clear connection is found between the spiral–like feature detected in the residual X–ray image and the diffuse, aged (t yr) component of the radio emission, whose morphology is most likely affected by the gas motion in the cluster central region. The BCG is currently active in the radio band, with an FRI radio galaxy associated with the north–western nucleus. The radio lobes have a radiative age of the order of 1–2 Myr. Their orientation has no connection with the older diffuse emission, and possibly reflects the relative motion between the BCG and the local ICM. A low–luminosity corona was detected in the inner region ( 4 kpc) of the radio loud nucleus of the BCG, but unfortunately, our Chandra exposure is too short to detect a possible extension, which would help to derive information on the current motion of the BCG with respect to the ICM.
Acknowledgements. The authors thank the anonymous referee, whose comments and suggestions improved the paper. We thank M. Murgia for careful reading of the manuscript and fruitful discussion. M.R. acknowledges support by the program “Dote Ricercatori per lo sviluppo del capitale umano nel Sistema Universitario Lombardo”, FSE 2007-2013, Regione Lombardia. S.G. acknowledges the support of NASA through Einstein Postdoctoral Fellowship PF0–110071 awarded by the Chandra X–ray Center (CXC), which is operated by the Smithsonian Astrophysical Observatory (SAO). We thank the staff of GMRT for their help during the observations. GMRT is run by the National Centre for Radio Astrophysics of the Tata Institute of Fundamental Research. The National Radio Astronomy Observatory (NRAO) is a facility of the National Science Foundation operated under cooperative agreement by Associated Universities, Inc. The Australia Telescope Compact Array is part of the Australia Telescope National Facility which is funded by the Commonwealth of Australia for operation as a National Facility managed by CSIRO.
References
- (1) Ascasibar, Y., & Markevitch, M., 2006, ApJ, 650, 102
- (2) Bardelli, S., Zucca, E., Zamorani, G., et al., 1998a, MNRAS296,599
- (3) Bardelli, S., Pisani, A., Ramella, M., et al., 1998b, MNRAS, 300, 589
- (4) Bardelli, S., Venturi, T., Zucca, E., et al., 2002, A&A, 396, 65 (B02)
- (5) Beers, T.C., Flynn, K., Gebhardt K., 1990, AJ, 100,32
- (6) Bernardi, M., Sheth, R.K., Nichol, R.C., et al., 2006, AJ, 131, 2018
- (7) Best, P.N., von Linden, A., Kauffmann, G., et al., 2007, MNRAS, 379, 894
- (8) Birzan, L., McNamara, B.R., Nulsen, P.E.J. et al., 2008, ApJ, 686, 859
- (9) Birzan, L., Rafferty, D. A., Nulsen, P. E. J., et al. 2012, MNRAS, 427, 3468
- (10) Burns, J.O., 1998, Science, 280, 400
- (11) Cava, A., Bettoni D., Poggianti B.M., et al. 2009 A&A, 495, 707
- (12) Clarke, T. E., Blanton, E. L., Sarazin, C. L., 2004, ApJ, 616, 178
- (13) Clarke, T. E., Blanton, E. L., Sarazin, C. L., et al., 2009, ApJ, 697, 1481
- (14) David, L.P., O’Sullivan, E., Jones, C., et al., 2011, ApJ, 728, 162
- (15) Fabian, A.C., Sanders, J.S., Allen, S.W., et al., 2011, MNRAS, 418, 2154
- (16) Fanaroff, B.L., & Riley, J.M., 1974, MNRAS, 167, 31
- (17) Giacintucci, S., & Mazzotta, P., 2008, ApJ, 675L, 9
- (18) Giacintucci, S., Markevitch, M., Brunetti, G., et al., 2011a, A&A, 525, L10
- (19) Giacintucci, S., O’Sullivan, E., Vrtilek, J., et al., 2011b, ApJ, 728, 162
- (20) Giacintucci, S., O’Sullivan, E., Clarke, T.E., et al., 2012, submitted to ApJ
- (21) Gitti, M., McNamara, B.R., Nulsen, P.E.J., et al., 2007, ApJ, 666, 1118
- (22) Gitti, M., O’Sullivan, E., Giacintucci, S., et al., 2010, ApJ, 714, 758
- (23) Gitti, M., Nulsen, P.E.J., David, L.P., et al., 2011, ApJ, 732, 13
- (24) Ghizzardi, S., Rossetti, M. & Molendi, S., 2010, A&A, 516, A32
- (25) Hudaverdi, M., Bourdin, H., Bozkurt, M., et al., 2010, in Advances in Hellenic Astronomy during the IYA09, ASP Conf. Ser., 424, p. 321
- (26) Irwin, M.J., 1985, MNRAS, 214, 575
- (27) Kalberla, P.M.W., Burton, W.B., Hartmann Dap, et al. 2005, A&A, 440, 775
- (28) Kardashev, N.S., 1962, SvA, 6, 317
- (29) Killeen, N.E.B., Bicknell, G.V., Ekers, R.D., 1986, ApJ, 302, 306
- (30) Laganà, T.F., Lima Neto, G. B., Andrade-Santos, F., et al., 2008, A&A, 485, 633
- (31) Laganà, T. F., Andrade-Santos, F., Lima Neto, G. B., 2010, A&A, 511, 15
- (32) Leccardi, A., Rossetti, M., Molendi, S., 2010, A&A, 510, A82
- (33) Lin, Y.-T., & Mohr, J.J., 2004, ApJ, 617, 879
- (34) Markevitch, M., Ponman, T. J.; Nulsen, P. E. J. et al. 2000, ApJ, 541, 542
- (35) McNamara, B.R., & Nulsen, P.E.J., 2007, ARA&A, 45, 117
- (36) McNamara, B.R., & Nulsen, P.E.J., 2012, New Journal of Phys., Vol. 14, Issue 5, p. 5023
- (37) Mendygral, P. J., Jones, T. W., Dolag, K., 2012, ApJ, 750, 166
- (38) Mittal, R., Hudson, D.S., Reiprich, T.H., et al., 2009, A&A, 501, 835
- (39) Murgia, M., 2001, PhD Thesis, University of Bologna
- (40) Murgia, M., Parma, P., Mack, K.-H., et al., 2011, A&A, 526, 148
- (41) Myers, S.T., & Spangler, S.R., 1985, ApJ, 291, 52
- (42) O’Sullivan, E., Giacintucci, S., David, L.P., 2011, MNRAS, 411, 1833
- (43) Owen, F.N., & Laing, R.A., 1989, MNRAS, 238, 357
- (44) Paterno–Mahler, R., Blanton, E., Randall, S.W. et al., 2013, ApJ, 773, 114
- (45) Pimbblet, K.A.; Roseboom, I.G.; Doyle, M.T., 2006, MNRAS, 368, 651
- (46) Pisani, A., 1996,MNRAS, 278, 697
- (47) Randall, S. W., Forman, W. R., Giacintucci, S.;, et al., 2011, ApJ, 726, 86
- (48) Reid, A.D., Hunstead, R.W., & Pierre, M.M., 1998, MNRAS, 296, 351
- (49) Roediger, E., Büggen, M., Simionescu, A., et al., 2011, MNRAS, 413, 2057
- (50) Roediger, E., Zuhone, J. A., 2012a, 419, 1338
- (51) Roediger, E., Lovisari, L., Dupke, R., et al., 2012b, MNRAS, 420, 3632
- (52) Rossetti, M., Ghizzardi, S., Molendi, S., et al., 2007, A&A, 463, 839
- (53) Rossetti, M., Molendi, S., 2010, A&A, 510, 83
- (54) Rossetti, M., Eckert, D., De Grandi S. et al. 2013, A&A, 556, A44
- (55) Scheuer, P.A.G., 1995, MNRAS, 277, 331
- (56) Sun, M., Jones, C., Forman, W., et al., 2007, ApJ, 657, 197
- (57) Sun, M., 2009, ApJ, 704, 1586
- (58) Valentinuzzi, T., Woods, D., Fasano, G., et al., 2009 A&A 501, 851
- (59) Venturi, T., Bardelli, S., Morganti, R., Hunstead, R.W., 2000, MNRAS, 314, 594
- (60) Willmer, C.N.A, Maia, M.A.G., Mendes, S.O., et al., 1999, AJ, 118, 1131
- (61) ZuHone, J., Markevitch, M., Brunetti, G., et al., 2013, ApJ, 762, 78