MgH lines in the spectrum of Arcturus
The synthetic spectra of MgH lines was computed for the grid of the model atmospheres and compared with observed spectrum of Arcturus. The parameters of the atmosphere of Arcturus for were found by using the minimization procedure of differences between observed and computed spectra and compared with results of other studies.
Key words: stars: atmospheres, stars: fundamental parameters, stars: individual (Arcturus), line: profiles.
1Taras Shevchenko National University of Kyiv, Glushkova ave., 4, 03127, Kyiv, Ukraine
2Main Astronomical Observatory of the National Academy of Sciences of Ukraine, 27 Akademika Zabolotnoho St., 03680 Kyiv, Ukraine
nondanone@gmail.com
introduction
The red giant Arcturus ( Boo, K2III) is one
of the brightest star on the sky. It is interesting for studying, because
its mass is close to the mass of Sun, but Arcturus is at the later
stage of evolution out of the Main Sequence. In some sense Arcturus represents
the future of our Sun. Arcturus is known as an excellent reference star for
spectroscopic studies of red giants, therefore availability precise
atmospheric parameters for this star is very important. The atmospheric
parameters of Arcturus have been estimated by several investigators using a variety of techniques, for example, the PASTEL database of stellar parameters by
Soubiran et al. (2010), lists 28 entries for Arcturus.
One of the common problems in the investigations of the cool stars is the difficulties of the estimations of the surface gravity. Balmer lines in the spectra of such stars are sensitive to changes of but not to . In such case it’s possible to use lines of some moleculas, which are sensitive to changes. MgH is suitable for this purpose, but we need to know an abundances of magnesium and hydrogen, because MgH lines are very sensitive to them. In such case we must search the self-consistent solution for , and abundance of Mg and H using the iteration method [5].
At least three different MgH line lists are known at the present (lists by Yadin at al. [12], Weck et al. [11], Kurucz [4]). Some of them describe spectra well, others - not. In our work we used MgH line list by R. Kurucz [4], which is very suitable for describing the spectrum.
We investigated a few tasks here: Can we use MgH lines to refine and effective temperature of Arcturus? How do MgH lines in the spectrum of Arcturus depend on ? How do MgH lines in the spectrum of Arcturus depend on ?
the calculations
We computed 28 model atmospheres with different and : (0.75 - 2.25) with the step 0.25, (4200 - 4500 K) with the step 100 by SAM12 program (Pavlenko, 2003) [6]. We computed synthetic spectrum of Arcturus by WITA6 [7]. Line list data were taken from database of atomic absorption spectra VALD (Kupka et al. 1999), observed spectrum from Visible and Near Infrared Atlas of the Arcturus Spectrum by Hinkle et al [5]. For the first approach we used chemical composition found by PDK. We accounted smoothing of the spectra of the instrumental profile, see Fig. 1. We chose 23 "good" MgH features, which consist of more less clean (without atomic lines) MgH lines. Then we compared observed spectrum and computed synthetic spectrum of Arcturus. In order to do that, we computed deviation S between our MgH features in theoretical and observed spectra for all grid of the models, see formulas (1).
| (1) |
where is the number of points in the feature,
is number of features,
is a deviation for one of features,
is total deviation for the model atmosphere with some and ,
and are boundary wavelengths of MgH feature.
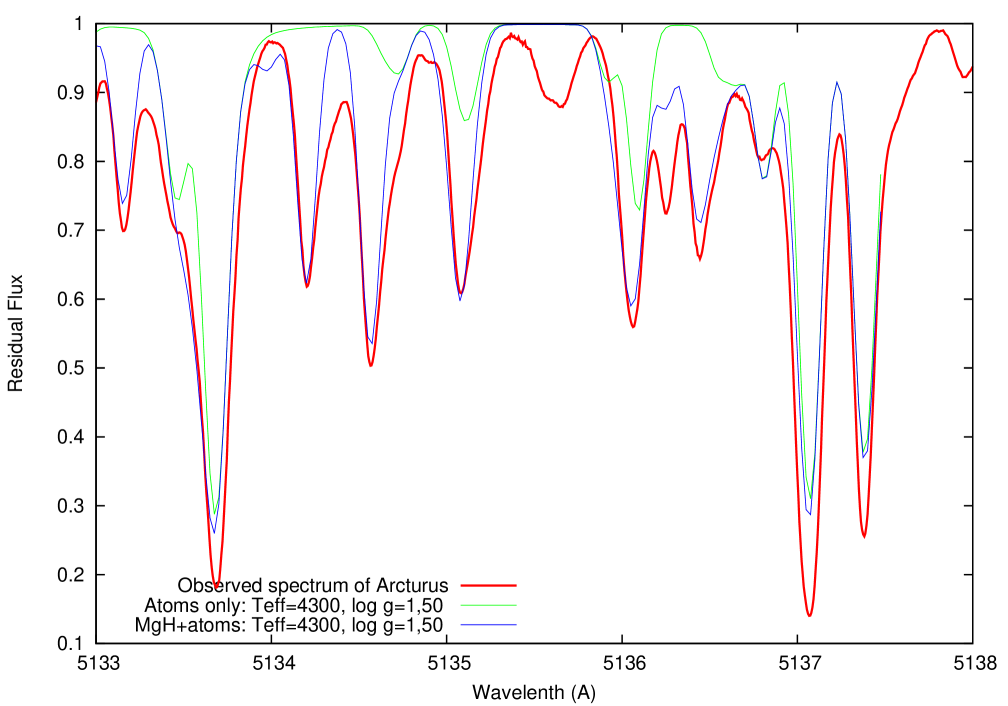
The example of reseived dependence of residual flux on for one of 23 chosen lines is present on Fig. 2 (here is a constatnt and ).
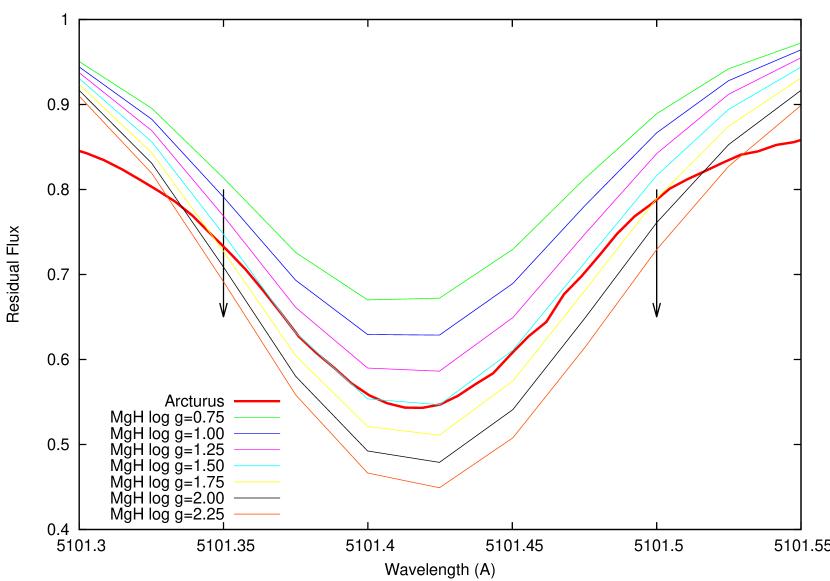
Arrows on the plots show borders of the feature and .
results and discussion
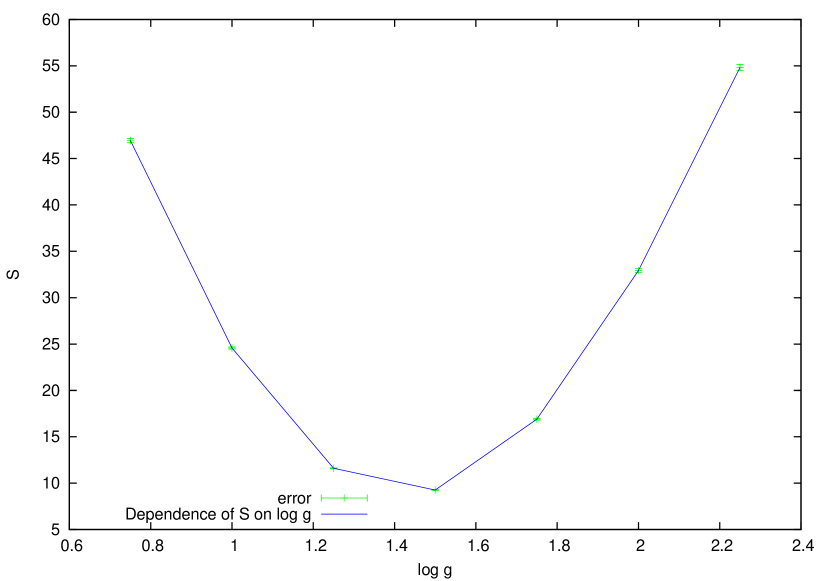
The results of the S value computations for all 23 lines in the case are shown in Table 1, and Fig. 4.
| S | ||
|---|---|---|
| 0.75 | 46.941200 | 0.2360 |
| 1.00 | 24.575607 | 0.1247 |
| 1.25 | 11.600469 | 5.7159E-002 |
| 1.50 | 9.2575245 | 3.9869E-002 |
| 1.75 | 16.896948 | 0.1063 |
| 2.00 | 32.928326 | 0.2056 |
| 2.25 | 54.842117 | 0.3246 |
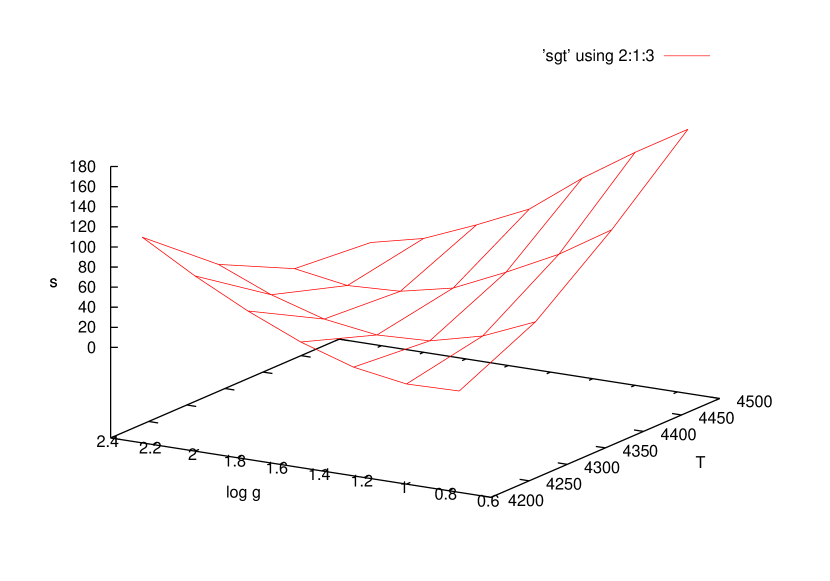

3D visualization of the dependences of on
and is on the plot (Fig. 4), we can find
the min around for . Here is
exist clearly visible
degeneration of (, ). In other words, can
be determined if
is fixed by any other method. As Bell at al. (1985) noted,
a dominant source of errors of determination of log g using MgH lines is
the error in .
The comparison of our result with results of
other studies taken from the catalog Soubiran et al. (2010) is
present on the plot (Fig. 5). The line on the plot
is the projection of minimums on the plane vs. ,
this line can be used as calibration curve for determination.
Our values (red dot on (Fig. 5)) are close enough to the
middle of range, and at the same time are in excellent agreement with
results of PDK and some most recent works (see Soubiran et al. (2010)
for the references). There is another work [1] were MgH lines
was used for determination and give for effective
temperature of 4375 K. If we use our calibration curve for
we will obtain very close value of , around 1.9.
conclusions
Our analysis was provided in the framework of classical approach. We did not account a few important processes witch might affect the intensities and profile shapes of spectral lines in stellar spectra, i.e. NLTE, dependence of with depth, rotation, chromospheres (see Bell et al. 1985) for more details. Nevertheless, we obtained several interesting results of the common interest:
-
•
We selected 23 more less clean from the atomic lines MgH features in the wavelength range 5100-5200 Å. The information about them is available in the web:
(www.mao.kiev.ua/staff/yp/Results/MgHclean.ascii). -
•
We show that absorption spectrum of MgH molecule is suitable for finding fundamental parameters of cool stars such as Arcturus.
-
•
There is a degeneration of on . We obtain the calibration curve which can be used for determination if and abundance of Mg are fixed by any other independent method.
-
•
Our values for and determined for Arcturus are in good agreement with other works.
acknowledgement
We thank Profs. Hinkle, Kurucz and VALD team for providing databases of astrophysical data used in our work, Oleksiy Ivanyuk and Larisa Yakovina for the helpful comments, LOC and SOC of YSC 2013 for good organisation of the meeting and anonymous Referee for some positive remarks.
references
- [1] Bell R. A., Edvardsson B. & Gustafsson B., Mon. Not. R. astr. Soc. (1985) 212, 497.
- [2] Hinkle, Kenneth; Wallace, Lloyd; Valenti, Jeff; Harmer, Dianne. Visible and Near Infrared Atlas of the Arcturus Spectrum 3727-9300 A. San Francisco 2000.
- [3] Kupka F., Piskunov N., Ryabchikova T. A., Stempels H. C., Weiss W. W. 1999, A&AS, 138, 119.
- [4] Kurucz R. L. 1995 CD-ROM 23.
- [5] Lyubimkov L. S., Chemical composition of stars: method and result of analysis, 1995, 65, ’Astroprint’, Odessa.
- [6] Pavlenko Ya. V. 2003, Astron. Rep., 47, 59.
- [7] Pavlenko Ya. V. 1997, Ap&SS, 253, 43.
- [8] Ramirez I. & A. Allende Prieto, 2011, ApJ,743,135
- [9] Ruth C. Peterson & Cristina M. Dalle Ore and Robert L. Kurucz, ApJl, 404,333, 1993
- [10] Soubiran, C., Le Campion, J., Cayrel de Strobel, G., & Caillo, A. 2010, A&A, 515, 111.
- [11] Weck P. F., Schweitzer A., Stancil P. C., Hauschildt P. H., Kirby K., ApJ, 582,1059, 2003
- [12] Yadin, B., Veness, T., Conti, P., Hill, C., Yurchenko, S. N., Tennyson, J., 2012, MNRAS, 425, 34.