Determination of the iron content of Cepheids from the shape of their light curves
Abstract
We present the study of the metallicity dependence of the Fourier amplitude ratios and for the light curves of short-period Galactic classical Cepheids in , , and bands. Based on the available photometric and spectroscopic data we determined the relations between the atmospheric iron abundance, [Fe/H], and the Fourier parameters. Using these relations we calculated the photometric [Fe/H] values of all program Cepheids with an average accuracy of dex. No spectroscopic iron abundance was known before for 14 of these stars. These empirical results provide an alternate method to determine the iron abundance of classical Cepheids too faint for spectroscopic observations. We also checked whether the metal-poor Cepheids of both Magellanic Clouds follow the same relationships, and a good agreement was found.
keywords:
asteroseismology – stars: abundances – stars: variables: Cepheids1 Introduction
The period-luminosity (-) relation of classical Cepheids is one of the most important tools in the extragalactic distance determination. Even though it is a well studied relationship its precision needs improvement. There are many effects that cause a dispersion around the ridge-line relationship. A summary of these effects is given in Szabados & Klagyivik (2012b). One of these ‘widening’ effects is the spread in the chemical composition of the Cepheids.
There are many observational and theoretical studies that deal with the influence of the chemical composition on the - relationship. Theoretical computations based on linear pulsation models (Sandage, Bell & Tripicco 1999; Baraffe & Alibert 2001) show only a moderate influence, while more realistic, non-linear pulsation models (Bono et al. 1999; Caputo et al. 2000) result in a significant dependence on the chemical composition in the sense that metal-rich Cepheids are less luminous than metal-poor ones of the same pulsation period.
From the observational point of view the effect is not so obvious. Whilst Romaniello et al. (2008) found that metal-rich stars are fainter, some studies found evidence of an opposite relation (Kennicutt et al. 1998; Udalski et al. 2001; Ciardullo et al. 2002).
To solve this problem it is crucial to determine the metal content of individual Cepheids even for those located in external galaxies. The spectroscopic observational technology has just reached the required level for the Magellanic Clouds. But for Cepheids in more distant galaxies it is still beyond the possibilities. It would be very useful if the chemical composition could be determined – or at least estimated – without the need of spectroscopic observations, e.g., from photometry. The atmospheric iron abundance, [Fe/H], is a reliable indicator of stellar metallicity. The goal is to find a connection between the shape of the light curve and the metal content of Cepheids.
For RR Lyrae stars, Kovács & Zsoldos (1995) and Jurcsik & Kovács (1996) elaborated a method to determine the value of [Fe/H] from the shape of the light curves. They used the and Fourier parameters (see Sect. 2) to calculate the photometric [Fe/H] ratio. Since RR Lyrae type variables involved in the calibration are single mode, radially pulsating stars like Cepheids, existence of such relationship can be expected for Cepheids, as well. Indeed, Zsoldos (1995) found a similar relationship based on a small sample of Cepheids due to the lack of available spectroscopic observations. Moreover the photometric data involved were much less accurate than more recently.
In Klagyivik & Szabados (2009, hereafter Paper I) we compiled a homogeneous data base of Galactic classical Cepheids. It contains the photometric and radial velocity peak-to-peak amplitudes, some amplitude related parameters, as well as information about the pulsation mode, binarity, and the spectroscopic [Fe/H] ratio. In Szabados & Klagyivik (2012a, hereafter Paper II) we investigated the metallicity dependence of the peak-to-peak pulsation amplitudes. The next step is the study of the influence of the [Fe/H] on the shape of the light curve.
In this paper we derive relationships between the and Fourier parameters and the spectroscopically determined atmospheric iron abundance, [Fe/H]. The Fourier decomposition of our Cepheid sample is presented in Sect. 2. In Sect. 3 the [Fe/H] dependences of the Fourier parameters are derived. In Sect. 4 we apply these relationships for determining the photometric [Fe/H] ratio of 14 Cepheids that have no spectroscopic iron abundance yet. In Sect. 5 we discuss the generalisation of the relations. Finally, Sect. 6 contains our conclusions.
2 Fourier decomposition
Since the light curves of the Cepheids are strictly periodic, they can be described with a sum of harmonic terms:
| (1) |
where is the observed magnitude at time , is the mean magnitude, and are the amplitudes of the and terms. The pulsation period of the Cepheid is .
Equation 1 can be written as
| (2) |
where and .
For practical reasons Simon & Lee (1981) introduced the dimensionless relative Fourier parameters that have been widely used ever since:
| (3) |
The Fourier decomposition was made with the light curve characterization pipeline developed within Coordination Unit 7 (Variability Processing) of the Gaia Data Processing and Analysis Consortium, with the procedure described in Dubath et al. (2011).
In fact, the unprecedented precision of the photometry by Kepler spacecraft has shown that the pulsation of V1154 Cygni, the only Cepheid in the Kepler field is not strictly repetitive (Derekas et al., 2012). Both the period and the shape of the light curve are subjected to cycle-to-cycle variations but our approximation can be applied to the average light curve.
Classical Cepheids in the period range of days show a bump both in the photometric and radial velocity phase curves. This is the well known Hertzsprung progression (Hertzsprung, 1926). This bump appears on the descending part of the light curve for shorter periods, it is close to the maximum brightness around 10 days and shifts toward even earlier phases for longer periods. Due to this feature the shape of the light curve is complex and an automated fitting method could not retrieve the phase curve properly. To solve this problem the number of fitted harmonics () has been a function of the pulsation period (see Table 1). Around 10 days consideration of more harmonics is necessary to fit the double peaked shape of the light curve than at much shorter or longer pulsation periods. We did not use any period search algorithm, the pulsation periods were fixed during the Fourier decomposition and have been taken from Paper I.
| Period (days) | |
|---|---|
| 3 | |
| 5 | |
| 9 | |
| 7 | |
| 5 |
In almost every light curves there were some outlying observational data points. Since these outliers can significantly modify the fit, we removed these points using a simple sigma clipping at in the residual light curve after the first fit. In the cleaned light curve – due to the decreased scatter – some other points can deviate by more than the new value of from the new fit. Therefore an iterating process was applied until there were no more observed point beyond from the fit. Two or three steps were usually sufficient. To have a satisfactorily large number of ‘useful’ observational data, we set the limit of the fraction of points to ignore to 20%. To keep only the reliable fits, light curves covered with less than 20 observed points have been omitted.
A portion of the final Fourier parameters are presented here in Table 2 for guidance regarding its form and content. Table 2 is published in its entirety in the electronic edition of this journal.
| Name | Period | [Fe/H]sp | B | V | Binarity | ||||||
|---|---|---|---|---|---|---|---|---|---|---|---|
| (d) | |||||||||||
| FM Aql | 6.114 | 0.29 | 0.361 | 0.103 | 0.360 | 0.120 | 0.354 | 0.105 | 0.365 | 0.152 | |
| V1162 Aql | 5.376 | 0.06 | 0.308 | 0.074 | 0.335 | 0.086 | 0.339 | 0.099 | 0.348 | 0.120 | |
| EW Aur | 2.660 | 0.49 | 0.459 | 0.229 | 0.468 | 0.261 | 0.455 | 0.229 | |||
| GV Aur | 5.260 | 0.16 | 0.461 | 0.208 | 0.450 | 0.194 | 0.455 | 0.205 | |||
| V335 Aur | 3.413 | 0.25 | 0.439 | 0.210 | 0.453 | 0.244 | 0.460 | 0.222 | |||
| AB Cam | 5.788 | 0.03 | 0.441 | 0.193 | 0.447 | 0.182 | 0.467 | 0.182 | |||
| AC Cam | 4.157 | 0.08 | 0.427 | 0.110 | 0.412 | 0.145 | 0.410 | 0.149 | |||
| RY CMa | 4.678 | 0.07 | 0.391 | 0.162 | 0.389 | 0.167 | 0.400 | 0.182 | 0.375 | 0.171 | b |
| RZ CMa | 4.255 | 0.02 | 0.369 | 0.127 | 0.375 | 0.111 | b | ||||
| BC CMa | 4.175 | 0.364 | 0.213 | 0.327 | 0.184 | ||||||
3 Metallicity dependence of the Fourier parameters
Owing to the increased interest in the metallicity dependence of the - relation, a number of recent papers deal with spectroscopic observations of Galactic – and even extragalactic – Cepheids (see the bibliographic list in Paper II). In our sample (taken from Paper II), 329 out of 369 Cepheids have spectroscopic [Fe/H] values which means an impressive 90% coverage.
There are various factors that have an influence on the observable shape of the photometric light curve involved in determining the metallicity dependence. These factors include the pulsation period (short or long period, see Paper I), the pulsation mode (fundamental or first overtone mode) and the binarity status. To have a reliable picture on the [Fe/H] dependence it is straightforward to sort the Cepheids according to their actual behaviour.
In Paper I, we demonstrated that the short- and long-period Cepheids behave in a different manner (Fig. 2. in Paper I). Therefore, it is worthwhile to separate the two groups. The division between these two groups is at instead of the period of 10 days adopted in most studies dealing with a break in the - relationship (e.g., Sandage, Tammann & Reindl 2009 and Ngeow et al. 2009). It should be noted that current theoretical and empirical evidences indicate that the centre of the Hertzsprung progression is metallicity dependent (Bono et al. 2000b and references therein). In this paper we only deal with the short-period Cepheids. The number of long period Cepheids in our sample is not large enough to deduce reliable relationships. Moreover the period dependence of the Fourier parameters is much stronger than in the case of short periods.
The pattern of the period dependence of the Fourier parameters of first overtone Cepheids is quite different from that of their fundamental mode counterparts, therefore overtone Cepheids cannot be treated together with the fundamental mode ones. But their Galactic sample is not sufficiently large, either. Therefore in this paper we only deal with short period () and fundamental mode Cepheids.
As to the binarity, a companion modifies the apparent brightness, the peak-to-peak and Fourier amplitudes on magnitude scale and usually the observed colors, too. But this is not the case in terms of Fourier amplitude ratios. Using intensities instead of magnitudes, it is easy to prove that companions only contribute to the mean brightness but the amplitude ratios and phases remain unaffected. Therefore binaries can also be included in our investigation. This is very useful for extragalactic Cepheids where photometric contamination due to blending is unavoidable. The importance of binary Cepheids is summarized by Szabados & Klagyivik (2012b).
3.1 Period dependences
To determine the metallicity dependence of the Fourier parameters first we have to get rid of the effects influencing the relationship to be determined. In the case of the most important is the pulsation period (see the upper panel of Fig. 1). The fall of at in the upper panel of Fig. 1 is a consequence of the 2:1 resonance between the fundamental and the second overtone modes of the radial pulsation (Andreasen & Petersen, 1987).
In the case of the period dependence is smooth in the period interval (see the lower panel of Fig. 1).
The pattern of the period dependence of for short pulsation periods differs from the picture seen for the Cepheids both in the Large and Small Magellanic Clouds (top left panel of Fig. 5 in Soszyński et al. 2008 and the upper panel of Fig. 2 in Soszyński et al. 2010, respectively). In both Magellanic Clouds this period domain of the figure can be described with an increasing and a decreasing part and with a local maximum at . It should be noted that our sample is much smaller than the Large and Small Magellanic Clouds (hereinafter LMC and SMC, respectively) samples, both containing thousands of Cepheids and we lack Cepheids with to reach a conclusion on the local maximum in our database, but Galactic Cepheids do not show the decrease in for (Fig. 1).
Because our sample is not large enough to fit an accurate curve to the points in the top panel of Fig. 1, we grouped the Cepheids into several period intervals. Each of these intervals ranges 0.1 in between 0.4 and 0.9, while for the longest periods the interval ranges [0.9,1.02].
3.2 Fourier amplitude ratios vs. [Fe/H]
In contrast to the RR Lyrae stars having a metallicity in the interval [Fe/H] , Galactic Cepheids are characterised with a much narrower interval of iron abundance. The metallicity range is (Pedicelli et al. 2010 and Luck & Lambert 2011). Our sample represents the same range. Moreover the most metal poor values belong to the faintest (i.e., most distant) stars, therefore the uncertainties are the largest. The average uncertainty of the [Fe/H] value for a Cepheid is dex. Therefore, it is more difficult to detect any relationship between the [Fe/H] value and other properties of Cepheid variables.
To keep the data as homogeneous as possible we only used the multicolour photometric observations obtained by Berdnikov (2008) and his co-workers. Unfortunately the precision of these photometric data is not sufficiently good or in some cases the coverage of the phase curve is not satisfactory for obtaining reliable Fourier phases and then reveal any significant [Fe/H] dependence of these Fourier parameters. The Fourier amplitudes, however, are much less sensitive to the quality of the photometric observations and the phase coverage of the light curve.
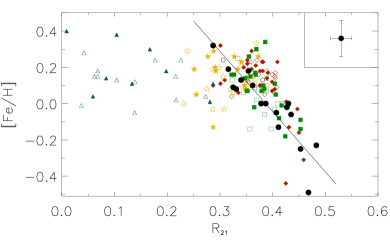
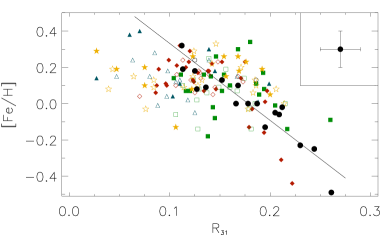
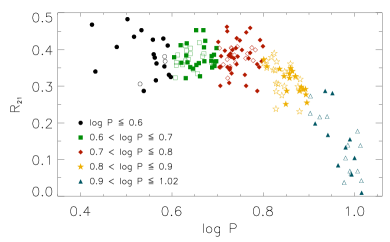
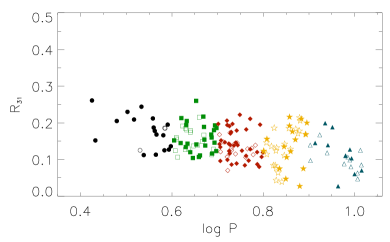
Figure 2 shows the metallicity dependence of the and amplitude ratios in band. For the shortest period Cepheids () the tendency is clearly seen: the larger the metallicity, the smaller the and amplitude ratios. Involving stars with longer pulsation periods (up to ) only the scatter around the ridge line fit increases, the steepness does not change significantly. The metallicity dependence of for stars cannot be determined. In this period region the Hertzsprung progression dominates. This dominance does not affect the parameter in our Galactic sample, however, a reliable fit can be achieved up to , too. For longer period Cepheids () there is no correlation between the spectroscopic iron content and the parameter.
Figure 2 shows the results only in band, but the relationship seems to be independent of the wavelength: the coefficients of the fits are the same within in , and photometric bands. The values of the coefficients are listed in Table 3. The linear fit corresponds to the formula:
| (4) |
where or . In Fig. 2 the fit represents the period range.
| Band | a | b | a | b | |||||||||||
|---|---|---|---|---|---|---|---|---|---|---|---|---|---|---|---|
| 1.452 | 0.178 | 3.918 | 0.524 | 17 | 0.081 | 0.749 | 0.120 | 4.623 | 0.780 | 17 | 0.114 | ||||
| 1.287 | 0.173 | 3.326 | 0.480 | 19 | 0.091 | 0.755 | 0.079 | 4.240 | 0.458 | 19 | 0.082 | ||||
| 1.314 | 0.258 | 3.535 | 0.707 | 13 | 0.113 | 0.702 | 0.142 | 4.262 | 0.893 | 13 | 0.116 | ||||
| 0.859 | 0.071 | 2.182 | 0.178 | 10 | 0.055 | 0.538 | 0.108 | 2.852 | 0.613 | 10 | 0.090 | ||||
| Band | a | b | a | b | |||||||||||
| 1.363 | 0.177 | 3.512 | 0.487 | 44 | 0.099 | 0.585 | 0.117 | 3.474 | 0.802 | 44 | 0.132 | ||||
| 1.372 | 0.137 | 3.479 | 0.363 | 58 | 0.103 | 0.594 | 0.079 | 3.333 | 0.473 | 58 | 0.132 | ||||
| 1.214 | 0.203 | 3.122 | 0.553 | 41 | 0.111 | 0.514 | 0.121 | 2.884 | 0.787 | 41 | 0.133 | ||||
| 0.984 | 0.096 | 2.582 | 0.256 | 30 | 0.099 | 0.501 | 0.073 | 2.900 | 0.424 | 30 | 0.124 | ||||
| Band | a | b | a | b | |||||||||||
| 1.379 | 0.167 | 3.499 | 0.456 | 76 | 0.123 | 0.569 | 0.078 | 3.417 | 0.549 | 76 | 0.134 | ||||
| 1.375 | 0.131 | 3.426 | 0.346 | 102 | 0.121 | 0.587 | 0.056 | 3.365 | 0.372 | 102 | 0.128 | ||||
| 1.269 | 0.185 | 3.170 | 0.500 | 76 | 0.131 | 0.534 | 0.074 | 3.067 | 0.530 | 76 | 0.134 | ||||
| 0.986 | 0.104 | 2.485 | 0.285 | 53 | 0.123 | 0.353 | 0.067 | 1.813 | 0.496 | 53 | 0.124 | ||||
In the band the steepness of the fitted line is significantly smaller than for the other bands. The differences do not exceed for the whole period domain investigated and for both the and amplitude ratios. In order to compare the parameters in different bands correctly we fitted the same function using only the stars that have band data. The steepness of the slopes is closer to the band values for each band but is still significantly lower. This means that the brightness variation in the near infrared is less sensitive to the atmospheric metallicity. It would be useful to investigate this effect in the , and infrared bands but the amount of available observational data are not sufficient yet.
The absolute errors () of the fits for are systematically smaller in the band than using other filters. For the errors in band are comparable to the band values and relative errors of the slope () are smaller in the band for every period range.
There are some more methods that can be used to guess the photometric [Fe/H] of Cepheids. Caputo et al. (2001) adopted nonlinear convective pulsational models to calculate the boundaries of the - relation for different chemical compositions. For observed Cepheids the chemical composition can be guessed based on the position of the stars within these boundaries. Unlike our one, this method can be used for all period ranges and needs only the mean magnitude of the stars. But the mean magnitude is affected by interstellar absorption and binarity. The latter is less important for long period (i.e. bright) Cepheids, but for short period stars, where our method is valid, it becomes significant. Our method is not affected by binarity.
Another method was published by Pedicelli et al. (2009). They calculated the photometric [Fe/H] ratio using multiband near infrared (, and ) Walraven (, , , , ) photometry complemented with evolutionary models. Since this method needs mean magnitudes, too, it is also affected by the same effects. The accuracy of this method is similar to that of our relations, dex.
The advantage of our method is its insensivity to many effects that can systematically modify the calculated [Fe/H] ratios. But we are limited to a short range of the pulsation periods.
3.3 An outlook for extragalactic Cepheids
To check whether the relations in Sect. 3.2 are valid for extragalactic Cepheids, too, we compared the range of [Fe/H] and the Fourier amplitude ratios of Cepheids in both the LMC and SMC. However, we do not intend to validate our relations with the Magellanic Cloud Cepheids.
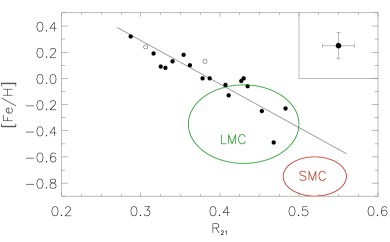
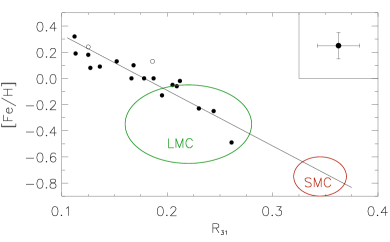
The pattern of the period dependence of the and Fourier parameters is slightly different for the Magellanic Clouds and our Galaxy. For the LMC and SMC there is a peak at . The corresponding values for the SMC are larger than for our Galactic sample, while for the LMC they are overlapping with the most metal-poor Galactic Cepheids. For the LMC and (Soszyński et al., 2008), while for the SMC and (Soszyński et al., 2010) for most of the Cepheids.
In order to avoid any difficulty caused by the period dependence of the Fourier amplitude ratios we used only the Cepheids with . In this range the amplitude ratios are roughly independent of the period.
Since there are no spectroscopic [Fe/H] values for Cepheids with in the Magellanic Clouds we cannot check our relations on individual stars. Instead, we use the full ranges of the iron content of the LMC and SMC (Romaniello et al., 2008) and the ranges of the and parameters for the period domain . The shortest period Cepheid with individual spectroscopic [Fe/H] value is HV 6093 (Romaniello et al. 2008) with log P = 0.68 and [Fe/H]. At this period the Fourier amplitude ratio starts falling due to the Hertzsprung progression and our relations are not valid any more.
Figure 3 testifies that the [Fe/H] vs. relationship can be used for extragalactic Cepheids, too. There is no need for spectroscopic observation to guess the [Fe/H] ratio of individual faint pulsators. The atmospheric iron content can be inferred from an accurate optical light curve with good phase coverage. The [Fe/H] vs. relationship suggests a non-linear shape, which is not seen in the Galactic data itself. We need spectroscopic [Fe/H] values of individual short period Cepheids in the Magellanic Clouds to check the linearity of the relationship.
In a recent study Majaess et al. (2013) found that the peak-to-peak amplitudes of long period extragalactic Cepheids are significantly smaller at lower [Fe/H] ratio. This is just the opposite of the behaviour of the peak-to-peak amplitudes of short period Galactic Cepheids (Szabados & Klagyivik, 2012a) and the and Fourier parameters in this paper, also deduced for short period Cepheids. These results are however not in conflict with the theoretical calculations. The model computed by Bono et al. (2000a) indicates that metal-rich Cepheids with a pulsation period of 10-30 days pulsate with larger peak-to-peak amplitudes than metal-poor ones. A similar study would be needed for short period extragalactic Cepheids to be sure that their observed behaviour conforms to the theoretical calculations.
The short and long period Cepheids can have different iron content. In our Galactic sample there is only a slight difference in the [Fe/H] ratio of the short and long period Cepheids. Their average values are 0.096 () and 0.174 (), respectively. Since the age difference of short and long period Cepheids is small, this difference might be a selection effect. Long period Cepheids are brighter and therefore they can be detected at larger distances. Due to the metallicity gradient of the Galaxy (Pedicelli et al., 2009) they are more metal-rich on average if they are located toward the Galactic center and they are more metal-poor if they are located outwards. In our database we have more long period Cepheids toward the Galactic center.
Another difference is that the distribution of the pulsation periods is metallicity dependent (Bono et al., 2000a). The minimum mass evolutionary tracks crossing the instability strip is decreasing with lower metallicity. Moreover, the lifetime spent inside the instability strip is longer for lower mass Cepheids. These result in a higher relative number of shorter period Cepheids in the Magellanic Clouds.
Observing individual extragalactic Cepheids is hindered by the fact that these stars are located in a crowded field of view and the spatial resolution of the telescopes is limited. Therefore the determination of accurate peak-to-peak amplitudes is hardly possible.
4 Photometric iron content
Our main goal was to elaborate a method that needs no spectroscopic observations to determine the metallicity of individual Cepheids. The relationships deduced above between the photometric Fourier amplitude ratios and the spectroscopic iron content offer a viable solution.

Based on the relations in Table 3 we calculated the photometric [Fe/H] ratios for the suitable Cepheids. The scatter of the difference between the observed and calculated [Fe/H] values were determined in order to guess the accuracy of the photometric metallicities – see the last columns of the and part of Table 3 and Fig. 4). We only used the fundamental mode Cepheids both with and without known companion(s), but in the figures we plotted them with different symbols. The precision of the photometric [Fe/H] values are significantly higher in the band than in the others. In the , and bands the scatter is nearly identical with a slight decrease for the band. The accuracy of the photometric [Fe/H] is dex when determined from for Cepheids with or based on for Cepheids with . In the case of longer period Cepheids, the accuracy is dex.
The higher accuracy of the band fits was investigated. Such an effect can be caused for example by significantly more precise photometric observations or more precise Fourier amplitude determination of large amplitude Cepheids. But the quality of the photometry does not differ too much in different bands and we found that our sample represents the entire amplitude range. These effects cannot play a role in the mystery of the accuracy. However, if we calculate the scatter of the difference between the observed and calculated [Fe/H] values using only the stars with band data, the band standard deviation decreases from to for and . This is still higher than for the band. So a part of the difference can be explained with the small number of datapoints but the higher accuracy values for the band could be realistic.
| Cepheid | in band | ||||||||||
|---|---|---|---|---|---|---|---|---|---|---|---|
| average | |||||||||||
| all | bin. | ||||||||||
| BC CMa | 0.621 | – | 0.11 | 0.13 | – | 0.12 | 0.13 | 0.12 | 0.12 | 0.0 | |
| CQ Car | 0.726 | – | – | 0.06 | – | – | 0.06 | 0.06 | 0.06 | 0.0 | |
| IM Car | 0.727 | – | – | 0.18 | – | – | 0.12 | 0.18 | 0.12 | 0.15 | |
| LV Cen | 0.697 | – | 0.09 | 0.11 | – | 0.18 | 0.17 | 0.10 | 0.18 | 0.14 | |
| KO Cep | 0.659 | – | 0.11 | 0.13 | – | 0.24 | 0.24 | 0.12 | 0.24 | 0.18 | |
| SU Cyg | 0.585 | 0.06 | 0.09 | 0.11 | 0.03 | 0.02 | 0.04 | 0.09 | 0.03 | 0.03 | b |
| WY Pup | 0.720 | – | – | 0.21 | – | – | 0.11 | 0.21 | 0.11 | 0.16 | |
| WZ Pup | 0.701 | – | – | 0.07 | – | – | 0.08 | 0.07 | 0.08 | 0.07 | |
| V773 Sgr | 0.760 | – | – | 0.24 | – | – | 0.30 | 0.24 | 0.30 | 0.27 | |
| V1954 Sgr | 0.791 | – | – | 0.17 | – | – | 0.32 | 0.17 | 0.32 | 0.25 | |
| X Sct | 0.623 | – | 0.13 | 0.15 | – | 0.04 | 0.06 | 0.14 | 0.05 | 0.05 | b |
| CR Ser | 0.724 | – | – | 0.06 | – | – | 0.11 | 0.06 | 0.11 | 0.09 | |
| DP Vel | 0.739 | – | – | 0.13 | – | – | 0.20 | 0.13 | 0.20 | 0.17 | b |
| BR Vul | 0.716 | – | – | 0.02 | – | – | 0.09 | 0.02 | 0.09 | 0.06 | |
There are 14 Cepheids in our sample that have no spectroscopic [Fe/H] value yet, nevertheless we are able to calculate the photometric ones. For stars with the shortest periods the equations in Table 3 result 24 different individual [Fe/H] values. Since the accuracy of the photometric iron content in band is similar to that in the band and all of the stars were observed in the , in Table 4 we present the calculated values for the band. Based on Tables 2 and 3 one can easily calculate all other [Fe/H] ratios. In Table 4 we also calculated the average of the -based, the -based iron contents and the average of all the individual band values. The standard deviation of the values of these averages are , , and , respectively, based on the Cepheids with known [Fe/H]sp.
The photometric [Fe/H] ratios based on and are similar to each other within dex in most cases. The two exceptional cases are BC CMa and X Sct where the difference is .
5 Discussion
In Sect. 3.2 we showed that practically identical relations are valid for the , and photometric bands and a similar relation was determined for the band. Since the Gaia space probe will also observe in the optical range, a careful calibration will facilitate using Gaia photometry for determining the iron content of thousands of target Cepheids independently of the spectroscopically derived [Fe/H] value obtained from the measurements during this astrometric space project. Since the companions in binary or multiple systems have no effect for our study, the photometric [Fe/H] ratio can be calculated for such Cepheids, too.
The Gaia astrometric space probe will scan the whole sky down to 20th magnitude and will provide a complete and unbiased data base involving an average of 80 photometric points on each target during its 5 year active lifetime. For Cepheids pulsating with a single period and stable light curve these 80 photometric data points seem to be sufficient to obtain a well covered phase curve over the complete pulsation cycle. To calculate precise Fourier amplitude ratios, a photometric accuracy of magnitude is sufficient. In this case, the photometric metallicity of Cepheids can be derived down to the brightness range of 16-18th magnitudes (Jordi et al., 2010) depending on the photometric band and the colour of the target star, which is much beyond the limit of ground based spectroscopic observations yet.
Our method can be applied for extragalactic Cepheids, too. The applicability of our formulae was shown for Cepheids in the Magellanic Clouds (see Sect. 3.3). Since Cepheids are brighter in the near infrared region than at optical wavelengths, photometric observations of extragalactic Cepheids overwhelm in the near infrared, especially in the band. Since the relationship between the atmospheric iron content and the light curve shape derived by us (see Table 3) is also reliable for the photometric band, our formula offers a promising method for determination of metallicity of faint extragalactic Cepheids from purely photometric data.
The most accurate determination of the photometric [Fe/H] value can be performed for Cepheids with a pulsation period shorter than 4 days. Since the absolute visual magnitude of these Cepheids is around and the distance modulus of the LMC and SMC are mag and mag, respectively (Storm et al., 2011), these stars have an apparent magnitude , which is within the capability of the Gaia photometry.
The photometric [Fe/H] value for a huge number of Galactic and extragalactic Cepheids together with the extremely accurate trigonometric parallaxes of these stars to be provided by Gaia can help to recalibrate the metallicity dependence of the - relationship and to refine the cosmic distance scale.
6 Conclusions
We have presented a method to estimate the atmospheric iron content of classical Cepheids using only photometric observations. Based on a homogeneous data set of 369 Galactic Cepheids we determined the relationships between the and Fourier amplitude ratios and the spectroscopic [Fe/H] ratio.
We found that for both and parameters the higher the metal content, the smaller the amplitude ratio. These relationships are valid and are the same for the Johnson and and the Kron-Cousins photometric bands. For the band a similar but shallower relationship is valid with an even better accuracy as for band.
The average [Fe/H] ratios and the range of the and amplitude ratios for the Magellanic Clouds are in good agreement with our relations, especially for . So the equations may be used also for at least the LMC and SMC.
We calculated the photometric [Fe/H] ratio for the suitable Cepheids. 14 of them have no spectroscopic iron content yet. The accuracy of these values is dex for Cepheids pulsating with the shortest period which is similar to the error of the spectroscopic [Fe/H] value. For longer periods the accuracy is dex. The relations are valid for the pulsation periods up to .
Since binarity does not modify the Fourier amplitude ratios, therefore these relationships can be used to estimate the atmospheric iron content for binary Cepheids or for Cepheids in crowded fields (e.g. for extragalactic Cepheids), too.
Acknowledgments
Financial support from the ESA PECS Project C98090, ESTEC Contract No.4000106398/12/NL/KML and support from the Hungarian State Eötvös Fellowship is gratefully acknowledged. The authors are indebted to the referee, Dr. Giuseppe Bono, whose critical report helped improve the presentation of the results.
References
- Andreasen & Petersen (1987) Andreasen G. K., Petersen J. O., 1987, A&A, 180, 129
- Baraffe & Alibert (2001) Baraffe I., Alibert Y., 2001, A&A, 371, 592
- Berdnikov (2008) Berdnikov L. N., 2008, http://vizier.u-strasbg.fr/viz-bin/VizieR?-source=II/285
- Bono et al. (1999) Bono G., Caputo F., Castellani V., Marconi M., 1999, ApJ, 512, 711
- Bono et al. (2000a) Bono G., Castellani V., Marconi M., 2000a, ApJ, 529, 293
- Bono et al. (2000b) Bono G., Marconi M., Stellingwerf R. F., 2000b, A&A, 360, 245
- Caputo et al. (2000) Caputo F., Marconi, M., Musella I., Santolamazza P., 2000, A&A, 359, 1059
- Caputo et al. (2001) Caputo F., Marconi M., Musella I., Pont F., 2001, A&A, 372, 544
- Ciardullo et al. (2002) Ciardullo R., Feldmeier J. J., Jacoby G. H., Kuzio de Naray R., Laychak M. B., Durrell P. R., 2002, ApJ, 577, 31
- Derekas et al. (2012) Derekas, A., et al. 2012, MNRAS, 425, 1312
- Dubath et al. (2011) Dubath P. et al. 2011, MNRAS, 414, 2602
- Hertzsprung (1926) Hertzsprung E., 1926, Bull. astronom. Inst. Netherl. 3, 115
- Jordi et al. (2010) Jordi, C., et al. 2010, A&A, 523, 48
- Jurcsik & Kovács (1996) Jurcsik, J., Kovács, G. 1996, A&A, 312, 11
- Kennicutt et al. (1998) Kennicutt, R. C., Jr., et al., 1998, ApJ, 498, 181
- Klagyivik & Szabados (2009) Klagyivik, P., Szabados, L., 2009, A&A, 504, 959 (Paper I)
- Kovács & Zsoldos (1995) Kovács, G., Zsoldos, E., 1995, A&A, 293, 55L
- Luck & Lambert (2011) Luck R. E., Lambert D. L., 2011, AJ, 142, 136
- Majaess et al. (2013) Majaess, D., Turner, D. G., Gieren, W., Berdnikov, L., Lane, D. J., 2013, Ap&SS, 344, 381
- Ngeow et al. (2009) Ngeow, C.-C., Kanbur, S. M., Neilson, H. R., Nanthakumar, A., Buonaccorsi, J., 2009, ApJ, 693, 691
- Pedicelli et al. (2009) Pedicelli S., et al., 2009, A&A, 504, 81
- Pedicelli et al. (2010) Pedicelli S., et al., 2010, A&A, 518, 11
- Romaniello et al. (2008) Romaniello, M., et al., 2008, A&A, 488, 731
- Sandage et al. (1999) Sandage, A., Bell, R. A., Tripicco, M. J., 1999, ApJ, 522, 250
- Sandage et al. (2009) Sandage, A., Tammann, G. A., Reindl, B., 2009, A&A, 493, 471
- Simon & Lee (1981) Simon, N. R., Lee, A. S., 1981, ApJ, 248, 291
- Soszyński et al. (2008) Soszyński, I., et al., 2008, AcA, 58, 163
- Soszyński et al. (2010) Soszyński, I., et al., 2010, AcA, 60, 17
- Storm et al. (2011) Storm, J., Gieren, W., Fouqué, P., Barnes, T. G., Soszyński, I., Pietrzyński, G., Nardetto, N., Queloz, D., 2011, A&A, 534, 95
- Szabados & Klagyivik (2012a) Szabados, L., Klagyivik, P., 2012a, A&A, 537, 81 (Paper II)
- Szabados & Klagyivik (2012b) Szabados, L., Klagyivik, P., 2012b, Ap&SS, 341, 99
- Udalski et al. (2001) Udalski, A., Wyrzykowski, L., Pietrzynski, G., Szewczyk, O., Szymanski, M., Kubiak, M., Soszyński, I., Zebrun, K., 2001, AcA, 51, 221
- Zsoldos (1995) Zsoldos, E., 1995, in Astrophysical Applications of Stellar Pulsation, ed. R. S. Stobie & P. A. Whitelock, ASPC, 83, 351