Critical Transitions in Social Network Activity
Abstract
A large variety of complex systems in ecology, climate science, biomedicine and engineering have been observed to exhibit tipping points, where the internal dynamical state of the system abruptly changes. For example, such critical transitions may result in the sudden change of ecological environments and climate conditions. Data and models suggest that detectable warning signs may precede some of these drastic events. This view is also corroborated by abstract mathematical theory for generic bifurcations in stochastic multi-scale systems. Whether the stochastic scaling laws used as warning signs are also present in social networks that anticipate a-priori unknown events in society is an exciting open problem, to which at present only highly speculative answers can be given. Here, we instead provide a first step towards tackling this formidable question by focusing on a-priori known events and analyzing a social network data set with a focus on classical variance and autocorrelation warning signs. Our results thus pertain to one absolutely fundamental question: Can the stochastic warning signs known from other areas also be detected in large-scale social network data? We answer this question affirmatively as we find that several a-priori known events are preceded by variance and autocorrelation growth. Our findings thus clearly establish the necessary starting point to further investigate the relation between abstract mathematical theory and various classes of critical transitions in social networks.
1 Introduction
Can sudden changes in society be anticipated by monitoring social network activity? This problem has recently gained considerable attention and serves as the background motivation for our work. It has been suggested [9, 37] in the media that certain societal-scale oppositional movement may be preceded and even be triggered by social network activity and that those events could be viewed as ’tipping points’ [16]. For example, the events in Egypt in 2011 have been in the focus of recent research [25, 33, 26] which has a similar conjecture (“Tahrir Square was a foreseeable surprise: tracing the history of Egyptian activism” [24]). To address such a conjecture from a theoretical modeling perspective would require a deep understanding of how new social media impact collective action [4] and how cyber-collective movements are formed [1]. A conclusive study to confirm the conjecture that the a-priori unknown revolution in Egypt in 2011 was foreseeable is far beyond the reach of current research. Hence, while we cannot directly solve this difficult problem directly, we must reduce it to several elementary (and thus more tractable) problems concerning complex network theory. One such necessary first step towards solving this larger problem is to ask: may the well-known warning signs preceding drastic events in social media be found at all? In this study, we answer this question by analyzing social media data for warning signs in the context of well-defined a-priori known events such as special public holidays.
In particular, our approach establishes a first potential link between social media analysis and the recent theory of warning signs for critical transitions (or tipping points) [30, 18]. Similar approaches have received major recent attention in ecology where warning signs were detected in experimental [10, 13, 35] and in field data [36, 6]. A critical transition may informally be defined as a rapid drastic change of a time-dependent dynamical system; for more precise definitions see [19, 2]. Warning signs for critical transitions have been investigated intensively in ecological models during the last decade [11, 22]. Similar results have also been obtained in the context of climate science [23, 32, 8], biomedical applications [34, 27], engineering [7] and epidemiology [19, 28]. These studies led to the conjecture that there are some warning signs which are generic [30] for large classes of natural systems. From a mathematical perspective, this conjecture can be made precise for transitions near certain bifurcation points; see [18, 19] and Appendix B. Two of the most classical warning signs are rising variance and rising auto-correlation before a critical transition [5, 30] whose origin is described in more detail in Appendix B. The basic idea is that if a drastic change is induced by a critical (bifurcation) point, then the underlying deterministic dynamics becomes less stable. Hence, the noisy fluctuations become more dominant as the decay rate decreases close to the critical transition. As a result, (a) the variance in the signal increases, due to the stronger fluctuations and (b) the system’s state memory (i.e., auto-correlation) increases due to smaller deterministic contraction onto a single state [30, 18]. It can be shown that both warning signs are related via a suitable fluctuation-dissipation relation [12].
For social networks, the situation is much less developed. Although the notion of ’tipping’ is somewhat familiar in sociological contexts [14, 21], work on detailed statistical analysis of warnings in social networks from a dynamical systems perspective is very sparse. One approach which is related and complementary to the results presented in this paper is recent work by Slater [31] where a data set of approximately 11000 blog posts is analyzed and tipping is defined using a sentiment score. Based on this score, two special points were identified and warnings were computed. In this paper, we analyze a large-scale social network data set and focus on clearly defined events, which are well-localized in time.
2 Results
The data set we analyzed consists of messages communicated publicly via Twitter. In this context, a message is also called a tweet. The messages collected account for about 20-30 percent of all the data tweeted world-wide in the time period from June 1 2009 to Dec 31 2009, amounting to 476,547,774 tweets, or on average over the time period 92,767 tweets/hour [38]; more details about the data set can be found in Appendix A.
We extract time series by counting word frequencies. The frequency count is based on
hashtags such as #halloween. Twitter users frequently attach hashtags to particular
events or topics [29]. For the words we consider, we remove all
white spaces and transform strings to lower case, e.g., #halloween equals
#Halloween. Subsequently, linear trends were removed from the resulting time
series; for more details on the computation see Appendix A.
We have already pointed out that it is difficult to analyze a-priori unknown events, such as the revolution in Egypt in 2011, using social network data. Such events are not well localized in time, so it is hard to even determine when a critical transition happens. However, one may pose the simpler question of whether the scaling laws for the variance and autocorrelation warning signs can be detected in the time period preceding an a-priori known event. This is a test of whether it may be possible to extract scaling laws from large-scale social networks near critical transitions at all. Since our data set encompasses fall/winter 2009 we chose the three special events:
-
(A)
#halloween: Halloween occurred on Saturday, October 31st, 2009 -
(B)
#thanksgiving: Thanksgiving Day occurred on Thursday, November 26th, 2009 -
(C)
#xmas: Christmas Day occurred on Friday, December 25th, 2009
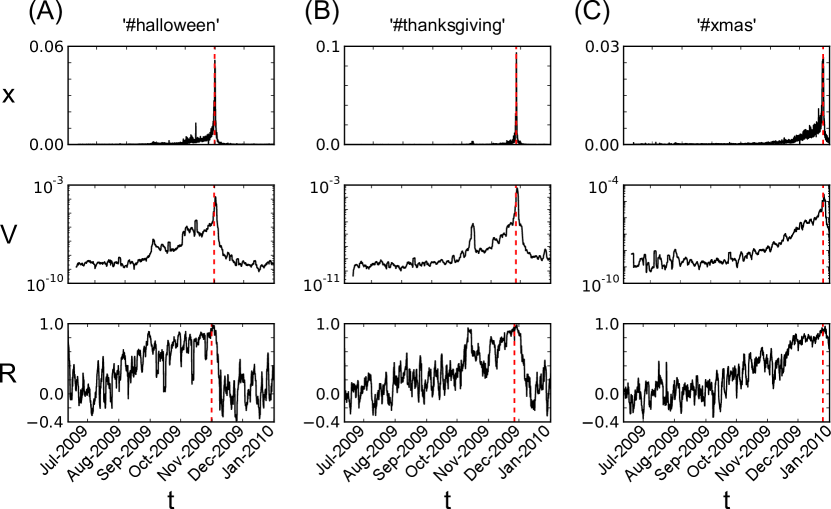
Note that these events are well-defined in the sense that the event dates are fixed and the hashtags are directly associated to the events since they do not commonly occur in different contexts. The first row of Figure 1 shows the time series of frequency for each hashtag. As expected, the overall hashtag frequency count starts to increase weeks before the events (A)-(C). Note that we do know a-priori that a drastic change is going to occur at the precise event date. However, if we would terminate the time series several days or weeks before the event and did not know about (A)-(C) then we would have to take into account the possibility that a drastic spike never occurs and the word frequency just decreases slowly.
From this last perspective, i.e., by using only past data and information, we calculated the variance and lag-1 autocorrelation by considering sliding averages over a period of 50 hours and time steps of 5 hours. The results are shown in second and third rows of Figure 1 respectively. In all three cases, we see a clear increase of the variance. The autocorrelation also increases before the events (A)-(C), as shown in row three of Figure 1. Again, the warning sign is clearly visible for all three cases.
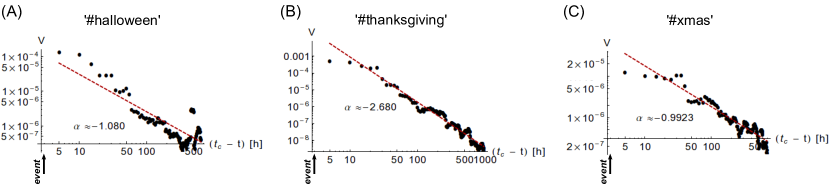
Furthermore, we investigated the scaling laws for the variance. The mathematical theory of critical transitions indicates that there is a regime in which we may find a scaling law of the form
| (1) |
where denotes the time of the spiking event and where , are two constants. More details on the theory behind the power law scaling (1) is provided in Appendix B; however, we mention here that there are generically three different regimes for stochastic scaling laws: (R1) far away from the bifurcation point, (R2) a large-in-time regime approaching the bifurcation point and (R3) a small-in-time regime near the bifurcation. Theory predicts that a scaling law (1) should hold in regime (R2) and that the key measure is the exponent as it can potentially distinguish between different dynamical transitions. Figure 2 shows the results for exponent for the three cases from Figure 1. We find that there is indeed a regime distinction between (R1), (R2) and (R3). We did perform a least-squares fit to determine in (R2). Cases (A) and (C) show an exponent very close to which is an exponent generically expected near several types of bifurcation points such as Hopf, transcritical and pitchfork bifurcations. However, (B) shows a substantially smaller exponent than predicted by theoretical considerations. There could be several potential explanations for this non-standard exponent; see Appendix B. Nevertheless, in all three cases we see a clear power law scaling behavior of the variance that is characteristic of the regime type (R2).
As a last aspect of our work, we also analyzed the Twitter time series data to find examples of other events that are, e.g., unpredictable, exogenously-induced, periodically-driven, with short periods of warning signs or highly noise-driven. Several alternative examples of such complementary behaviors are presented in Appendix C. These time series illustrate that there is a variety of potentially novel dynamical behaviors in large-scale social networks near large spikes that deserve to be investigated in their own right.
3 Discussion
We have demonstrated that clear warning signs exist for a-priori known events in large-scale social media data. Our results leave open the possibility that warning signs could also exist for a-priori unknown events. Investigating this problem further still remains a largely unexplored research topic. In particular, it is important to check various conjectures on the influence of new social media on major societal events very carefully.
Even very elementary questions are open in the context of social network data and warning signs. For instance, what type of time series data should be used? In this study, we analyzed the content of messages posted by users, but one could equally well think of analyzing the dynamics of connections made between users, or various other network activities. Even when considering the content of messages, options other than the topic or hashtag considered here are conceivable, such as particular words, word combinations, or even entire phrases. Further important questions include:
-
•
How do we define when a critical transition occurs for an a-priori unknown event in the data?
-
•
Can we link warning signs in social networks to a-priori unknown critical transitions outside a social network?
-
•
Which models of social networks can re-produce critical transitions observed in data?
In summary, our contribution is to provide a proof-of-principle. In particular, we have found stochastic scaling laws, which are characteristic signs of critical transitions, in a large social media data set preceding large increases of activity. This suggests that the underlying social network may undergo a qualitative change between two different dynamic regimes. We explicitly emphasize that we neither claim to link these signs to any particular underlying mathematical network model nor can we prove for which types of network events such warning signs may exist; however, we have shown that there exist signatures that do resemble much the structures of warning signs observed in other fields, such as ecology, as well as the theoretical scaling laws, thus opening new perspectives on research on social network dynamics.
It is important to develop additional mathematical tools to answer further research questions. Due to their present lack, we have chosen examples of events that are sufficiently isolated and where influences that we cannot quantify are eliminated. Warning signs in social network data are still a largely unexplored topic. We expect that our work will stimulate further research, with ample opportunities to uncover results on social network dynamics with far-reaching ramifications.
Acknowledgments: CK would like to thank the Austrian Academy of Sciences (ÖAW) for support via an APART fellowship and the European Commission (EC/REA) for support by a Marie-Curie International Re-integration Grant. EM’s contribution is part of the Dynamical Systems Interdisciplinary Network, University of Copenhagen. DR acknowledges the generous research support sponsored by the Army Research Laboratory and accomplished under Cooperative Agreement Number W911NF-09-2-0053 and DARPA BAA-11-64, Social Media in Strategic Communication. The views and conclusions contained in this document are those of the authors and should not be interpreted as representing the official policies, either expressed or implied, of the Army Research Laboratory or the U.S. Government. The U.S. Government is authorized to reproduce and distribute reprints for Government purposes notwithstanding any copyright notation here on.
Appendix A Time Series Analysis
We briefly describe the time series analysis. The basic time unit we use is the
number of hours elapsed since the starting point of the time series. Denote the
word frequency during one hour . For example, for #xmas we have
which yields a time series . To compute the warning signs we fix a window size . At a time point for some fixed lag we consider the vector
Denote the vector obtained by removing the linear trend from by . Then we may just compute the mean , variance and lag- autocorrelation of by the standard formulas
This yields the required time series for the warning signs given by and . Note that we also choose a time step for the spacing in the index which yields that
and similarly for . To understand why the variance and autocorrelation are expected to increase generically near certain types of critical transitions we refer the reader to [18, 30, 19] where also the specific scaling laws are discussed.
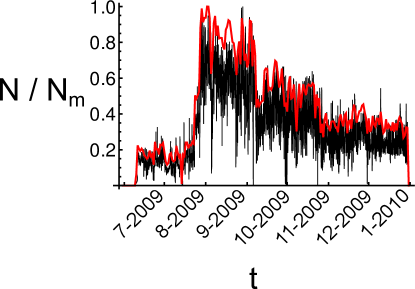
The relative tweet volume per hour and day are shown in Figure 3; the maximum recorded volume is / hour or / day, respectively. The average tweet activity is / day or / hour, with a standard deviation of / day or / hour, respectively.
Appendix B Critical Transitions / Tipping Points
In this section we provide some technical background on critical transitions (or tipping points) to support our main theme of studying variance and autocorrelation near jumps in time series of complex networks. Consider a general -dimensional system of ordinary differential equations (ODEs) given by
| (2) |
where we may view as the parameters describing the network properties and as all the relevant variables to track the state of the network; the map is assumed to be sufficiently smooth. Suppose there exists a branch of equilibria , i.e., steady states with . Suppose the equilibria are stable for a certain range of parameter values and lose stability for some at which the state of the system (i.e. the network) changes drastically. In this case it can be proven rigorously that the only two situations which imply stability loss and are stable to arbitrary perturbations within the class of sufficiently smooth vector fields upon variation of a single parameter are the so-called fold and Hopf bifurcations (see the description of such (codimension one) bifurcations in [20, Ch. 3] as well as [15, Sec. 3.4]). Due to this theory we may start from the low-dimensional cases for the fold and for the Hopf bifurcation. The fold is always a tipping point while the Hopf bifurcation only induces tipping to a distant attractor in the subcritical case [18, Prop. 2.5-2.6]. We remark that one can show that it is a generic property [19, Sec. 7.4] that the warning signs we are going to discuss appear in all variables upon sufficient coupling i.e. before reducing to the minimal dimensions [15, Sec. 3.2].
For the fold bifurcation one may prove [20, Sec. 3.2] that the system near the transition, where a stable and unstable steady state collide and annihilate, may be reduced to
| (3) |
where denotes higher-order terms which we shall drop from now on and, for concreteness, we may think of as the word frequency. The two steady states are for and is stable while is unstable. The fold bifurcation occurs for . Abstractly, one may view the stable steady state as the representation of the word frequency in the network before it approaches the drastic jump upon parameter variation of (which we could just take as progression of time for our case). Linearizing around yields the variational equation
| (4) |
From (4) it follows that the local linear exponential stability of decreases as ; this is just the classical slowing-down phenomenon (or intermittency) [15, p.343-346]. If one perturbs (3) by an additive noise process which is delta-correlated white noise, i.e., , , and where is a parameter controlling the noise level, then this yields the stochastic differential equation
| (5) |
which is to be interpreted in the sense of the Itô-calculus. Under certain assumptions on the parameter variation of and the sufficiently small noise level [19, p. 479] one may prove that there is a region before the fold where the time series fluctuating near the deterministic steady-state exhibits a stochastic scaling law for the variance
| (6) |
as from above and remains fixed. A related result, obtained via a fluctuation-dissipation relation, is that the autocorrelation increases as from above; see [12, 30] for a discussion of this aspect. The argument for the case of the Hopf bifurcation follows in an analogous manner and the resulting scaling law turns out to be [19, Thm. 5.2]
| (7) |
Hence, this motivates to test for an increase in variance and autocorrelation in the time series data. Furthermore, replacing the parameter by a time-dependent drift, or just by time for simplicity, we expect to detect power law scalings of the form
| (8) |
where is the time when the critical transition occurs. The two generic scaling exponents are and . However, if we additionally drop the assumption of additive noise and instead assume multiplicative noise, which depends on the distance to the critical transition point, then the two generic 1-parameter scaling exponents can decrease or increase as demonstrated in [19, Sec. 7.5]. This is one scenario which could potentially account for the increased exponent observed in Figure 2(B).
Although the abstract mathematical analysis can be justified rigorously, it has to rely on a number of assumptions to achieve these results, including e.g. smoothness of the ODEs [17], coupling of the normal form variable to the measured variable [19, Sec. 7.4], weak-noise regime in comparison to parameter drift [3, p. 96] and additive noise (as discussed above). The current state of abstract social network modeling does not suffice to check all these assumptions for a large realistic model. Interestingly, it has been shown in the context of classical coarse-grained epidemic models that these assumptions may hold in many cases; notably, epidemic models could potentially share many features with social networks, see [19, Sec. 7.2] and [28]. In any case, variance and autocorrelation are relatively easy to measure using a sliding window approach outlined in the previous section. In conclusion, this provides the mathematical motivation for our basic hypothesis that we would like to test for in this study: Are there any signs of increasing variance and autocorrelation before spikes/jumps in network activity?
Appendix C Further Examples of Time Series
To illustrate various other phenomena that can be found in large-scale
social media, time series, we discuss a few additional hashtag time series,
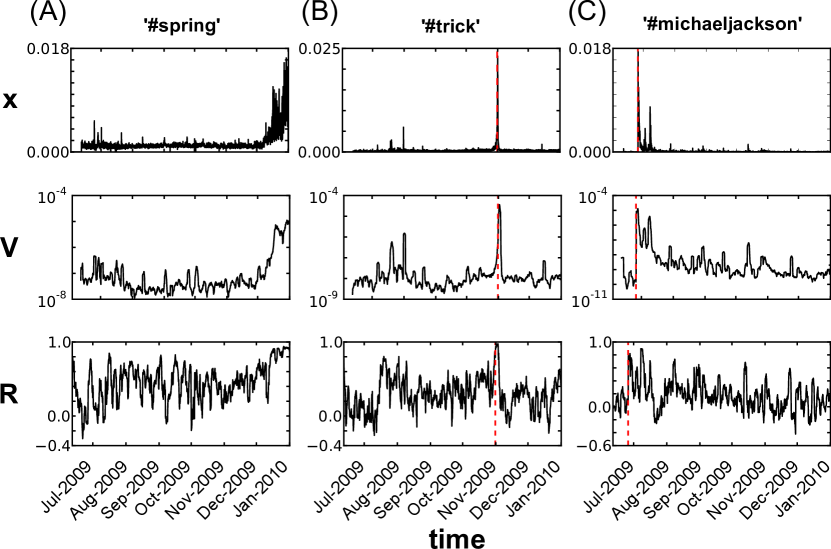
shown in Figures 4 and 5. Another example exhibiting warning
signs for an a-priori known event is the time series for #spring in
Figure 4(A). However, note that the event of ’spring’ is not confined
to a single particular date and therefore, we observe a broad regime of large
activity instead of one distinct spike. Figure 4(B) shows the time
series for #trick, which has a very large peak at Halloween (marked
by a dashed red line), apparently due to its relation to the phrase
“trick-or-treat”; but the variance and autocorrelation begin to increase
only very close to the spike in the time series. This illustrates how indirect
indicators of an event could be substantially worse predictors than the hashtags
for the event themselves. Figure 4(C) shows the hashtag
#michaeljackson exhibiting an extremely large spike at the day of
the sudden, unexpected death of Michael Jackson, but – obviously – without
any warning signs preceding the event. The cause of this event is clearly
exogenous in nature (in terms of social network dynamics) and thus, it is
impossible to detect (or anticipate, for that matter) early warning signs in
these time series data.
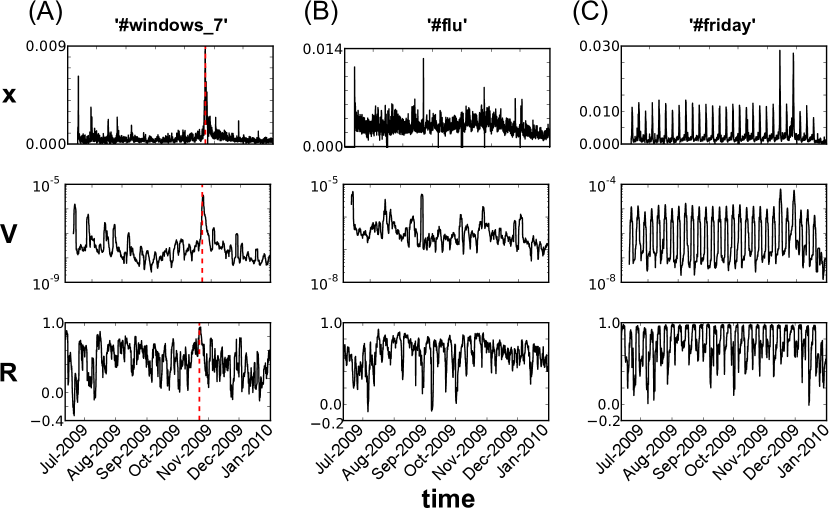
Figure 5(A) shows the time series for the hashtag #windows_7
related to the release event (red dashed line) of the software package Windows 7.
There is increasing variance as well as autocorrelation before the (a-priori known)
event. However, the warning signs are not as clear-cut as in the examples shown
in Figure 1. In fact, the prediction time window seems rather short.
Thus, this example represents a case which lies in between the realm of predictable
and unpredictable events, at least as long as the detection of warning signs is
based upon the variance and autocorrelation analysis. Figure 5 shows
the time series for the hashtag #flu which is very noisy. Although there
are several spikes in activity, these spikes appear clearly unpredictable as
– from a modeling point of view – seem to be noise-induced events. Finally,
Figure 5 shows a periodically-driven time series for #friday.
Warning signs could potentially be possible to identify during each week before
the spikes, but we do not examine this case in further detail since, to the best
of our knowledge, there is basically no theoretical background for warning signs
for systems with short rapid periodic forcing.
References
- [1] N. Agarwal, M. Lim, and R. Wigand. Raising and rising voices in social media - a novel methodological approach in studying cyber-collective movements. Business Inf. Syst. Eng., 4(3):113–126, 2012.
- [2] P. Ashwin, S. Wieczorek, R. Vitolo, and P. Cox. Tipping points in open systems: bifurcation, noise-induced and rate-dependent examples in the climate system. Phil. Trans. R. Soc. A, 370:1166–1184, 2012.
- [3] N. Berglund and B. Gentz. Noise-Induced Phenomena in Slow-Fast Dynamical Systems. Springer, 2006.
- [4] B. Bimber, A.J. Flanagin, and C. Stohl. Reconceptualizing collective action in the contemporary media environment. Comm. Theor., 15(4):365–388, 2005.
- [5] S.R. Carpenter and W.A. Brock. Rising variance: a leading indicator of ecological transition. Ecology Letters, 9:311–318, 2006.
- [6] S.R. Carpenter, J.J. Cole, M.L. Pace, R. Batt, W.A. Brock, T. Cline, J. Coloso, J.R. Hodgson, J.F. Kitchell, D.A. Seekell, L. Smith, and B. Weidel. Early warning signs of regime shifts: a whole-ecosystem experiment. Science, 332:1079–1082, 2011.
- [7] M. Chertkov, S. Backhaus, K. Turzisyn, V. Chernyak, and V. Lebedev. Voltage collapse and ODE approach to power flows: analysis of a feeder line with static disorder in consumption/production. arXiv:1106.5003v1, pages 1–8, 2011.
- [8] A.A. Cimatoribus, S.S. Drijfhout, V. Livina, and G. van der Schrier. Dansgaard-Oeschger events: tipping points in the climate system. Climate of the Past Discussion, 8(5):4269–4294, 2012.
- [9] R. Cohen. Facebook and Arab dignity. New York Times, 2011. Retrieved from http://www.nytimes.com/2011/01/25/opinion/25iht-edcohen25.html on 4 November 2013.
- [10] L. Dai, D. Vorselen, K.S. Korolev, and J. Gore. Generic indicators for loss of resilience before a tipping point leading to population collapse. Science, 336:1175–1177, 2012.
- [11] V. Dakos, E.H. van Nes, R. Donangelo, H. Fort, and M. Scheffer. Spatial correlation as leading indicator of catastropic shifts. Theor. Ecol., 3(3):163–174, 2009.
- [12] P.D. Ditlevsen and S.J. Johnsen. Tipping points: early warning and wishful thinking. Geophys. Res. Lett., 37:19703, 2010.
- [13] J.M. Drake and B.D. Griffen. Early warning signals of extinction in deteriorating environments. Nature, 467:456–459, 2010.
- [14] M. Gladwell. The Tipping Point: How Little Things Can Make a Big Difference. Back Bay Books, 2002.
- [15] J. Guckenheimer and P. Holmes. Nonlinear Oscillations, Dynamical Systems, and Bifurcations of Vector Fields. Springer, New York, NY, 1983.
- [16] L. Hudson and M. Flannes. The Arab Spring: Anatomy of a tipping point. Aljazeera, 2011. Retrieved from http://www.aljazeera.com/indepth/opinion/2011/08/201183081433165611.html on 4 November 2013.
- [17] C. Kuehn. Scaling of saddle-node bifurcations: degeneracies and rapid quantitative changes. J. Phys. A: Math. and Theor., 42(4):045101, 2009.
- [18] C. Kuehn. A mathematical framework for critical transitions: bifurcations, fast-slow systems and stochastic dynamics. Physica D, 240(12):1020–1035, 2011.
- [19] C. Kuehn. A mathematical framework for critical transitions: normal forms, variance and applications. J. Nonlinear Sci., 23(3):457–510, 2013.
- [20] Yu.A. Kuznetsov. Elements of Applied Bifurcation Theory. Springer, New York, NY, 3rd edition, 2004.
- [21] P.J. Lamberson and S.E. Page. Tipping Points International Quarterly Journal of Political Science, 7(2):175–208, 2012.
- [22] S.J. Lade and T. Gross. Early warning signals for critical transitions: a generalized modeling approach. PLoS Comp. Biol., 8:e1002360–6, 2012.
- [23] T.M. Lenton. Early warning of climate tipping points. Nature Climate Change, 1(4):201–209, 2011.
-
[24]
M. Lim.
Tahrir Square was a foreseeable surprise: tracing the history of
Egyptian online activism.
Slate, 2011.
Retrieved from
http://www.slate.com/articles/
technology/future_tense/2011/07/tahrir_square_was_a_foreseeable_surprise.html on 4 November 2013. - [25] M. Lim. Clicks, cabs, and coffee houses: social media and oppositional movements in Egypt, 2004-2011. J. Communication, 62(2):213–248, 2012.
- [26] G. Lotan, E. Graeff, M. Ananny, D. Gaffney, I. Pearce, and D. Boyd. The revolutions were tweeted: Information flows during the 2011 Tunisian and Egyptian revolutions. Int. J. Commun., 5:1375–1405, 2011.
- [27] C. Meisel and C. Kuehn. On spatial and temporal multilevel dynamics and scaling effects in epileptic seizures. PLoS ONE, 7(2):e30371, 2012.
- [28] S.M. O’Regan and J.M. Drake. Theory of early warning signals of disease emergence and leading indicators of elimination. Theor. Ecol., 6(3):333–357, 2013.
- [29] D. Romero, B. Meeder, and J. Kleinberg. Differences in the mechanics of information diffusion across topics: Idioms, political hashtags, and complex contagion on Twitter. In Proceedings of the 20th International Conference on World Wide Web, pages 695–704, 2011.
- [30] M. Scheffer, J. Bascompte, W.A. Brock, V. Brovkhin, S.R. Carpenter, V. Dakos, H. Held, E.H. van Nes, M. Rietkerk, and G. Sugihara. Early-warning signals for critical transitions. Nature, 461:53–59, 2009.
- [31] D. Slater. Early warning signals of tipping-points in blog posts. preprint, 2012. http://www.mitre.org/work/tech_papers/2012/12_4711/12_4711.pdf on 4 November 2013.
- [32] J.M.T. Thompson and J. Sieber. Climate tipping as a noisy bifurcation: a predictive technique. IMA J. Appl. Math., 76(1):27–46, 2011.
- [33] Z. Tufekci and C. Wilson. Social media and the decision to participate in political protest: observations from Tahrir Square. J. Communication, 62(2):363–379, 2012.
- [34] J.G. Venegas, T. Winkler, G. Musch, M.F. Vidal Melo, D. Layfield, N. Tgavalekos, A.J. Fischman, R.J. Callahan, G. Bellani, and R.S. Harris. Self-organized patchiness in asthma as a prelude to catastrophic shifts. Nature, 434:777–782, 2005.
- [35] A.J. Veraart, E.J. Faassen, V. Dakos, E.H. van Nes, M. Lurling, and M. Scheffer. Recovery rates reflect distance to a tipping point in a living system. Nature, 481:357–359, 2012.
- [36] R. Wang, J.A. Dearing, P.G. Langdon, E. Zhang, X. Yang, V. Dakos, and M. Scheffer. Flickering gives early warning signals of a critical transition to a eutrophic lake state. Nature, 492:419–422, 2012.
- [37] S. Webster. Has social media revolutionized revolutions? World News, 87(15), 2011. Retrieved from http://www.jcunews.com/2011/02/16/has-social-media-revolutionized-revolutions/.
- [38] J. Yang and J. Leskovec. Patterns of temporal variation in online media. In Proceedings of the fourth ACM International Conference on Web Search and Data Mining, pages 177–186, 2011.