A Simulation of the Optical Attenuation of TPB Coated Light-guide Detectors
Abstract
This note is provided as a supplementary section to accompany the paper [1] which has been included in these proceedings. It describes some simple simulations which were performed in order to understand the attenuation behaviors of acrylic light-guides operated in air and argon, which were characterized in [2]. Whilst these simulations are only at the level of sophistication of a toy model, they illustrate interesting non-exponential light attenuation effects and the differences between operating light-guide based detectors in argon and air environments. We investigate the effects of surface absorption, surface roughness and wavelength dependence, and use a model tuned on the light-guide attenuation curve measured in air to make a prediction of the light-guide attenuation curve in argon. This curve is compared with data from a liquid argon test stand, and an improvement over a simple exponential model is observed.
keywords:
Noble-liquid detectors; Photon detectors for UV, visible and IR photons; Scintillators, scintillation and light emission processes1 Introduction and Motivation
A series of tests of coated acrylic light guide detectors for future liquid argon TPC detectors have been made in both air and argon [2]. Both cast and extruded acrylic bars were tested in air, and these have different surface finishes and transverse dimensions, and hence different attenuation behaviors. In the first round of tests, only cast acrylic bars were tested in argon. During analysis of the attenuation data taken in argon and air, two unexpected features emerged. First, the attenuation length measurement obtained from the two sets of tests were not in good agreement. Second, the attenuation behavior in argon was not observed to obey a simple exponential decay.
Whilst initially these features were thought to be caused by instrumental effects in the test stands, subsequent analysis shows that these effects should be expected, to some extent. This note describes a toy simulation which illustrates the origin of both the argon vs air attenuation length discrepancy and of nonexponential attenuation. The model has a single free parameter, corresponding to the coefficient of surface absorption, which we tune using data taken in air and use to make a prediction of the attenuation curve in argon. Despite being a significant oversimplification of the real test geometry, which involves several different surfaces with different absorption coefficients, the prediction made for argon is a signficant improvement over a simple exponential attenuation curve when compared with data. Future studies of coated and uncoated light-guide surface properties could be used to tune a more advanced model with stronger predictive power.
2 Description of the Ray Tracing Model
To model the expected light attenuation behavior in acrylic light guides operated in argon and air we have performed a series of simple ray tracing simulations. In these simulations, isotropic light rays are generated, and each ray is assigned a weight determined by the attenuation processes under consideration. This weight represents the probability that a photon following this trajectory will arrive at the detection end of the light guide, where there is a coupling to a photomultiplier tube or silicon photomultiplier. The relative detected light yield is given by the sum of the weights of all the isotropic rays emitted from a wavelength shifting surface. The bar is represented by a region of solid acrylic with refractive index 1.49, in an environment of either air with refractive index 1.0, or argon with refractive index 1.23. The critical angle for total internal reflection is given by
| (1) |
In principle, light which impinges upon a surface at an angle larger than this will have a reflection coefficient of 1, and light at lower angles will experience a partial reflection with a calculable coefficient . In our model, light rays are emitted by the TPB coating isotropically, and for those rays emitted into the bar we calculate the angle of reflection against each set of surfaces. The number of reflections is then given by
| (2) |
Where L is the length of the bar, is the angle of the ray to the surface normal and is the width of the bar in this direction. The index i labels the two sets of surfaces.
We can imagine three main sources of light attenuation:
-
1.
Loss of light rays from partial reflection below
-
2.
Absorption of light in the acrylic bulk
-
3.
Absorption of light rays at each bounce due to an imperfect optical surface
We account for (1) by applying an attenuation factor to each ray which is below the critical total internal reflection angle, where
| (3) |
The factor is the reflection coefficient expected for a light ray impinging upon an ideal surface separating two materials of different refractive indices, averaged over polarizations.
Additional corrections to this factor may be expected to occur from surface roughness, which causes small changes to the angle of incidence and reflection with each bounce, and therefore allows light rays to deviate outside the region of total internal reflection and escape. We modeled the effect of random surface deviations of between 0.01 and 0.1 radian per bounce, and found a very minimal effect upon the attenuation curves. This is because such small deviations only cause significant losses for light which is very near the critical angle, which in practice is a negligible fraction of all detectable light rays. Surface roughness on the scale of the wavelength of light requires a more in depth treatment, and has not been investigated.
Previous measurements of bulk attenuation in many commercially available acrylics at 440 nm give attenuation lengths of several meters [3]. This suggests that the 40 cm attenuation observed in our light guides is likely to be primarily due to the surface losses of factor (3). Therefore, we assume that the effects of bulk absorption are negligible compared to surface effects. This assumption could be easily relaxed if more information on the bulk or surface properties of our acrylic become available. For the purposes of this model, we set
| (4) |
Factor (3) is incorporated into our model by reducing the weight of each light ray by a constant coefficient of surface absorption, for each reflection. Previous studies of acrylic light guides [4] suggest that is in the few percent range. However, we expect the numerical value of to depend heavily on the manufacturing process and surface finish of the particular acrylic bars used, and so we treat it as a free parameter in the model.
| (5) |
The total attenuated weight of each ray is then given by , and the total light output of the bar is given by the sum of the weights of many randomly generated isotropic light rays.
2.1 Effective Absorption Length from Surface Losses
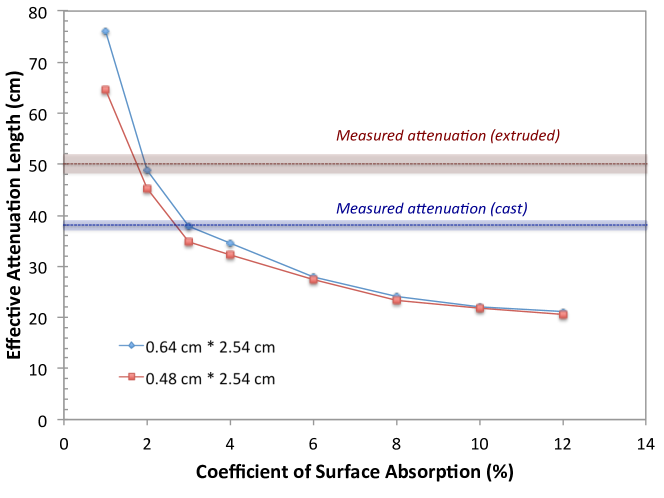
Assuming an infinite bulk absorption length, we can calculate the the effective attenuation length in the 20-50 cm region for different surface absorption coefficients. The actual attenuation length generated by surface absorptions has a dependence on the transverse bar dimensions, since a narrower bar leads to more bounces per unit length than a wider bar.
We have simulated the effective 20-50 cm attenuation length for both 0.48x2.54 cm bars and 0.64x2.54 cm bars in air for several values of the coefficient of surface absorption. The calculated attenuation lengths are shown in Figure 1. If all attenuation in our light guides were from surface absorption, we expect a per-bounce absorption coefficient of around 2% for the extruded acrylic bars (which have the smaller cross section), and around 3% for cast acrylic bars (which have the larger cross section).
2.2 Non-exponential Form of Attenuation Curves
The form of the attenuation curve produced by our model is not expected to be exponential. Since both the number of surface reflections per unit length and the subcritical ray reflection coefficient depend on the angle of the ray being traced, rays at different angles are lost at different rates. Therefore the angular composition of the light beam is changed at larger distances, and the attenuation behavior has a nontrivial distance dependence. The attenuation behavior also depends on the refractive index of the operating environment, since the critical angle and subcritical ray reflection coefficients both have a refractive index dependence. Hence we expect to see different attenuation behavior in argon and air.
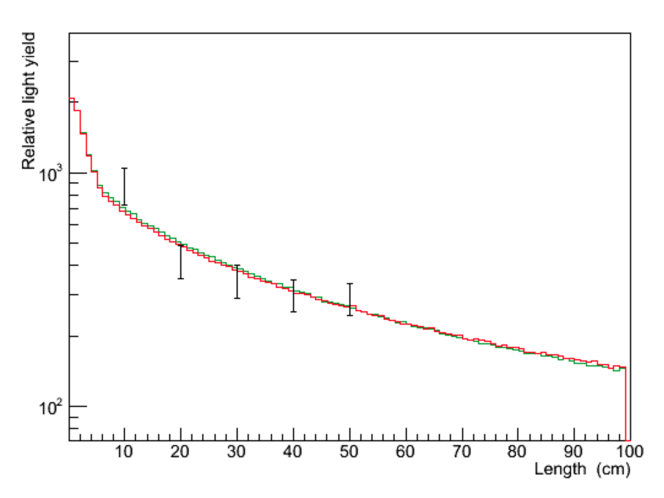
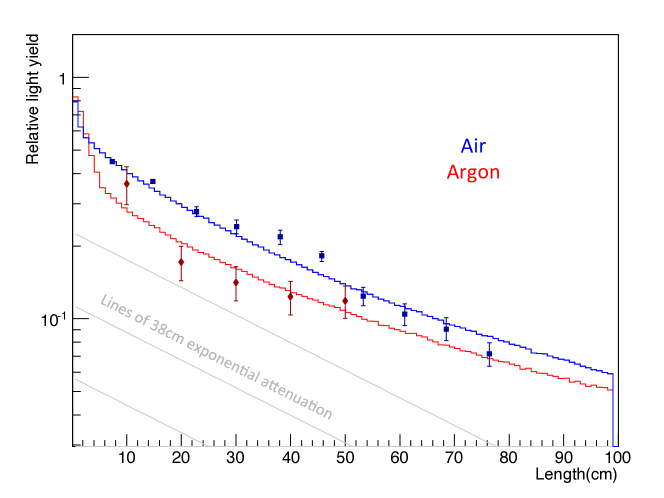
Assuming that the cast acrylic rods used in both the argon and air studies have identical indices of refraction and surface absorption coefficients, we can calculate the shapes of the attenuation curves given an infinite bulk attenuation length. These curves are shown, with measurements from [2] overlaid, on figure 2. On the same plot are marked lines of 38 cm exponential attenuation to highlight the nontrivial attenuation behavior. The only tunable parameter in this simulation is the per-reflection absorption coefficient, which is set to 3%, as extracted from the effective attenuation length of the cast acrylic light guides in air as described in section 2.1.
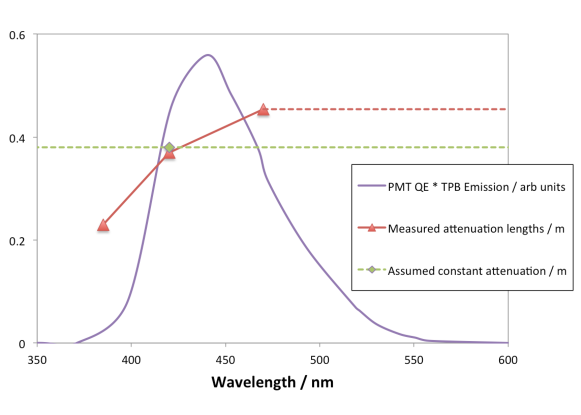
2.3 Incorporating Wavelength Dependent Effects
Measurements of attenuation of monochromatic light at the University of Indiana indicate that TPB coated light-guide attenuation has a wavelength dependence over the TPB emission spectral range. The measured wavelength dependent attenuation length is shown in Figure 3 overlaid on a curve showing TPB emission spectrum multiplied by PMT quantum efficiency, which gives the relevant spectrum of detectable rays. There is a 10-20% variation over the range of interest, leading to contributions both above and below the previously assumed constant attenuation length of 38 cm. We expect this variation to produce an additional nonexponetnial contribution to the attenuation behavior.
Incorporating these effects into the ray tracing simulation described above, we can produce an attenuation curve with a wavelength dependent surface absorption. This curve is shown overlaid on the previously generated curve, which assumed a constant absorption coefficient, in Figure 4. We see that the overall effect averaged over all detectable rays is minimal, mainly because there are both positive and negative contributions at different points in the spectral range. We have also investigated the effect of this wavelength dependence on the simple bulk attenuation model, and found its impact to be similarly minimal.
Acknowledgements.
This work was supported by the National Science Foundation (PHY-1205175).References
- [1] C.M.Ignarra, TPB-coated Light Guides for Liquid Argon TPC TPB-coated Light Guides for Liquid Argon TPC Light Detection Systems, Included in the proceedings of this conference (2013).
- [2] B. Baptista, L. Bugel, C. Chiu, J. Conrad, C. Ignarra, et al., Benchmarking TPB-coated Light Guides for Liquid Argon TPC Light Detection Systems, arXiv:1210.3793.
- [3] N. Phan, “Acrylic Attenuation Measurements for the Acrylic Attenuation Measurements for the MiniCLEAN Dark Matter Detector.” http://panda.unm.edu/pandaweb/undergraduate/programs/honorsThesis/NguyenPhanThesis2009.pdf.
- [4] P. Huffman, “TPB Coated Detectors for the nEDM Experiment.” http://tpb.lns.mit.edu/mediawiki/index.php/.