Using [Ci] to probe the Interstellar Medium in Sub-Millimeter Galaxies 111Based on observations carried out with the IRAM Plateau de Bure Interferometer. IRAM is supported by INSU/CNRS (France), MPG (Germany) and IGN (Spain).
Abstract
We present new [Ci](1–0) and 12CO(4–3) Plateau de Bure Interferometer (PdBI) observations of five Sub-Millimeter Galaxies (SMGs) and combine these with all available [Ci](1–0) literature detections in SMGs to probe the gas distribution within a sample of 14 systems. We explore the [Ci](1–0) properties of the SMG population, particularly investigating the ratio of the [Ci](1–0) luminosity to various 12CO transition and far-infrared luminosities. We find that the SMGs with new observations extend the spread of to much higher values than found before, with our complete sample providing a good representation of the diverse SMG population. We compare the line ratios to the outputs of photodissociation region (PDR) models to constrain the physical conditions in the interstellar medium (ISM) of the SMGs, finding an average density of and an average radiation field (in terms of the local field value, ) of . Overall, we find the SMGs are most comparable to local ULIRGs in and , however a significant tail of 5 of the 14 SMGs are likely best compared to less compact, local starburst galaxies, providing new evidence that many SMGs have extended star formation distributions and are therefore not simply scaled up versions of local ULIRGs. We derive the ISM properties of a sample of quasars also finding that they have higher densities and radiation fields on average than the SMGs, consistent with the more extreme local ULIRGs, and reinforcing their interpretation as transition objects. We explore the limitations of using simple PDR models to understand [Ci], which may be concomitant with the bulk H2 mass rather than PDR-distributed. We therefore also assess [Ci] as a tracer of H2, finding that for our sample SMGs, the H2 masses derived from [Ci] are often consistent with those determined from low excitation 12CO. We conclude that [Ci] observations provide a useful tool to probe the bulk gas and gas processes occurring within merging SMGs, however more detailed, resolved observations are required to fully exploit [Ci] as a diagnostic.
keywords:
galaxies: evolution - galaxies: high redshift - galaxies: starburst - galaxies: ISM1 Introduction
The ultra-luminous Sub-Millimetre Galaxies (SMGs) contribute significantly to the rapid build-up of stellar mass in the Universe at (e.g., Chapman et al. 2005). They have large molecular gas reservoirs with gas masses of 1010 M⊙ (Greve et al., 2005; Bothwell et al., 2013) and high star formation rates (SFRs) implying that they can build a stellar mass of 1010 M⊙ in only 100 Myr of continuous star formation (Magnelli et al., 2012), and are therefore often interpreted as being the progenitors of the massive ellipticals observed locally. Investigating the dense cool interstellar medium (ISM) in high-redshift SMGs is important for understanding the mechanisms for triggering these high SFRs and probing the fuel supply for the star formation.
The immense luminosities in local ULIRGs often appear to be triggered by mergers and interactions (Sanders & Mirabel, 1996). However the star formation in local ULIRGs is much more centrally concentrated than high- ULIRGs (Sakamoto et al., 2008) where carbon monoxide (12CO) and radio observations have shown that the gas can be extended on scales up to kpc and often comprise multiple components (Chapman et al., 2004; Biggs & Ivison, 2008; Tacconi et al., 2008; Bothwell et al., 2010; Ivison et al., 2011) highlighting a difference in the local and high-redshift populations. Menéndez-Delmestre et al. (2009) also suggest the SMGs contain extended cool and warm dust distributions from mid-infrared spectroscopic observations of the polycyclic aromatic hydrocarbon (PAH) emission. Observations of the [Cii] cooling line in SMM J213511, the ‘Eyelash’, suggest that this system consists of extended starburst clumps, providing further support that SMGs are not scaled up versions of local ULIRGs (Ivison et al., 2010) whilst studies of the rest-frame near-infrared colours of SMGs indicate that the SMGs have more widely distributed star formation than the compact local ULIRGs (Hainline et al., 2009). Studies of carbon monoxide transitions and the cooling lines in the SMGs can therefore be used to search for the trigger of the intense star formation by determining the extent of the fuel for the star formation.
Studying various 12CO transitions can help constrain the physical conditions within the galaxies. However with only 12CO measurements, a number of properties of the molecular gas are degenerate (density and kinetic temperature; Walter et al. 2011) so other tracers are required to break this degeneracy, for example multiple 13CO lines, HCN and [Ci]. The ratios of the [Ci] lines with other 12CO transitions have been suggested as diagnostics in photodissociation region (PDR) models in which far-ultraviolet photons illuminate molecular clouds (Hollenbach & Tielens, 1999) controlling the properties of the interstellar medium (ISM). In the one dimensional PDR slab models of Kaufman et al. (1999) a relatively thin layer of neutral atomic gas is predicted in between the transition from the C+ rich outer layer to the CO rich inner volume, naively implying that the [Ci] should not be able to trace the bulk H2 mass. However there is observational evidence that [Ci] does trace the same distribution as the 12CO and therefore the H2, as discussed by Papadopoulos et al. (2004). The two [Ci] transitions are easily excited and provide a more complete H2 mass tracer than the high-J 12CO lines found closest in frequency (12CO(4–3) and 12CO(7–6)), since high excitation 12CO is unequivocally tied to the star-forming, warm and dense gas. Viable explanations for [Ci] spatially correlating to the bulk H2 mass tracers employ clumpy, inhomogeneous PDR models (Meixner & Tielens, 1993; Spaans, 1996) where the surface layers of [Ci] are distributed across the clouds in clumps. The widespread [Ci] distribution is therefore predicted in the PDR model of Spaans (1996) however the intensity correlation has yet to be tested over a wide range of environments (Keene et al., 1996).
Observations of [Ci] transitions have shown that the ratio of L L (where L′ is the line luminosity in units of K kms-1 pc2) provides a sensitive probe of the temperature of the interstellar medium at moderate densities. Both lines have modest critical densities (– cm-3) and are therefore often thermalised in molecular clouds with cm-3. The lines arise from states with energy levels T K and T K above the ground state, and thus their ratio is sensitive to the gas temperature if T K. Furthermore, the H2 gas mass determined from the [Ci] line agrees with the H2 mass from multi-transition 12CO and dust continuum observations in local ULIRGs (Papadopoulos & Greve, 2004), Arp220 (Gerin & Phillips, 1998) and the Cloverleaf QSO (Weiß et al., 2003), validating its utility across a large range in physical environments.
Since its initial detection in interstellar clouds (Phillips & Huggins, 1981), [Ci] has been detected in a number of local systems, including near the Galactic centre (Ojha et al., 2001), in local giant molecular clouds (Orion A and B; Ikeda et al. 2002), nearby external galaxies (Israel & Baas, 2002; Gerin et al., 2002) and in local ULIRGs (Papadopoulos & Greve, 2004). However, [Ci] has only been detected in a small number of high-redshift systems, mainly gravitationally lensed SMGs and quasars, some of which may suffer from differential lensing uncertainties between potentially vast reservoirs of low-excitation gas and dense regions of star forming gas (Wagg et al., 2006; Weiß et al., 2005; Ao et al., 2008; Riechers et al., 2009; Barvainis et al., 1997; Lestrade et al., 2010; Danielson et al., 2011; Pety et al., 2004).
Initial studies of [Ci] in SMGs have been carried out by Walter et al. (2011) who present detections of [Ci](1–0) and [Ci](2–1) in a sample of 14 SMGs and quasars, concluding that the [Ci] properties of these high-redshift systems are not significantly different to local systems and the Milky Way. However, the majority of the Walter et al. (2011) SMG sample are either strongly gravitationally lensed or have strong AGN components, or both. There is, therefore, a need to understand the [Ci] gas distribution in a sample of un-lensed SMGs whose properties are dominated by the star formation rather than an AGN. In this paper we study the [Ci] line in a sample of SMGs, five of which have newly obtained observations with the remainder taken from literature, to test its use as a diagnostic of the ISM physical conditions within SMGs. We explore the dichotomy in the use of [Ci] as a tracer of the bulk H2 mass and its use in assessing the outputs from PDR modelling relative to well studied sources and a range of galaxy types. All calculations assume a flat, cold dark matter (CDM) cosmology with and kms-1Mpc-1.
2 Sample, Observations and Reduction
To complement the initial studies of [Ci] in SMGs from Walter et al. (2011), we selected five additional, un-lensed, SMGs from extensive spectroscopic surveys expanding the Chapman et al. (2005) sample. Two of these SMGs are components in a wide-separation major merger, as presented in Alaghband-Zadeh et al. (2012). The SMGs were observed in [Ci]() (rest frequency: 492.161 GHz), which we refer to as [Ci](1–0) from here on, and 12CO(4–3) (rest frequency: 461.041 GHz). These SMGs were chosen to have well detected, resolved H lines to enable direct comparison of the ionized gas component in these galaxies. They were also all selected to lie in equatorial fields to enable further followup with the Atacama Large Millimeter/submillimeter Array (ALMA). The redshift range we covered matches the peak of the SMG population ( – Chapman et al. 2005; Wardlow et al. 2011). These sources have been mapped in H from integral field spectroscopy observations made with Gemini-NIFS and VLT-SINFONI. The H intensity maps show multiple peaks of star formation and the velocity and velocity dispersion maps are turbulent and disturbed, distinguishing them from smooth, disk-like systems. These SMGs are classified as mergers using a variety of criteria, including a kinemetry analysis (Alaghband-Zadeh et al. 2012). Four of our new sources do not show any signs of AGN in any wavelength, while the fifth has a broad AGN (a component in the large separation (kpc) major merger). The combined sample these new targets and the Walter et al. (2011) SMGs displays a large range of environments (different stages of mergers and a range of AGN contributions) and are well suited to assessing the diagnostic power of the [Ci] line.
| ID | RA | Dec | z | tCO(4-3) | t[CI](1-0) | ||||
|---|---|---|---|---|---|---|---|---|---|
| (hrs) | (hrs) | (mJy) | (mJy) | GHz | GHz | ||||
| SXDF7 (J0217-0505) | 02:17:38.92 | -05:05:23.7 | 2.5286[8] | 3.2 | 5.1 | 0.30.1 | 7.11.5 | 130.6 | 139.4 |
| SXDF11 (J0217-0459) | 02:17:25.12 | -04:59:37.4 | 2.2821[8] | 3.3 | 3.3 | - | 4.51.9 | 138.5 | 148.9 |
| SXDF4a (J0217-0503a) | 02:17:38.62 | -05:03:37.5 | 2.0298[2] | 2.1 | 7.8 | 0.50.1 | 2.20.85 | 151.9 | 162.2 |
| SXDF4b (J0217-0503b) | 02:17:38.62 | -05:03:37.5 | 2.0274[1] | 2.1 | 7.8 | 0.40.1 | 2.20.85 | 151.9 | 162.2 |
| SA22.96 (J2218-0021) | 22:18:04.42 | 00:21:54.4 | 2.5169[7] | 3.0 | 5.3 | 0.20.1 | 9.02.3 | 131.1 | 139.9 |
These additional SMGs were observed with the Plateau de Bure Interferometer (PdBI) in 2011 in D configuration. The summer observations used a sub-array, 5 antennae configuration, while the 6th antenna was being serviced. The SMGs were observed at their redshifted [Ci] and 12CO(4–3) frequencies lying well within the band of the 2mm receivers (Table 1).
The observations were reduced using the GILDAS software from IRAM. Data were flagged and removed that had high phase RMS, as well as other data with large amplitude losses, pointing, focus or tracking errors. The flux calibrators used for the 12CO(4–3) observations were a selection of 3C454, 3C454.3, MWC349 and 1749-096 and the phase and amplitude calibrators were a selection of 0130-171, 0138-097, 0237-027 and 2223-052. The flux calibrators used for the [Ci](1–0) observations were a selection of 3C454.3, MWC349 and 1749-096 and the phase and amplitude calibrators were a selection of 0130-171, 0106+013 and 2223-052. The seeing ranged from 0.91′′ to 2.02′′. The phase RMS values range from approximately 10-35 degrees, on average, and the average water vapour measure is approximately 7 mm. The MAPPING routine was used to produce the calibrated datacubes which could then be output for analysis.
The large beam sizes of the 12CO(4–3) observations (Table 2), mean that we do not resolve any of the galaxies. Indeed, we expect the 12CO(4–3) emission regions to be compact, emanating mainly from star forming regions. However, the [Ci](1–0) emission could be much more extended, tracing the full cold gas distribution as 12CO(1–0) does. Ivison et al. (2011) determine typical 12CO(1–0) sizes of 16 kpc in luminous SMGs. At this size the corresponding [Ci](1–0) emission would still remain unresolved in our observations (Table 2). The beam shapes are shown in Figs 1, 2, 3 and 4. The 1.4 GHz positions and redshifts from the new 12CO(4–3) observations are given in Table 1 along with the on-source integration times for each line at their respective observed-frame frequencies.
| ID | Beam Size[CI](1-0) | Physical Scale[CI](1-0) | Beam SizeCO(4-3) | Physical ScaleCO(4-3) |
|---|---|---|---|---|
| (arcsec) | (kpc) | (arcsec) | (kpc) | |
| SXDF7 | 4.4 3.5 | 40 30 | 7.1 3.6 | 60 30 |
| SXDF11 | 8.0 3.2 | 70 30 | 4.4 3.5 | 40 30 |
| SXDF4 | 5.1 2.7 | 40 20 | 4.4 3.3 | 40 30 |
| SA22.96 | 4.8 3.2 | 40 30 | 4.5 3.8 | 40 30 |
3 Analysis
3.1 [Ci](1–0) and 12CO(4–3) line extraction
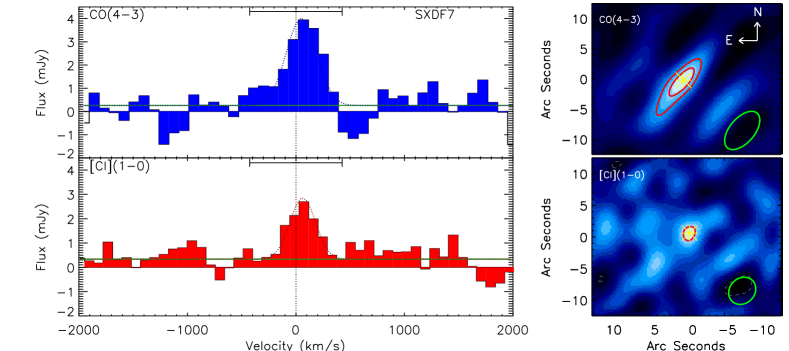
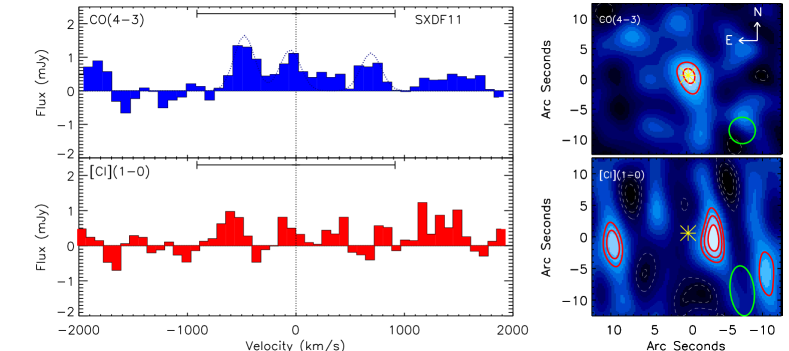
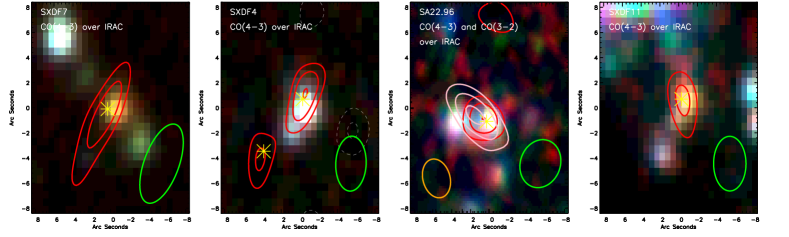
In Figs. 1–4 we show signal-to-noise (S/N) maps of the 12CO(4–3) and [Ci](1–0) lines. We extract beam averaged, one dimensional spectra from the S/N peaks of the maps. We find that these peaks are clearly associated to faint sources in the IRAC imaging identified by previous radio continuum observations, as shown in Fig. 5.
Continuum was significantly detected in the extra-line regions of the [Ci](1–0) observations for four of the five SMGs: SXDF4a, SXDF4b, SXDF7 and SA22.96. In order to measure the continuum at the observed frequency of [Ci](1–0) in each source, we measure the median flux in the region outside the [Ci](1–0) lines. This median is shown by the horizontal lines in the extracted one dimensional spectra in Figs. 1, 3 and 4. We subtract this median level from the spectra before further analysis. We use the measured continuum levels from the [Ci](1–0) observations to subtract continuum from the detected 12CO(4–3) sources, since the latter observations (with shorter integration times, and longer wavelengths) do not detect continuum as significantly. The continuum levels are estimated at the rest frequency of 12CO(4–3) by multiplying the measured continuum at the rest frequency of [Ci](1–0) by , where =2 (Magnelli et al., 2012) represents the average spectral energy distribution (SED) of SMGs. Since we do not detect continuum in SXDF11 we do not subtract continuum from either SXDF11 spectrum.
In Figs. 1–4 we show Gaussian fits to the line profiles, often finding multiple components are a better representation of the profile. We show multiple component fits if the fit is improved by allowing more than one Gaussian component. In order to determine the 12CO(4–3) and [Ci](1–0) line fluxes and widths we use a second order moment analysis, to accurately represent the full profiles of the lines. First the redshift of the line is calculated as the intensity-weighted centroid of the line, with the line width () calculated using the intensity-weighted second order moment. We then calculate the flux by integrating between 2.
The 12CO(4–3) fluxes, calculated in this way, are given in Table 3 and the 2 regions are marked on the spectra in Figs. 1–4. Since the [Ci](1–0) detections are weaker than the 12CO(4–3) detections and the line profiles are not as well defined, we use the 12CO(4–3) defined velocity range to integrate the [Ci](1–0) flux. The resulting [Ci](1–0) fluxes are also given in Table 3.
In Table 3 we bring together the line measurements of our five new SMGs with the literature measurements of [Ci](1–0) in SMGs from Walter et al. (2011), Cox et al. (2011) and Danielson et al. (2011). We also bring together the available 12CO(1–0), 12CO(3–2) and 12CO(4–3) fluxes for this sample. Before discussing the properties of the complete sample we briefly discuss each of the new observations in turn.
| ID | z | I[CI](1-0) | I[CI](2-1) | ICO(4-3) | ICO(3-2) | ICO(1-0) | References |
| (Jy kms-1) | (Jy kms-1) | (Jy kms-1) | (Jy kms-1) | (Jy kms-1) | |||
| SXDF7 | 2.529 | 0.80.2 | - | 1.60.3 | - | - | 0 |
| SXDF11 | 2.282 | 0.7 | - | 1.00.2 | - | - | 0 |
| SXDF4a | 2.030 | 0.70.2 | - | 1.10.3 | - | - | 0 |
| SXDF4b | 2.027 | 0.7 | - | 1.60.5 | - | - | 0 |
| SA22.96 | 2.517 | 0.70.2 | - | 1.30.3 | 1.60.5 | - | 0,3 |
| J02399 | 2.808 | 1.90.2 | 1.80.9 | - | 3.10.4 | 0.600.12 | 1,2,9 |
| J123549 | 2.2020 | 1.10.2 | 1.0 | - | 1.680.17 | 0.320.04 | 2,3,4 |
| J163650 | 2.3834 | 0.72 | 2.0 | - | 1.970.14 | 0.340.04 | 2,3,4 |
| J163658 | 2.4546 | 0.90.2 | 2.0 | - | 1.50.2 | 0.370.07 | 2,3,4 |
| J14011 | 2.5652 | 1.80.3 | 3.10.3 | - | 2.80.3 | 0.320.03 | 2,5,11 |
| J16359 | 2.51737 | 1.70.3 | 1.60.3 | 4.00.4 | 2.80.2 | - | 2,6 |
| J213511 | 2.3259 | 16.00.5 | 16.20.6 | 17.30.2 | 13.20.1 | 2.160.11 | 7 |
| ID141 | 4.243 | 2.80.9 | 3.41.1 | 7.50.9 | - | - | 8 |
| MM18423+5938 | 3.930 | 2.30.5 | 4.20.8 | 4.950.05 | - | - | 2,10 |
3.1.1 SXDF7
The S/N contours of SXDF7 shown in Fig. 1 reveal clear detections of both 12CO(4–3) and [Ci](1–0). Neither line shows any extension beyond the beam shape, and we interpret the source as unresolved in both lines. The offset between the 12CO(4–3) and [Ci](1–0) detections of 1.1′′ is not significant compared to the 7.13.6′′ beam size of in the 12CO(4–3) observations. The H map of SXDF7 indicates that it comprises two merging components separated by 41 kpc () in projection and 10050 kms-1 in velocity (Alaghband-Zadeh et al., 2012), however owing to the large beam size in these observations compared to the H observations we cannot determine that the 12CO(4–3) and [Ci](1–0) lines are resolved on those scales.
3.1.2 SXDF11
The 12CO(4–3) spectrum of SXDF11 extracted from the peak of the S/N map in Fig 2 shows multiple velocity components. We use the second order moment analysis to determine the line profile properties. While , the S/N peak in the [Ci](1–0) line is offset from the well centred peak (1.00.2 mJy) of the 12CO(4–3) line by 3.6′′, larger than the 3.2′′ FWHM beam size (east-west) of the [Ci](1–0) observations, therefore we do not consider this [Ci](1–0) peak to originate from the same galaxy as the 12CO(4–3) detection. The 12CO(4–3) detection is centred on a radio-identified source in the IRAC imaging shown in Fig. 5. For further analysis, we treat [Ci](1–0) as undetected in SXDF11 and quote a 3 upper limit to the [Ci](1–0) flux in Table 3. We note, however, that the ‘offset’ source, apparently detected in [Ci](1–0) and not 12CO(4–3) may represent a more quiescent star-forming galaxy (and therefore with weak 12CO(4–3) emission) in a group with the highly star-forming SXDF11 system.
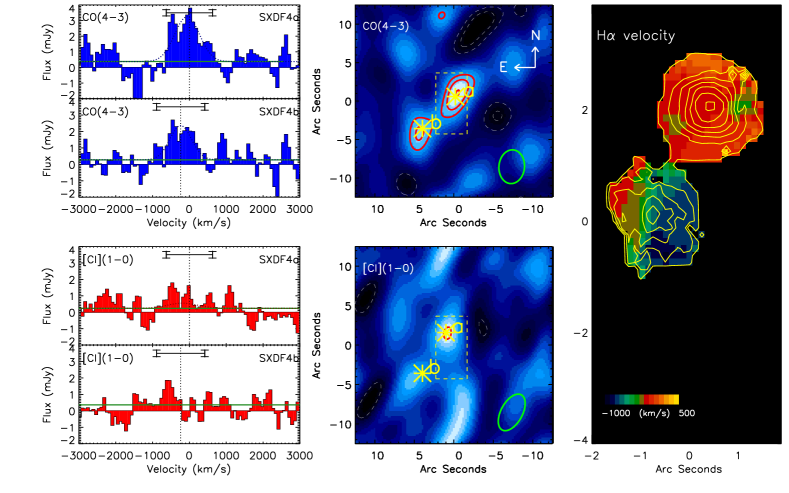
3.1.3 SXDF4a and SXDF4b
The S/N map of 12CO(4–3) for SXDF4 reveals extended 12CO(4–3), spanning two components, extending beyond the beam shape suggesting the source is resolved even with this large beam size (4.4′′ by 3.3′′). Two massive components are also seen in the strong H detections of two high SFR galaxies presented in Alaghband-Zadeh et al. (2012) (separated by a velocity of 67070 kms-1 and spatially by 185 kpc). However, the two 12CO(4–3) components are separated by 493 kpc, slightly larger than the FHWM of the beam, and in velocity space by 23040 kms-1, as shown in Fig. 3, significantly larger than the H spatial separation. This ‘b’ component in 12CO(4–3) could represent a third source in the complex SXDF4 system; the offset between the southern H galaxy and the 12CO(4–3) ‘b’ position is greater than the CO beam size, and the ’b’ component lies just beyond the H IFU map. We consider the two components to be separate SMGs, and extract the spectra from the peak S/N pixel of each component. While there is significant velocity overlap between the beam-averaged broad lines, there is little or no spatial overlap. We cannot rule out that some of the intervening CO emission is coming directly from the second H galaxy.
We note that the H maps highlight SXDFa as two highly star-forming galaxies in a major merger (Alaghband-Zadeh et al., 2012), providing useful additional diagnostics to the 12CO maps of the molecular gas, despite H being heavily extinct in these dusty galaxies (Takata et al., 2006). These two H components are not resolved spatially or in velocity in our 12CO(4–3) map, and higher resolution, sensitive 12CO observations would provide a crucial comparison to the H map. The combination of H and 12CO observations clearly provides a more complete picture of starburst galaxies, as found for instance in studies of local starbursts such as M82 where H also highlights a significant component of the ionized gas in outflows (Bland & Tully, 1988).
We also detect 2mm continuum across both components (Table 1) and the south-east extension is seen in the IRAC 3.6 m imaging shown in Fig. 5. The 2mm continuum in the ‘a’ and ‘b’ components is indistinguishable within the errors, therefore we also split the unresolved 850 m and Herschel-SPIRE fluxes equally, leading to equal far-infrared luminosities for ‘a’ and ‘b’ .
We note that the [Ci](1–0) detection in SXDF4a is offset from the 12CO(4–3) detection by 1.6′′ however since this is well within the beam size of the [Ci](1–0) observations we consider the [Ci](1–0) detection to be associated with the same source as the 12CO(4–3). [Ci](1–0) is not significantly detected in SXDF4b therefore we quote a 3 upper limit to the [Ci](1–0) flux for this component.
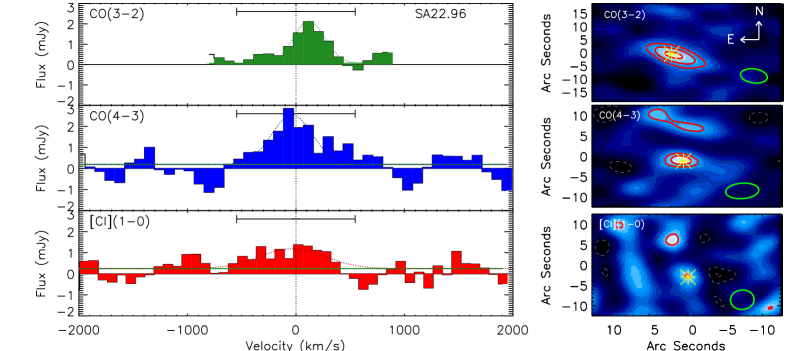
3.1.4 SA22.96
In Fig. 4 we show the 12CO(4–3) and [Ci](1–0) observations of SA22.96 along with a reanalysis of the 12CO(3–2) observations from Bothwell et al. (2013). The 12CO(3–2) is clearly extended beyond the beam in this system, suggesting that there may be a second component to the east of the primary source identified by radio continuum and our 12CO(4–3) and [Ci](1–0) detections. A second source in the IRAC imaging (shown in Fig. 5) may be the counterpart to the extended 12CO(3–2), however this component is not detected in our 2mm continuum map or the 1.4GHz radio map, and we do not separate this potential second component out in the analysis of the 12CO(3–2) spectrum.
We also note that the centre of the 12CO(3–2) detection is 2.7′′ offset to the east from the centre of the 12CO(4–3) detection, which could again reflect two components contributing to the 12CO(3–2) flux. However, since the error in the positions of the lines is 1.3′′, the two CO transitions are just consistent with still being a single source, and we treat them as such hereafter.
We also note that the H map centred on the 12CO(4–3) centroid reveals two components with separation (Alaghband-Zadeh et al. 2012) demonstrating that SA22.96 is clearly in the process of a major merger, however the H map does not spatially cover the potential eastern source.
4 Results
4.1 Line Profiles
In this section, we compare 12CO and [Ci](1–0) line-widths within our new sample, and also in the literature sources, to set a context for whether the lines are tracing the same gas kinematically. In our three sources where [Ci](1–0) is detected, we compare in Table 4 the 12CO(4–3) and [Ci](1–0) line-widths (quantified as ), now determined independently from a second order moment analysis.
We first apply the second order moment analysis directly on the [Ci](1–0) detections, which will serve as a verification of our method in Section 3.1 of determining [Ci](1–0) fluxes by integrating over velocity channels determined by fitting the higher S/N 12CO(4–3) lines. Despite some apparent differences in the velocity centroids from the 12CO(4–3) lines, we find the [Ci](1–0) line-widths are still consistent within errors with the 12CO(4–3) line-widths in all cases. The [Ci](1–0) fluxes determined directly in this way are also mostly within the errors of the fluxes determined using the 12CO(4–3) defined velocity channels. The exception is SXDF4a, where the weak [Ci](1–0) line surrounded by strong continuum is particularly difficult to measure without reference to 12CO(4–3).
The median line-width ratio of to is 1.010.09 indicating a good agreement and therefore suggesting that the [Ci](1–0) may highlight similar gas distributions as the 12CO(4–3). However, the lower S/N of the [Ci](1–0) lines implies that we cannot rule out the slightly broader lines (at the 10-20% level) in this low excitation gas that might be expected based on work by Ivison et al. (2011) for the 12CO(1–0) line in SMGs.
We then compare the line-widths of four SMGs which have [Ci](1–0) detections from Walter et al. (2011) and 12CO(1–0) detections from Ivison et al. (2011) and Thomson et al. (2012). We apply the second order moment analysis to the line profiles (see Table 4) finding that two of the four (J123549 and J163658) have consistent [Ci](1–0) and 12CO(1–0) line-widths. However the remaining two (J02399 and J163650) have significantly larger 12CO(1–0) line-widths compared to our measured [Ci](1–0) line-widths by 100 kms-1 in , a 50% increase. Our measurements for these two are actually very similar to the higher-J CO lines (Bothwell et al., 2013). Indeed, Ivison et al. (2011) find that in most cases, the gas probed by 12CO(1–0) is more spatially extended than the gas probed by higher-J 12CO(3–2).
It appears that we cannot conclude that the [Ci](1–0) line is always tracing the full cold gas component probed by the 12CO(1–0) line, which may be a result of both optical depth and radiative transfer effects as explored in detail in Papadopoulos et al. (2004). Further detailed comparisons and resolved studies of 12CO(1–0) to [Ci](1–0) are needed to probe this further and understand the origin of the differences.
However, in order to compare the brightness distributions of these two tracers, and thus the use of each line as H2 mass tracers, the sensitivities of both the [Ci](1–0) and 12CO(1–0) moment maps must reach the same gas mass surface density limit. When imaging high-redshift 12CO(1–0) with the Karl G. Jansky Very Large Array (JVLA) and [Ci](1–0) with ALMA, resolution and UV-plane coverage need to be well matched.
From this context we next look at the line luminosities and ratios in 12CO and [Ci](1-0).
| ID | |||
|---|---|---|---|
| kms-1 | kms-1 | kms-1 | |
| SXDF7 | 19030 | 22060 | - |
| SXDF4a | 25040 | 23020 | - |
| SA22.96 | 27040 | 27030 | 27030 |
| ID | |||
| J02399 | 26020 | 38010 | - |
| J123549 | 20040 | 2275 | 23020 |
| J163650 | 23020 | 32010 | 33035 |
| J163658 | 26020 | 29010 | 29510 |
4.2 Line luminosities and ratios
To understand the range of gas properties in SMGs, we bring together the sample of 14 SMGs with [Ci](1–0) observations, including the five new observations from this work and the nine [Ci] detections from literature (Walter et al., 2011; Danielson et al., 2011; Cox et al., 2011), and convert the [Ci] and 12CO integrated fluxes to luminosities using the following relation (Solomon & Vanden Bout, 2005):
| (1) |
where I is the integrated flux in units of Jy km s-1, DL is the luminosity distance in units of Mpc and is the central frequency of the line.
In the cases where no 12CO(4–3) detections are available we use the available 12CO(3–2) luminosity and a template CO spectral line energy distribution (SLED) from Bothwell et al. (2013) to convert the 12CO(3–2) luminosity to a 12CO(4–3) luminosity for direct comparison with our new sample. We also derive 12CO(1–0) luminosities (from the 12CO(4–3) luminosities) for the 9 of 14 sources which have not been observed in 12CO(1–0). The template from Bothwell et al. (2013) includes all the recent 12CO(1–0) detections in SMGs and therefore takes into account that the average SMG is best represented by a two component medium with a cooler component more widely distributed than a star-forming one, visible only via the high-J CO line emission. For reference, the relevant conversion factors are and (Bothwell et al., 2013).
The far-infrared luminosities for SXDF7, SXDF11, SXDF4a, SXDF4b and SA22.96 are derived from modified black body SED fits to the available photometry utilising Herschel-SPIRE fluxes as detailed in Alaghband-Zadeh et al. (2012), and as refined in Section 3.1.3. The far-infrared luminosities for the literature sample are taken from Walter et al. (2011) and Cox et al. (2011) and are corrected by a factor of 1.2 to represent the luminosity from integrating under a modified blackbody curve from 8–1000 m rather than the 40–400 m quoted in Walter et al. (2011). All luminosities are corrected for gravitational lensing using the magnification factors in Table 5. The resulting luminosities are given in Table 5.
| ID | |||||||
| (1010K kms-1 pc2) | (1010K kms-1 pc2) | (1010K kms-1 pc2) | (1010K kms-1 pc2) | (1010K kms-1 pc2) | (1013L⊙) | ||
| SXDF7 | 1.30.3 | - | 2.90.6 | 3.70.8 | 72 | 0.210.05 | 1 |
| SXDF11 | 1.0 | - | 1.60.3 | 2.00.4 | 3.90.8 | 0.150.05 | 1 |
| SXDF4a | 0.70.3 | - | 1.40.4 | 1.70.5 | 31 | 0.090.02 | 1 |
| SXDF4b | 0.8 | - | 2.00.6 | 2.50.8 | 52 | 0.090.02 | 1 |
| SA22.96 | 1.20.4 | - | 2.30.6 | 62 | 62 | 0.50.1 | 1 |
| J02399 | 1.50.2 | 0.50.3 | 3.80.5 | 4.90.6 | 82 (91) | 0.70.3 | 2.5 |
| J123549 | 1.40.3 | 0.5 | 3.40.3 | 4.40.4 | 7.50.9 (8.40.8) | 0.50.2 | 1 |
| J163650 | 1 | 1 | 4.60.3 | 5.90.4 | 91 (11.30.8) | 0.50.2 | 1 |
| J163658 | 1.40.3 | 1 | 3.70.5 | 4.70.6 | 102 (91) | 0.70.3 | 1 |
| J14011 | 0.70. | 0.480.05 | 1.90.2 | 2.40.3 | 2.40.24.50.5 | 0.20.1 | 4 |
| J16359 | 0.120.02 | 0.0430.008 | 0.330.03 | 0.420.03 | 0.800.08 | 0.050.02 | 22 |
| J213511 | 0.690.02 | 0.260.01 | 0.850.01 | 1.1590.009 | 1.710.09 (2.080.02) | 0.230.09 | 32.5 |
| ID141 | 0.50.2 | 0.240.08 | 1.60.2 | 2.10.2 | 3.90.5 | 0.430.02 | 20 |
| MM18423+5938 | 0.390.08 | 0.260.05 | 0.950.01 | 1.200.01 | 2.310.02 | 0.230.09 | 20 |
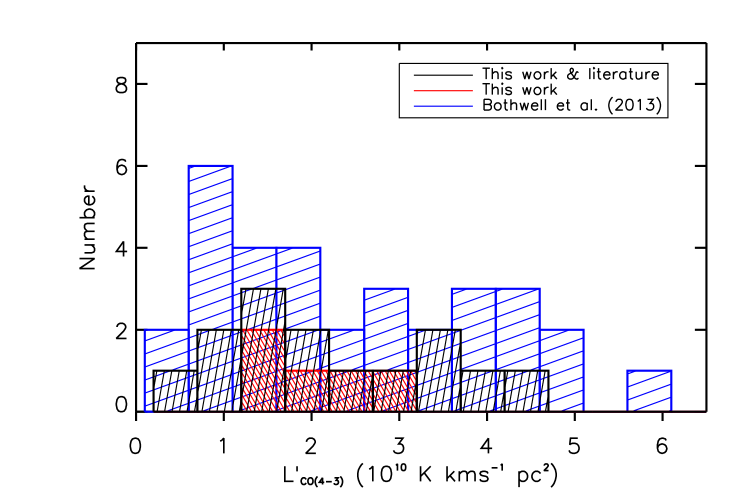
We first aim to put our SMGs with new [Ci] detections in this work in context with the SMGs with literature [Ci] detections. The two samples have similar median : 2.00.41010 K kms-1pc2 for the SMGs with new detections and 211010 K kms-1pc2 for the literature SMGs, but the literature sample spans a broader distribution. The combination of both samples probes the 12CO(4–3) distribution of a large sample of SMGs studied in 12CO from Bothwell et al. (2013) well, as shown in Fig. 6.
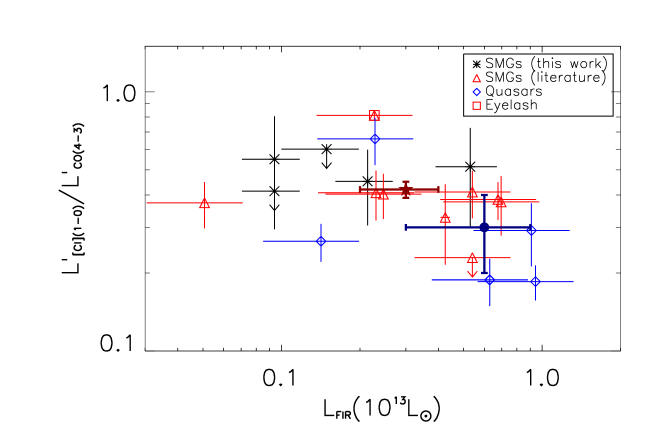
We also compare the median values of line luminosity ratios of the two sub-samples. The median ratio is 0.510.05 for the SMGs with new detections and 0.470.03 for the literature SMGs, again indicating consistency, and as shown in Fig. 7. There is, however, a marked difference in between the two samples; the SMGs with new [Ci] detections have a median ratio of whereas the literature sample has a median ratio of , as shown in Fig. 8, which provides initial evidence that the properties of the ISM in the SMGs varies, possibly suggesting that some of the SMGs with new detections have larger cool gas reservoirs for their far-infrared luminosity. This difference may be reduced with better constrained [Ci] measurements for those SMGs which currently only have upper limits. We combine these two sub-samples into one sample of 14 SMGs for the remainder of the paper.
We next compare the luminosity ratios of the SMGs to a sample of other high-redshift systems, comprised of bright quasars and radio-loud galaxies which have [Ci] detections in Walter et al. (2011). We do not include BRI1335-0417 from Walter et al. (2011) in the quasar sample since [Ci](1–0) is undetected and we have no direct observations of the low-J 12CO transitions. We measure a larger median in the SMGs of 0.510.04 compared to 0.30.1 in the quasar sample which can be seen in Fig. 8. We measure a median of and in the SMG sample and the quasar sample respectively which indicates a difference (of 2) between the two samples in terms of which is owing to the larger far-infrared luminosities measured in the quasar systems acting to reduce the value of this ratio. Applying a Kolmogorov-Smirnov test, we derive a 96 per cent probability that the SMGs and quasars were drawn from different populations in terms of and therefore we disagree with the findings of Walter et al. (2011) since they find no difference between the SMGs and QSOs in terms of .
Finally, we compare the luminosity ratios to local galaxies to test if the [Ci] properties differ at lower redshift in a variety of different ISM environments, using the above conversions to where necessary. We find a median of 0.200.08 for the SMG sample which is consistent with the value derived in a sample of irregular, interacting and merging, nearby galaxies (Gerin & Phillips 2000: =0.20.2) and also consistent with the ratio measured in the Milky Way (Fixsen et al. 1999: =0.150.1). We therefore find the ratio of [Ci] to 12CO(1–0) luminosity is similar in galaxies at low and high redshift, in agreement with Walter et al. (2011), which may lend further support to the idea that [Ci] is not completely constrained to the thin interface regions of PDRs.
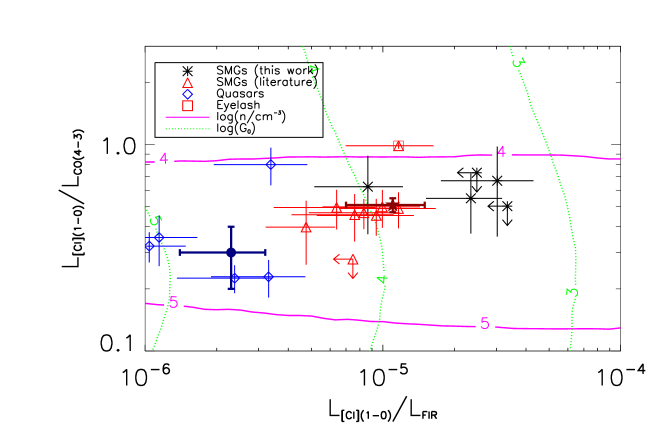
We note that Fig. 7 shows a decrease in with increasing far-infrared luminosity. This relationship can be explained assuming that the [Ci] provides a tracer of the bulk H2 gas mass and that traces the star-forming ISM, since in merger systems with higher , a larger fraction of H2 will be participating in the star-formation (traced by 12CO(4–3)) such that the ratio will be reduced. By comparison, systems with extended distributions of cooler reservoirs of H2 gas will have higher values of and lower . Furthermore, assuming that the [Ci] provides a tracer of the bulk H2 gas mass, Fig. 8 can be interpreted as revealing compact starbursts in the low and region since the 12CO(4–3) and trace the same gas as the [Ci]. The higher and region of the plot then represents systems with extended, cool gas distributions traced by the [Ci] line, but the 12CO(4–3) and trace mainly the actively star-forming gas.
4.3 PDR models
In order to explore the properties of the ISM within the SMGs we compare the line luminosity ratios to the outputs of molecular cloud models. The ISM of galaxies contains bound molecular clouds and cold neutral gas. Photodissociation regions (PDRs) are regions of the neutral gas where far-ultraviolet photons dominate the structure, heating and chemistry of the ISM (Hollenbach & Tielens, 1999). PDR models are an important tool to understand the effects of the far-ultraviolet radiation in all the regions containing atomic and molecular gas (Hollenbach & Tielens, 1999). The PDR models of Kaufman et al. (1999) assume a slab geometry for molecular clouds being illuminated from one side and probe the atomic gas density () and the far-ultraviolet radiation field as a function of the various line luminosity ratios. We note that there are a number of issues with using these simple one-dimensional PDR models, which we discuss further in Section 4.3.1, however deriving an estimate of the characteristic density and far-ultraviolet radiation field for the SMGs and the quasar sample provides a useful comparison between the samples even if the output derived values are not true representations of the densities and radiation fields. These average properties can be strongly affected by the different conditions of starburst versus quiescent environments therefore they provide a useful insight into the differences in these galaxies. Furthermore as more line observations are used to constrain these averages the prevailing conditions are further refined (Rangwala et al., 2011).
We use our line luminosity ratios together with the far-infrared luminosities to constrain properties of the systems by comparing the ratios to the values output from the Kaufman et al. (1999) models. We quote the UV radiation field in multiples of , the UV radiation field in the Milky Way in Habing units (1.610-3 erg s-1 cm-2). The models assume a given set of model parameters, including elemental abundances and also dust properties and then solve for the chemistry, thermal balance and radiative transfer in the PDR. A given PDR model has a constant density and radiation field therefore at each density and radiation field the various emitted line-luminosity ratios can be established.
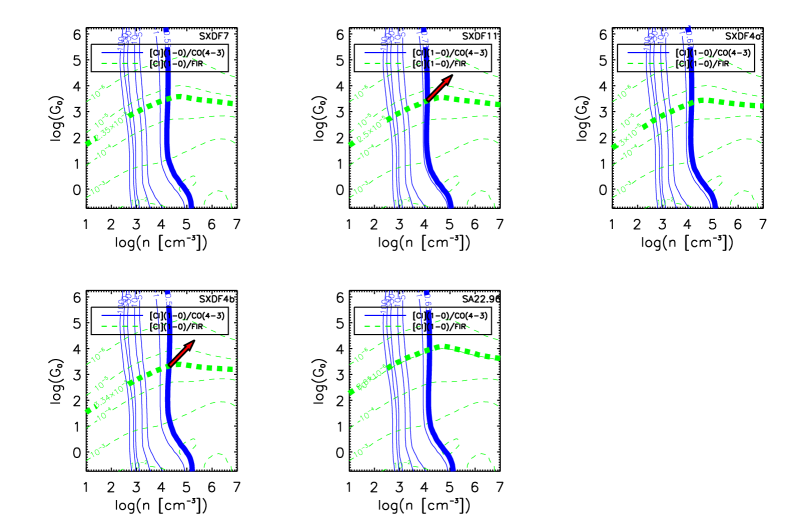
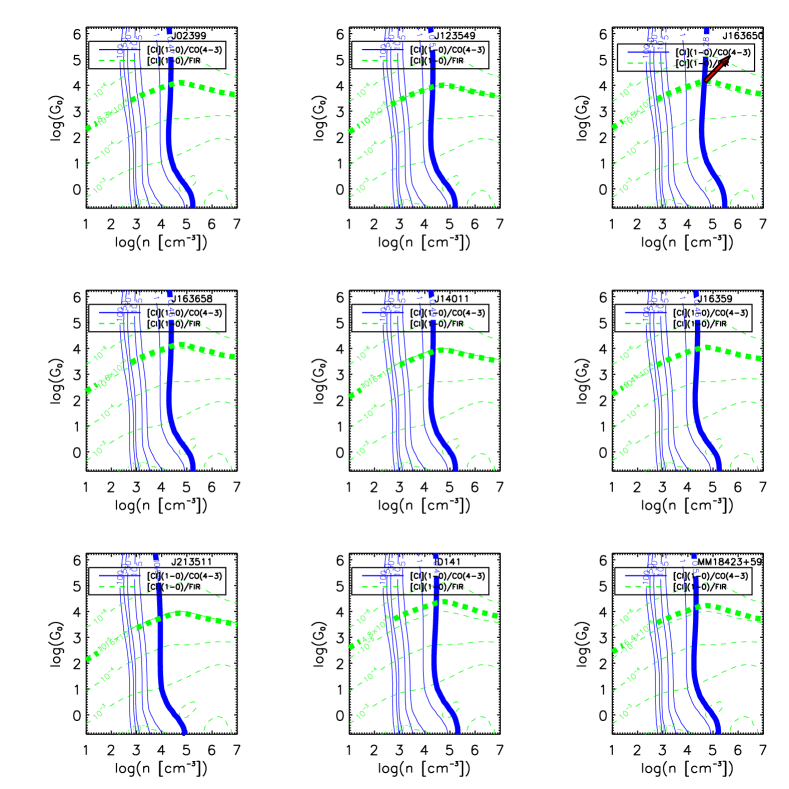
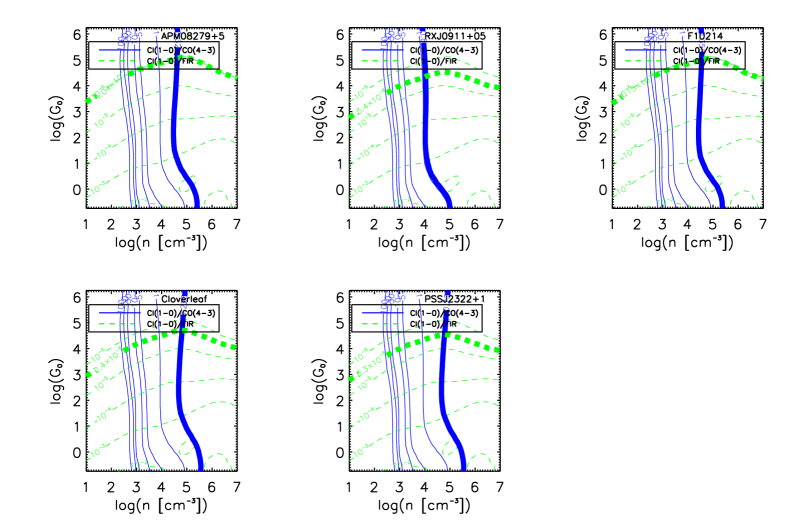
In Figs. 10 and 11 we show the PDR model output for our measured line ratios at different values of and taken from the models of Kaufman et al. (1999)222dustem.astro.umd.edu/pdrt/index.html. We created finer grids than provided by Kaufman et al. (1999), interpolating between the steps in and . Since the contours of and are orthogonal it is possible to define an unique value of and for each SMG by finding the intersection of the contours. The derived values are shown in Table 6.
| ID | log( (cm-3)) | log() |
|---|---|---|
| SXDF7 | 4.30.1 | 3.50.1 |
| SXDF11 | 4.1 | 3.4 |
| SXDF4a | 4.20.2 | 3.40.1 |
| SXDF4b | 4.3 | 3.3 |
| SA22.96 | 4.20.1 | 4.00.1 |
| J02399 | 4.370.09 | 4.10.2 |
| J123549 | 4.40.1 | 4.10.2 |
| J163650 | 4.7 | 4.1 |
| J163658 | 4.40.1 | 4.20.2 |
| J14011 | 4.40.1 | 4.00.2 |
| J16359 | 4.40.1 | 4.10.2 |
| J213511 | 4.10.3 | 3.60.7 |
| ID141 | 4.50.2 | 4.40.2 |
| MM18423+5938 | 4.40.1 | 4.30.2 |
In order to compare the and values of the SMGs to other high-redshift systems and also local systems we plot the distribution of and in Fig. 9. We first note that the radiation fields of the literature sample of SMGs are higher than the SMGs with new detections in this work. We measure a median density and radiation field of and respectively in the literature SMG sample compared to and for the SMGs with new detections in this work. Six of the nine literature SMGs are gravitationally lensed and it is possible that the densities and radiation fields may be over-estimated owing to differential magnification in these lensed systems. For instance, this may manifest if [Ci](1–0) probed a larger region of cold gas than the more centrally concentrated region probed by the far-infrared and 12CO(4–3) observations. Stronger, differential lensing of the far-infrared and 12CO(4–3) luminosities over [Ci] would result in higher derived density and radiation field values.
Our line profile analysis (Section 4.1) does not provide direct evidence for such a scenario for [Ci], but we do not spatially resolve the lines in this study, nor is our S/N sufficient to rule out line width differences in the 12CO and [Ci] lines. This scenario could clearly happen for the spatially extended 12CO(1–0) reservoirs found in Ivison et al. (2011). We also note that spatially resolved observations reaching the same H2 gas mass surface density sensitivities of both 12CO(1–0) and [Ci](1–0) are required to explore this further. We assume here that differential lensing does not have a large effect on our results, and combine all 14 SMGs into a single sample, finding a median density of and a median radiation field of . We note that the quoted dispersions of the density and radiation fields characterise the distribution of the population, but do not include the additional broadening from measurement errors. Including the average measured errors in the estimate of the SMGs’ distributions would reduce the error on log( (cm-3)) to 0.07 and log() to 0.3. We also note that using more than two line ratios will also increase the spread of the possible solutions as shown in Danielson et al. (2011) for the ‘Eyelash’ (J213511) for which numerous line ratios are used (from the 12CO ladder, [Ci], [Cii] ) giving model errors on log( (cm-3)) and log() of 0.3 and 0.7 respectively
In order to explore the differences in ISM conditions in a range of high-redshift systems we also constrain and for the quasar sample from Walter et al. (2011) as shown in Fig. 12, finding a median density of and radiation field of . We therefore derive higher radiation fields in the quasar sample than in the SMGs which may provide evidence that the quasar systems contain more compact starbursts (the ratios of and are lower, compared to the SMGs), as shown in Fig. 8 and Section 4.2. The locus of the quasar properties appears to be well within the local ULIRG regime, and the outlier, as shown in Fig. 9, may be representative of the star forming SMG host dominating over the AGN in this system, providing support for the interpretation of quasars as transition objects. The gas densities we measure in SMGs are also lower than found for a =6.42 quasar, (Maiolino et al., 2005), providing additional support for varied gas properties across the high-redshift systems.
In order to assess if the ISM properties in star forming galaxies have varied since the present day, we compare the SMGs to local systems in Fig. 9. Davies et al. (2003) studied local ULIRGs, finding density values between cm-3 and radiation fields of which overlaps with the values we derive for distant SMGs. However, we note that there is recent evidence that in some local ULIRGs the far-UV photons (and therefore the PDRs) are unable to power the ISM energetics, and therefore the high-J 12CO lines. The high densities and metal-rich environments in these systems stop the far-UV photons from travelling far, and only cosmic rays and/or turbulent heating can explain the large amounts of dense and warm gas observed in the local ULIRGs (Bradford et al., 2003; Papadopoulos et al., 2012). Recent Herschel observations have also shown that local ULIRGs can be powered by shocks and/or X-rays. Van der Werf et al. (2010) find that X-ray heating can power the high-J 12CO lines in Mrk231 and Hailey-Dunsheath et al. (2012) favour a X-ray heating model for NGC 1068 and conclude that far-UV heating is unlikely, whereas Meijerink et al. (2013) find that shocks are dominating the 12CO excitation in NGC 6240.
Furthermore, a sample of nearby, normal star forming galaxies is found to have and values in the ranges cm-3 and (Malhotra et al., 2001) which overlap in the far upper ranges with the values we find for SMGs. The mean density for the SMGs is also consistent with the range derived in Galactic OB regions however the mean radiation field for the SMGs is at the lower range of the values derived in Galactic OB regions (Stacey et al., 1991). Finally the density and radiation field values for the SMGs are consistent with nearby starburst galaxies (Stacey et al., 1991), although this belies the fact that half of the 14 SMG sample actually lie significantly above this range in .
Overall, we find the SMGs are most comparable to local ULIRGs in and , however a significant tail of 5 of the 14 SMGs are likely best compared to local starburst galaxies which exhibit lower densities and weaker radiation fields.
4.3.1 PDR model Issues
There are a number of issues associated with PDR modelling since a galaxy is much more complicated than a single PDR characterized by one set of parameters. Firstly, the PDR model uses micro turbulence (small velocity gradients) to estimate the line opacities. These PDR models often fail to model the 12CO ladder and [Ci] lines owing to the problems with the small velocity gradients not being altered in the PDR grids. Changing the velocity gradients, or indeed the assumed density profiles, in the PDR models will therefore act to alter the density and radiation field values derived. We note that not all PDR models use micro turbulence with some using a large velocity gradient escape probability formalism such as the work by Jansen et al. (1995).
The one dimensional PDR slab models produce a relatively thin layer of neutral atomic gas in between the transition from the C+ rich outer layer to the CO rich inner volume in the FUV-illuminated molecular cloud. This would imply that [Ci] cannot trace the bulk H2 mass which contrasts with extensive observational evidence that suggests that [Ci] is fully concomitant with the CO-bright H2 (Plume, 1995; Keene et al., 1996; Ojha et al., 2001; Ikeda et al., 2002). Indeed Keene et al. (1996) note that the simple plane-parallel PDR models of, for example, Tielens & Hollenbach (1985) do not predict the observed proportionality between [Ci] and other H2 tracers, or the extended distributions of [Ci]. This is further illustrated in the attempts to model the well-studied Barnard 68 dark globule by Pineda & Bensch (2007) where the relative [Ci], 12CO and 13CO cannot be reproduced simultaneously by the spherically symmetric Stoerzer et al. (1996) PDR model with differences between the observations and models of up to a factor of 2.
There has been a considerable effort to alter the simple models to explain these observations by using low-density PDRs and inhomogeneous PDRs (Hollenbach et al., 1991; Meixner & Tielens, 1993; Spaans, 1996). Stutzki et al. (1988) suggest that the surface layers of [Ci] are distributed across the clouds since the clouds are clumpy. Spaans (1996) presents a homogeneous model and a clumpy model with the same (average) density. The average abundances as a function of extinction are identified for both the models, finding that the homogeneous model indeed shows the layered structure, while the clumpy model shows approximately a constant average abundance for C+ and C. The C abundance is found to follow the average H2 abundance well, indicating that the global H2 can be traced with [Ci]. The Spaans (1996) PDR models is found to be successful at predicting the spatial correlation between [Ci] and other H2 mass tracers such as 12CO and 13CO. However, the tight relation observed between [Ci] and 13CO over a wide range of ISM conditions remains a problem unless the [Ci] distribution is mostly concomitant with the bulk CO-rich H2 gas (rather than being locked into the PDRs). The clumpy models allow the far-UV to penetrate deeper into the molecular clouds, however in these models the [Ci] distribution remains inconsistent with the widespread [Ci] emission observed deep in molecular clouds with little far-UV illumination (Keene et al., 1985; Tatematsu et al., 1999; Oka et al., 2001). The clumpy models also cannot achieve the high 12CO/13CO ratios observed in ULIRGs. Furthermore, Keene et al. (1985) present observations of [Ci] in two Galactic molecular clouds finding that the [Ci] is widely distributed in the clouds and not consistent with only appearing at the cloud edges, close to the ionisation fronts. Papadopoulos et al. (2004) further explore the non-PDR distribution of [Ci], highlighting observations such as [Ci] emission from UV-protected regions in the Galaxy and the similarities between the [Ci] and 13CO line profiles, from which they conclude that observations are best explained by [Ci] tracing the H2 gas mass rather than having a PDR-like distribution.
We note that there is significant scatter between different PDR models currently used, as discussed in Röllig et al. (2007). The models contain numerous uncertainties given the various unknown chemical processes which are still being determined and understood experimentally and theoretically. There is therefore an on-going effort to improve the models and converge on a common solution, and further observations are needed to help to guide this.
We conclude that in reality the ISM is likely a clumpy structure with lower and higher density regions which are all caught in the same beam in our observations and given the information available to us, namely the [Ci](1–0), 12CO(4–3) and far-infrared luminosities, we are unable to use more complicated models since that would introduce more parameters than we can constrain with only these line luminosities. Nevertheless, our estimation of the densities and radiation fields of the SMG and quasar samples, from comparison to the simple PDR models, provides us with a useful initial comparison and drives further studies into modelling the molecular clouds.

4.4 Gas masses
There is evidence that the mass derived from the [Ci] line luminosity can be used to estimate the H2 mass in local ULIRGS (Papadopoulos & Greve, 2004), Arp220 (Gerin & Phillips, 1998) and the Cloverleaf QSO (Weiß et al., 2003). Papadopoulos et al. (2004) note that the small optical depths of the [Ci] lines make them ideal tracers of H2 gas, along with the simple partition function structure and the apparent concomitance of [Ci] with the bulk H2 gas mass. In order to test this in high-redshift systems we first calculate the total mass of neutral carbon in the SMGs using:
| (2) |
(Weiß et al., 2005), which assumes the [Ci] line is optically thin and where (the [Ci] partition function). and are the energies above the ground state, 23.6 K and 62.5 K respectively and is the excitation temperature. Since we do not have information on the [Ci](2–1) line for the majority of the sources we cannot constrain the excitation temperature (Schneider et al., 2003) therefore we take 30 K, consistent with the average derived from Walter et al. (2011) mainly from quasars with both [Ci] line detections ( K), under the assumption that both lines are optically thin and have the same excitation temperature. For densities as high as 104 cm-3 [Ci] will be thermalised and therefore local thermodynamical equilibrium (LTE) can be assumed, justifying using the same for all levels of [Ci], such that = . We derive a median neutral carbon mass of 1.20.2 in the SMGs (Table 7).
We then compare these masses to the molecular gas masses derived from the 12CO luminosities. We use both the measured 12CO(1–0) fluxes (where available – Table 5) and the derived 12CO(1–0) luminosities and assume a conversion of such that as used by Bothwell et al. (2013), the use of which we discuss further in Section 5.1. We then measure a median molecular gas mass (from 12CO(1–0)) of in the SMGs.
With knowledge of these two masses we can estimate the neutral carbon abundance relative to H2 (Weiß et al., 2005) using:
| (3) |
We measure a median carbon abundance of which is comparable to the abundance quoted in Weiß et al. (2005) ( ) and derived by Danielson et al. (2011) of for the lensed SMG, J213511, however it is higher than the value found in the Galaxy of (Frerking et al., 1989).
To calculate the molecular gas mass using the [Ci] line we then assume =0.490.02, the median derived by Papadopoulos & Greve (2004) and use:
| (4) |
(Wagg et al., 2006; Papadopoulos & Greve, 2004). Here (Weiß et al., 2005) and (the Einstein A coefficient) and the cosmological dependence is encapsulated in Dl, the luminosity distance. We measure a median molecular gas mass from [Ci](1–0) of which is consistent with the measure from the 12CO(1–0) luminosity, indicating that the [Ci](1–0) line luminosity is a viable tracer of the H2 mass, regardless of our inconclusive findings from the line width comparisons in Section 4.2. We note, however, that a must still be assumed, which is also a weakness of using any optically thin tracer of H2 gas mass, such as 13CO lines. In this context the [Ci] lines with their simpler 3-level partition function, and simpler chemistry retain an advantage over the 13CO lines. On the other hand, using optically thick 12CO lines does not directly suffer from the corresponding 12CO/H2 abundance uncertainty, but from other, different, uncertainties that we discuss in Section 5.1. However in cases where direct measurements of 12CO(1–0) are not available or possible, the [Ci](1–0) luminosity appears to be a reasonable substitute to estimate the H2 gas mass.
We note that measuring [Ci](2–1), which is readily achievable with ALMA at these redshifts, will enable mapping of the gas properties while avoiding assumptions of the gas excitation temperature, determined from the ratio of [Ci](2–1) / [Ci](1–0). This is of particular importance for studying southern sources with ALMA where sensitive measurements at the observed frequencies of GHz for 12CO(1–0) are not achievable, but the [Ci] lines are accessible.
| ID | |||
|---|---|---|---|
| SXDF7 | 1.60.4 | 12030 | 7020 |
| SXDF11 | 1.2 | 90 | 398 |
| SXDF4a | 0.90.3 | 7020 | 3010 |
| SXDF4b | 1.0 | 70 | 5020 |
| SA22.96 | 1.50.5 | 11030 | 6020 |
| J02399 | 1.80.2 | 13020 | 8020 |
| J123549 | 1.80.3 | 13020 | 749 |
| J163650 | 1.3 | 90 | 9010 |
| J163658 | 1.70.4 | 12030 | 10020 |
| J14011 | 0.90.2 | 7010 | 243 |
| J16359 | 0.160.03 | 112 | 8.20.8 |
| J213511 | 0.870.03 | 613 | 17.10.9 |
| ID141 | 0.70.2 | 5020 | 395 |
| MM18423+5938 | 0.50.1 | 348 | 23.10.2 |
5 Discussion
5.1 Physical Interpretation
We next explore what the derived conditions in the ISM might imply for the SMG population. We first note that the density and radiation field values derived from the comparison to the PDR models may not represent the true values for these properties and that there are a number of issues with PDR modelling as described in Section 4.3.1. Furthermore, since we only use a single crossing (the intersection of two line ratios only) to constrain the densities and radiation fields we are not sampling the model distribution well, as shown by the spread of values derived by Danielson et al. (2011) using multiple line ratios. However, we use the single crossing to derive values in both the SMG and quasar sample, therefore performing a useful and consistent differential comparison between the two samples.
We find that the SMGs are clearly separate from the quasars in terms of radiation field but have similar densities. We also find that 5 of the 14 SMGs (mostly from our new observations in this work) extend the range of SMG radiation fields to much lower values, almost ten times lower than the majority of previous SMGs studied. This tail of SMGs’ are more consistent with starbursts or normal, local star-forming galaxies than with ULIRGs. Such a scenario is often quoted in the recent SMG literature from a variety of other arguments, namely the large sizes of SMGs (Chapman et al., 2004; Bothwell et al., 2010, e.g.,), or the suppressed PAH line ratios (Menéndez-Delmestre et al., 2009).
In order to bring these low- SMGs to the median of the literature SMG sample, the ratio of would need to be lowered by a factor . However the values are well constrained since we use a combination of 2 mm, 850 mm, Herschel-SPIRE and radio fluxes to constrain the SEDs (Alaghband-Zadeh et al., 2012), leaving less than a factor two in uncertainty. Therefore we suggest that the low radiation field values are more likely due to boosted [Ci] fluxes relative to the . Enhanced [Ci] is predicted by Papadopoulos et al. (2004) to occur in star forming environments since the processes which make [Ci] present throughout a typical giant molecular cloud act to enhance it further in a star forming or dynamically fast-evolving environment (for example, non-equilibrium chemical states and turbulent diffuse mixing). However, it is also possible that high densities (n104, which is the case for the SMGs) that prevail in the ISM of merger and starburst systems may also counteract this boosting and suppress the [Ci]/H2 abundance (Papadopoulos & Greve, 2004) therefore there are a number of uncertainties in this prediction since the balance between the two effects is not well constrained. The PDR models also assume a certain geometry and a homogeneous medium (Danielson et al., 2011) which may result in lower predicted [Ci] in the models compared to our observations.
We note that the large and values (Fig. 8), causing low G0 values in some SMGs, may be a result of a more extended, cool H2 gas distribution. This “non-star-forming gas” would be weaker in the far-infrared and 12CO(4–3) emission but strong in [Ci]. Furthermore, if only a small fraction of the [Ci] emission comes from PDRs (Section 4.3.1) then the PDR-only ratios of and in Fig. 8 should be lower since the non-PDR contribution to the [Ci] emission should be subtracted from the observed values. This would imply that the density and radiation field values should be higher still for the PDR-related gas.
In order to explore the extent of the star formation in the SMG sample we derive sizes of the star forming regions using the molecular gas masses inferred in Section 4.4 and the densities determined from the PDR analysis in Section 4.3. We first note that the densities derived from the PDR analysis may not represent the true densities owing the large evidence that [Ci] does not have a PDR-like distribution, as discussed in detail in Section 4.3.1. However since we are only considering the average densities of the whole galaxy systems to gain approximate size estimates we continue to use the PDR-derived densities. We use the H2 masses derived from the 12CO(1–0) luminosities, applying a correction factor of 1.36 to account for the total mass of Helium and Hydrogen to gain the total molecular gas mass (Tacconi et al., 2010). Using these corrected masses we determine a median diameter of the SMGs of 800100 pc assuming a geometry of a 500 pc thick disc (Lockman et al., 1986) (80080 pc assuming spherical geometry). These derived diameters are smaller than we expect for SMGs where there is numerous evidence that the star formation on average is extended on scales greater than 1 kpc. The extended star formation has been suggested through spectroscopy of PAH features, resolved radio continuum, and large resolved H distributions – Menéndez-Delmestre et al. 2009; Chapman et al. 2004; Alaghband-Zadeh et al. 2012. Furthermore, Bothwell et al. (2010) find extended 12CO structures in three SMGs, with a mean radius of 3.1 kpc. Indeed for a number of the SMGs in our sample the sizes have been derived from high resolution 12CO and H observations. We find that the sizes derived from the densities and masses in this work underestimate these sizes. Tacconi et al. (2008) measure diameters of 1.90.8 kpc and 21 kpc for J123549 and J163658 respectively whereas we derive diameters of 0.90.1 kpc and 1.00.2 kpc. In Alaghband-Zadeh et al. (2012) we derive H sizes for SXDF7, SXDF4a and SA22.96 finding diameters of 5.20.1 kpc, 5.80.1 kpc and 8.40.6 kpc respectively which are larger than the H2 mass derived diameters of 1.00.1 kpc, 0.70.1 kpc and 1.00.2 kpc.
However, the SMGs often comprise multiple star-forming components with clumps of star formation across the complicated systems. Clear examples are demonstrated by the H observations of SMGs in Alaghband-Zadeh et al. (2012), or the clumps in the lensed ‘Eyelash’ SMG (Swinbank et al., 2010). The derived sizes are therefore minimum sizes since the effects of mass clumping would be to make the derived sizes larger. For spherical geometry the radius of the region is defined as:
| (5) |
where is the density clumping factor, equal to the ratio of the mean gas density (n) to the clump gas density yielded from line ratio models for the average molecular cloud ensemble (). For the radii derived are therefore minimum values. Since the median 800100 pc size is a minimum, we find that the sizes are therefore likely consistent with being extended on kpc scales.
We also note that the derived H2 masses from the 12CO(1–0) luminosities assume a conversion factor from 12CO(1–0) luminosity to H2 mass of . It is possible that this value may be larger in some star forming galaxies. There is evidence for in a range of star forming galaxies (Tacconi et al., 2008; Daddi et al., 2010; Ivison et al., 2011; Hodge et al., 2012). Furthermore, there is evidence that can be as high as (near Galactic) in local ULIRGs from the work of Papadopoulos et al. (2012). We note that in this case (of ) the [Ci]/H2 abundance must be 6 times smaller in order for the gas masses derived to match the 12CO(1–0) derived gas masses. This may be achieved if the high average gas densities in the SMGs suppress the average [Ci]/H2 abundance (Papadopoulos & Greve, 2004) while the same high gas densities boost . Papadopoulos et al. (2012) suggest that well-sampled high-J 12CO lines in combination with heavy rotor molecules such as HCN are required to constrain the in ULIRGs where the turbulent gas, with a strong high-density component, will have a high which dominates in the system. There are further uncertainties in the values of in different environments as detailed by Bolatto et al. (2013) such as a dependence of on metallicity and large differences within galaxies from the centres to the outer disk regions.
Furthermore, the majority of SMGs are merger systems (Engel et al., 2010; Alaghband-Zadeh et al., 2012) and we note that torque induced by a merger event creates a more centralised, homogeneous molecular ISM, in which pressure plays a significant role in triggering a star forming event as opposed to in normal star formation which occurs in gravitationally bound molecular clouds (which exist as well defined separate structures in the ISM). It is therefore possible that in these merger systems the ISM could be approaching a high pressure, continuous medium, rather than the well separated giant molecular clouds found in a lower density starburst environment. In this case there is evidence that a different is required (Ivison et al., 2011). There are therefore many issues to consider when choosing the value of to use, with further modelling and observations required to constrain the value across a range of environments.
We find that by adopting a conversion factor in the middle of the ranges discussed above () the sizes we derive increase to 1 kpc which is already consistent with what we expect and provides further support for extended star formation occurring in SMGs.
5.2 12CO(4–3)/[CI](1–0) as an indicator of Mergers versus Disks
Finally, we explore whether the 12CO(4–3)/[Ci](1–0) ratio might act as a useful indicator of major mergers in SMGs. The extended star formation suggested by the large derived sizes in the SMGs (assuming a mid-range ) may provide further support for the hypothesis that SMGs are merger systems (Engel et al., 2010; Alaghband-Zadeh et al., 2012) since the star formation which occurs outside the central nuclei and across the systems may be the relics of the progenitor galaxies of the merger, suggesting that we are observing multiple components in the early stages of a merger. This implies that the ultra-luminous phase occurring in these systems may be triggered at the first stages of a merger, a possibility suggested in the hydrodynamical models of Narayanan et al. (2009), proving a valuable insight into the merger and star formation trigger processes. We note that this contrasts with observations of merger-induced local ULIRGs which are found to be compact (Sanders et al., 1988; Sakamoto et al., 2008) offering a difference between the ULIRG triggers at low and high redshift. We require high-resolution observations of the 12CO and [Ci] transitions to explore this further.
Papadopoulos & Geach (2012) probe the use of the 12CO(4–3) to [Ci](1–0) flux ratio as an indicator of the star formation mode in a system, suggesting whether a system is merger-driven or disk-like. They find that there is a difference of up to a factor of 10 between these two types of systems from a compilation of literature values of the ratio. They obtain for merger-driven starbursts in ULIRGs and in disk-dominated star forming systems. We measure a median of providing evidence that the SMGs are merger-driven systems as opposed to quiescent, disk-like systems.
6 Conclusions
New [Ci](1–0) and 12CO(4–3) observations of five SMGs are presented and combined with literature SMG [Ci] detections to probe the gas distribution and properties within these massive merging systems. We compare the measured line luminosity ratios of [Ci](1–0), various 12CO transitions and the far-infrared luminosity to the outputs of PDR models to constrain the physical conditions in the ISM of these systems, finding that the SMGs have densities and radiation field values that are consistent with local ULIRGs with 5 of the sample of 14 extending to lower densities and weaker radiation fields, more similar to the local starbursts, providing further support that star formation in SMGs can be extended. We find a sample of quasars have higher densities and radiation fields on average than the SMGs, consistent with the more extreme local ULIRGs, and reinforcing their interpretation as transition objects. Besides the standard interpretation of line ratios such as [Ci](1–0)/12CO(4–3) in terms of PDRs and the PDR-model link to the average far-UV fields we also consider a non-PDR origin of the [Ci] line emission, with much of it actually tracing the bulk H2 gas rather than the H2 gas only near star formation sites. We therefore explore the use of [Ci] as a tracer of the H2 gas finding that it provides a mass that is consistent with the H2 gas mass determined from the 12CO observations, providing an alternative measure of the H2 gas in high-redshift systems without 12CO observations. [Ci] therefore provides an H2 tracer which is of great use for high-redshift objects in which the low-J 12CO lines are redshifted to frequencies lower than the ALMA operating frequencies. Owing to the likely clumping in SMGs and the low value of the conversion between 12CO luminosity and H2 gas mass used, the SMG sizes we derive are minima. We find that the minimum sizes are likely consistent with the sizes derived from high-resolution 12CO and H observations, providing further support for extended star formation in SMGs. Finally, the uncertainties in the excitation temperature highlight the need for complementary [Ci](2–1) observations in these SMGs to enable [Ci] to be used as a reliable tracer of molecular gas in high-z galaxies and therefore to probe galaxy evolution out to the epoch of the peak of star formation in the Universe.
7 Acknowledgements
This paper is based on observations made at IRAM- PdBI under program number V040. SA-Z acknowledges the support from STFC. IRS acknowledges the support from the Leverhulme Trust and STFC.
References
- Alaghband-Zadeh et al. (2012) Alaghband-Zadeh S., et al., 2012, MNRAS, 424, 2232
- Ao et al. (2008) Ao Y., Weiß A., Downes D., Walter F., Henkel C., Menten K. M., 2008, A&A, 491, 747
- Barvainis et al. (1997) Barvainis R., Maloney P., Antonucci R., Alloin D., 1997, ApJ, 484, 695
- Biggs & Ivison (2008) Biggs A. D., Ivison R. J., 2008, MNRAS, 385, 893
- Bland & Tully (1988) Bland J., Tully B., 1988, Nature, 334, 43
- Bolatto et al. (2013) Bolatto A. D., Wolfire M., Leroy A. K., 2013, arXiv:1301.3498
- Bothwell et al. (2010) Bothwell M. S., et al., 2010, MNRAS, 405, 219
- Bothwell et al. (2013) —, 2013, MNRAS, 429, 3047
- Bradford et al. (2003) Bradford C. M., et al., 2003, ApJ, 586, 891
- Chapman et al. (2005) Chapman S. C., Blain A. W., Smail I., Ivison R. J., 2005, ApJ, 622, 772
- Chapman et al. (2004) Chapman S. C., Smail I., Windhorst R., Muxlow T., Ivison R. J., 2004, ApJ, 611, 732
- Coppin et al. (2006) Coppin K., et al., 2006, MNRAS, 372, 1621
- Cox et al. (2011) Cox P., et al., 2011, ApJ, 740, 63
- Daddi et al. (2010) Daddi E., et al., 2010, ApJ, 713, 686
- Danielson et al. (2011) Danielson A. L. R., et al., 2011, MNRAS, 410, 1687
- Davies et al. (2003) Davies R. I., Sternberg A., Lehnert M., Tacconi-Garman L. E., 2003, ApJ, 597, 907
- Downes & Solomon (2003) Downes D., Solomon P. M., 2003, ApJ, 582, 37
- Engel et al. (2010) Engel H., et al., 2010, ApJ, 724, 233
- Fixsen et al. (1999) Fixsen D. J., Bennett C. L., Mather J. C., 1999, ApJ, 526, 207
- Frerking et al. (1989) Frerking M. A., Keene J., Blake G. A., Phillips T. G., 1989, ApJ, 344, 311
- Genzel et al. (2003) Genzel R., et al., 2003, ApJL, 584, 633
- Gerin & Phillips (1998) Gerin M., Phillips T. G., 1998, ApJL, 509, L17
- Gerin & Phillips (2000) —, 2000, ApJ, 537, 644
- Gerin et al. (2002) Gerin M., Phillips T. G., Contursi A., 2002, in EAS Publications Series, Vol. 4, EAS Publications Series, Giard M., Bernard J. P., Klotz A., Ristorcelli I., eds., pp. 193–193
- Greve et al. (2005) Greve T. R., et al., 2005, MNRAS, 359, 1165
- Hailey-Dunsheath et al. (2012) Hailey-Dunsheath S., et al., 2012, ApJ, 755, 57
- Hainline et al. (2009) Hainline L. J., Blain A. W., Smail I., Frayer D. T., Chapman S. C., Ivison R. J., Alexander D. M., 2009, ApJ, 699, 1610
- Hodge et al. (2012) Hodge J. A., et al., 2012, ApJ, 760, 11
- Hollenbach et al. (1991) Hollenbach D. J., Takahashi T., Tielens A. G. G. M., 1991, ApJ, 377, 192
- Hollenbach & Tielens (1999) Hollenbach D. J., Tielens A. G. G. M., 1999, Reviews of Modern Physics, 71, 173
- Ikeda et al. (2002) Ikeda M., Oka T., Tatematsu K., Sekimoto Y., Yamamoto S., 2002, ApJS, 139, 467
- Israel & Baas (2002) Israel F. P., Baas F., 2002, A&A, 383, 82
- Ivison et al. (2010) Ivison R. J., et al., 2010, A&A, 518, L35
- Ivison et al. (2011) —, 2011, MNRAS, 412, 1913
- Jansen et al. (1995) Jansen D. J., van Dishoeck E. F., Black J. H., Spaans M., Sosin C., 1995, A&A, 302, 223
- Kaufman et al. (1999) Kaufman M. J., Wolfire M. G., Hollenbach D. J., Luhman M. L., 1999, ApJ, 527, 795
- Keene et al. (1985) Keene J., Blake G. A., Phillips T. G., Huggins P. J., Beichman C. A., 1985, ApJ, 299, 967
- Keene et al. (1996) Keene J., Lis D. C., Phillips T. G., Schilke P., 1996, in IAU Symposium, Vol. 178, Molecules in Astrophysics: Probes & Processes, van Dishoeck E. F., ed., p. 129
- Lestrade et al. (2010) Lestrade J.-F., Combes F., Salomé P., Omont A., Bertoldi F., André P., Schneider N., 2010, A&A, 522, L4
- Lockman et al. (1986) Lockman F. J., Hobbs L. M., Shull J. M., 1986, ApJ, 301, 380
- Magnelli et al. (2012) Magnelli B., et al., 2012, A&A, 539, A155
- Maiolino et al. (2005) Maiolino R., et al., 2005, A&A, 440, L51
- Malhotra et al. (2001) Malhotra S., et al., 2001, ApJ, 561, 766
- Meijerink et al. (2013) Meijerink R., et al., 2013, ApJL, 762, L16
- Meixner & Tielens (1993) Meixner M., Tielens A. G. G. M., 1993, ApJ, 405, 216
- Menéndez-Delmestre et al. (2009) Menéndez-Delmestre K., et al., 2009, ApJ, 699, 667
- Narayanan et al. (2009) Narayanan D., Cox T. J., Hayward C. C., Younger J. D., Hernquist L., 2009, MNRAS, 400, 1919
- Ojha et al. (2001) Ojha R., et al., 2001, ApJ, 548, 253
- Oka et al. (2001) Oka T., et al., 2001, ApJ, 558, 176
- Papadopoulos & Geach (2012) Papadopoulos P. P., Geach J. E., 2012, ApJ, 757, 157
- Papadopoulos & Greve (2004) Papadopoulos P. P., Greve T. R., 2004, ApJL, 615, L29
- Papadopoulos et al. (2004) Papadopoulos P. P., Thi W.-F., Viti S., 2004, MNRAS, 351, 147
- Papadopoulos et al. (2012) Papadopoulos P. P., van der Werf P. P., Xilouris E. M., Isaak K. G., Gao Y., Mühle S., 2012, MNRAS, 426, 2601
- Pety et al. (2004) Pety J., Beelen A., Cox P., Downes D., Omont A., Bertoldi F., Carilli C. L., 2004, A&A, 428, L21
- Phillips & Huggins (1981) Phillips T. G., Huggins P. J., 1981, ApJ, 251, 533
- Pineda & Bensch (2007) Pineda J. L., Bensch F., 2007, A&A, 470, 615
- Plume (1995) Plume R., 1995, PhD thesis, THE UNIVERSITY OF TEXAS AT AUSTIN.
- Rangwala et al. (2011) Rangwala N., et al., 2011, ApJ, 743, 94
- Riechers et al. (2009) Riechers D. A., et al., 2009, ApJ, 703, 1338
- Röllig et al. (2007) Röllig M., et al., 2007, A&A, 467, 187
- Sakamoto et al. (2008) Sakamoto K., et al., 2008, ApJ, 684, 957
- Sanders & Mirabel (1996) Sanders D. B., Mirabel I. F., 1996, ARA&A, 34, 749
- Sanders et al. (1988) Sanders D. B., et al., 1988, ApJ, 325, 74
- Schneider et al. (2003) Schneider N., Simon R., Kramer C., Kraemer K., Stutzki J., Mookerjea B., 2003, A&A, 406, 915
- Sharon et al. (2013) Sharon C. E., Baker A. J., Harris A. I., Thomson A. P., 2013, ApJ, 765, 6
- Smail et al. (2005) Smail I., Smith G. P., Ivison R. J., 2005, ApJ, 631, 121
- Solomon & Vanden Bout (2005) Solomon P. M., Vanden Bout P. A., 2005, ARA&A, 43, 677
- Spaans (1996) Spaans M., 1996, A&A, 307, 271
- Stacey et al. (1991) Stacey G. J., Geis N., Genzel R., Lugten J. B., Poglitsch A., Sternberg A., Townes C. H., 1991, ApJ, 373, 423
- Stoerzer et al. (1996) Stoerzer H., Stutzki J., Sternberg A., 1996, A&A, 310, 592
- Stutzki et al. (1988) Stutzki J., et al., 1988, ApJ, 332, 379
- Swinbank et al. (2010) Swinbank A. M., et al., 2010, Nature, 464, 733
- Tacconi et al. (2008) Tacconi L. J., et al., 2008, ApJ, 680, 246
- Tacconi et al. (2010) —, 2010, Nature, 463, 781
- Takata et al. (2006) Takata T., Sekiguchi K., Smail I., Chapman S. C., Geach J. E., Swinbank A. M., Blain A., Ivison R. J., 2006, ApJ, 651, 713
- Tatematsu et al. (1999) Tatematsu K., Jaffe D. T., Plume R., Evans II N. J., Keene J., 1999, ApJ, 526, 295
- Thomson et al. (2012) Thomson A. P., et al., 2012, MNRAS, 425, 2203
- Tielens & Hollenbach (1985) Tielens A. G. G. M., Hollenbach D., 1985, ApJ, 291, 722
- Van der Werf et al. (2010) Van der Werf P. P., et al., 2010, A&A, 518, L42
- Wagg et al. (2006) Wagg J., Wilner D. J., Neri R., Downes D., Wiklind T., 2006, ApJ, 651, 46
- Walter et al. (2011) Walter F., Weiß A., Downes D., Decarli R., Henkel C., 2011, ApJ, 730, 18
- Wardlow et al. (2011) Wardlow J. L., et al., 2011, MNRAS, 415, 1479
- Weiß et al. (2005) Weiß A., Downes D., Henkel C., Walter F., 2005, A&A, 429, L25
- Weiß et al. (2003) Weiß A., Henkel C., Downes D., Walter F., 2003, A&A, 409, L41
Appendix A Supporting Figures - Constraining densities and radiation fields with molecular cloud models