Large resistivity change and phase transition in LiMnAs
Abstract
Antiferromagnetic semiconductors are new alternative materials for spintronic applications and spin valves. In this work, we report a detailed investigation of two antiferromagnetic semiconductors MnAs ( = Li, LaO), which are isostructural to the well known LiFeAs and LaOFeAs superconductors. Here we present a comparison between the structural, magnetic, and electronic properties of LiMnAs, LaOMnAs and related materials. Interestingly, both LiMnAs and LaOMnAs show a variation in resistivity with more than five orders of magnitude, making them particularly suitable for use in future electronic devices. Neutron and X-ray diffraction measurements on LiMnAs show a magnetic phase transition corresponding to the Neél temperature of 373.8 K, and a structural transition from the tetragonal to the cubic phase at 768 K. These experimental results are supported by density functional theory (DFT) calculations.
pacs:
75.50.Pp, 61.05.fm, 61.05.C, 61.10.Ht, 72.15.Eb, 71.20.-bI Introduction
The idea of using semiconductors in spintronic devices has stimulated a new field
of research.
This is because by using not only the charge of the electron, but also its spin to
store and manipulate information has led to a new paradigm in condensed matter
research to overcome the limitations set by Moore’s law.Žutić et al. (2004)
Unfortunately, semiconductivity and ferromagnetism above room
temperature are not compatible.
Presently, to circumvent this issue, diluted magnetic semiconductors
such as GaMnAsDietl et al. (2000); Jungwirth et al. (2006) and LiZnMnAsDeng et al. (2011); Mašek et al. (2007) are used.
Recently, the use of antiferromagnetic (AFM) semiconductors has been proposed,
because they have a higher magnetic ordering temperature compared to diluted
magnetic semiconductors.
One promising candidate material for new spintronic applications is LiMnAs,
given its suitable band gap and high magnetic moment per Mn atom.Jungwirth et al. (2011)
It was demonstrated that epitaxially grown LiMnAs thin films also show
semiconducting behavior,Jungwirth et al. (2011) and their AFM ordering has been
confirmedJungwirth et al. (2011); Novak et al. (2011); Wijnheijmer et al. (2012) as well.
Thus, LiMnAs, LaOMnAs, and related materials allow for the study and development of new
AFM semiconductors, and the compounds are also interesting from a purely academic
viewpoint.
CuMnAsMáca et al. (2012) has also been suggested as an alternative semiconducting AFM
material; however, this compound shows semimetallic behavior in contrast to the
desired semiconducting properties.
Still, the compounds with the general formula Mn, where = Li, Ni, Cu,
or LaO and = As or Sb offer a good starting point for the development of novel
semiconducting magnetic materials for applications in devices such as single-electron
transistors.Wunderlich et al. (2006)
In the ground state, both LiMnAs and LaOMnAs show AFM insulating behavior.
Chemically, LiMnAs consists of ionic Li+ and tetrahedral [MnAs]-
layers (see Fig. 1), with Mn2+ in a and As3-
in a nominal closed shell configuration.
LiMnAs is isostructural to LiFeAs superconductor.Tapp et al. (2008)
Structurally, LaOMnAs is closely related to LiMnAs (see Figure 1)
and to the LaOFeAs layered superconductor.
In comparison to LiMnAs, where the Mn moments are ordered antiferromagnetically
both in the Mn planes and between the Mn planes stacked along the
axis,Bronger et al. (1986) in the case of LaOMnAs, the moments are aligned
antiferromagnetically in the plane but ferromagnetically along
.Emery et al. (2010)
Interestingly, in contrast to the expected of the
Mn2+ ion, neutron scattering data on LiMnAs
and LaOMnAs suggests a magnetic moment of approximately 3.4 to 3.8 ,
which is close to the magnetic moment of 4 for an Mn3+ ion.
This closely resembles the simple rules and general observation made
regarding Heusler compounds Graf et al. (2011), stating that Mn tends
to have a large localized magnetic moment with an oxidation state of 3
(in the literature referred to as the Kübler’s ruleKübler et al. (1983))
in a nominal configuration.
The magnetism then stems from the non-bonding
electrons, as can be best observed in Half-Heusler compounds, where only
Mn or rare-earth-containing compounds form stable magnetic
phases.Kandpal et al. (2006); Felser et al. (2007)
The aim of this work is multifold: we elaborate on the synthesis and bulk
characterization of polycrystalline LiMnAs and LaOMnAs,
and compare their properties to other related compounds based on a short
review from the literature on the Mn family.
We show that LiMnAs can undergo a first-order phase transition from the
tetragonal to a cubic phase.
In addition, we discuss the electronic and magnetic properties of
LiMnAs and LaOMnAs, including their transport properties.
By combining ab-initio density functional theory (DFT) calculations
with our experiments, we discuss the electronic structure
and magnetic exchange coupling of the Mn atoms, further commenting on the
non-Curie-Weiss-like behavior experimentally reported for related
compounds.Schucht et al. (1999)
We also address an open question arising from a previous
work Emery et al. (2010), regarding the weak ferromagnetic behavior
observed in LaOMnAs, which so far has been attributed to a small spin
canting.
However, thus far, it was not taken into consideration that the formation of
small amounts of MnAs as impurities during synthesis (1%)
cannot be excluded completely, and this could explain the weak
ferromagnetic behavior.
II Results and discussion
In Ref. Müller et al., 1991 it was already noted, that in the Mn series, where is an alkali metal, and is an element from the 15th group of the periodic table, there is a correlation between the local moments of Mn and the Mn–Mn distances (). That is, a shorter results in lower moment of Mn. The distance plays a major role in the magnetism of these compounds, whose behavior is transferable to LiMnAs Bronger et al. (1986), LaOMnAs, and other materials. The structural and magnetic data for the MnAs series derived from neutron diffraction measurements is collected from the literature in Table 1.
| Compound | [K] | [Å] | [Å] | [Å] | [] |
|---|---|---|---|---|---|
| LiMnAs∗ | 10 | 4.262(1) | 12.338(1) | 3.008(3) | 3.67(3) |
| NaMnAs Bronger et al. (1986) | 14 | 4.199(1) | 14.164(1) | 2.969(1) | 4.01(5) |
| KMnAs Bronger et al. (1986) | 14 | 4.382(1) | 15.558(1) | 3.099(1) | 4.03(5) |
| RbMnAs Schucht et al. (1999) | 10.6 | 4.400(5) | 16.128(5) | 3.111(1) | 4.05(4) |
| CsMnAs Müller et al. (1991) | 10 | 4.417(1) | 17.370(1) | 3.123(1) | 4.07(2) |
*results from this work
Before turning to the presentation of our results, in Table 2 first we provide a general overview of the most important characteristics and material properties of various compounds for the aforementioned Mn class, with = Li, LaO. Table 2 serves as a set of reference values, providing a solid basis of comparison with our measured data for LiMnAs and LaOMnAs, using which we can derive more general conclusions that are applicable to the entire family. As the data in Table 2 show, the materials in the Mn family can be classified into two main categories: those that are semiconducting or semi-metallic with AFM ordering, and those which are metallic or half-metallic and ferromagnetic (FM).
| Compound | Electronic | Magnetic | Mn magnetic | [Å] | Space | Literature |
|---|---|---|---|---|---|---|
| structure | order | moment [] | group | |||
| LiMnAs | semiconductor | AFM | 3.8 | 3.008 | this work and Ref. Bronger et al.,1986 | |
| (tetragonal) | ||||||
| CuMnAs | semimetal | AFM | no data | 3.452 | Ref. Máca et al.,2012 | |
| (orthorh.) | ||||||
| CuMnSb | semimetal | AFM | 3.9 | 4.301 | Refs. Máca et al.,2012; Otto et al.,1987 | |
| (cubic) | ||||||
| LaOMnAs | semiconductor | AFM | 3.34 | 2.914 | Refs. Emery et al.,2010, 2011 | |
| (tetragonal) | ||||||
| NiMnAs | half metallic- | FM | 4.0 | 4.051 | Ref. Dinh et al.,2008 | |
| ferromagnet | (cubic) | |||||
| NiMnSb | half metallic- | FM | 4.0 | 4.186 | Refs. Van Engelen et al.,1994; Otto et al.,1987 | |
| ferromagnet | (cubic) | |||||
| MnAs | metallic | FM | 3.4 | 3.730 | Refs. Ishikawa et al.,2006a; Haneda et al.,1977 | |
| (hexagonal) |
There is a correlation between distances, and the magnetic and electronic properties of these materials. In other words, those compounds that have Å tend to be AFM semiconductors. In the range of Å they are semimetallic and AFM (except CuMnSb which has of 4.301 ), and those with are metallic and FM. As a general trend, this indicates that the further apart the Mn atoms are from each other, the more likely it is that they develop high moments, leading to a FM metal. Hence, by adjusting the lattice parameters, the magnetic and electronic properties of the Mn compounds can be tuned over a wide range. Indeed, as an example, for LaOMnP (isostructural to LaOFeAs), it was shown very recently that upon doping and external pressure, the system can undergo a phase transition from an AFM insulator to a metallic antiferromagnet.Simonson et al. (2012)
II.1 Synthesis
LiMnAs was synthesized and characterized as bulk material in the
1980s Bronger et al. (1986); Achenbach and Schuster (1981) by a high-temperature reaction of the
elements lithium, manganese, and arsenic.
It was found that this compound is AFM-ordered, where the Néel
temperature is approximately 400 K, but the exact Néel
temperature is not known.
Using a similar synthesis route, our preliminary experiments revealed a number
of small Bragg reflections in powder X-ray diffraction (XRD) patterns of
the target compound caused by impurities.
These Bragg peaks become significantly stronger with increasing temperature and reaction
time and stem from an attack of the tantalum ampoule by arsenic.
Therefore, LiMnAs was prepared as follows: mixtures of stoichiometric amounts
of Li (foil), Mn (chips) and As (pieces) (all 99.999% purity)
were placed in Al2O3 crucibles.
The total mass was approximately 2 g per sample.
Each crucible was enclosed in an arc-sealed tantalum ampoule at 300 mbar Ar,
which in turn was jacketed by an evacuated fused silica ampoule.
A grey powder was obtained after heating the mixtures to 1423 K with
a low heating rate of 1 K/min in a muffle furnace.
This temperature was maintained for 2 h and then reduced
to 1173 K. After 24 h, the ampoules were quenched in water.
All of the handling was performed in a glove-box under Ar
((O2,H2O) ppm).
LaOMnAs was synthesized from the starting materials LaAs, Mn, and MnO2
in stoichiometric amounts at 1423 K for 42 h in an Al2O3 crucible,
which was in turn enclosed in an evacuated and fused silica tube.
II.2 Crystal and magnetic structure
Powder X-ray diffraction (XRD) of the final product showed single-phase LiMnAs.
The powder diffraction experiment was performed with Cu K
radiation( = 1.5406 Å) in Debye-Scherrer geometry.
The sample was sealed in a glass capillary with a 0.3 mm diameter.
A representative XRD pattern obtained at 293 K
is shown in Figure 2 with a Rietveld refinement carried
out using Jana 2006 Petricek et al. (2006). LiMnAs has a tetragonal unit cell with
Å and Å
(, , Li on , Mn on ,
As on and (As) = 0.7575(2)) in agreement with the older reports.
Chemical analyses for non-metal impurities were carried out using the carrier
gas hot extraction or the combustion technique (TCH 600, C 200 (LECO®)).
For all samples, the impurities were below the limit of detection (LOD in ppm):
H(100), N(200), O(1000) and C(1500) based on 20 mg initial weight.
The 1:1:1 target composition was checked by Inductively-Coupled-Plasma-Optical Emission Spectrometry
(ICP-OES; Vista RL, Varian) resulting in Li:Mn:As = 1.03(1):0.98(1):0.99(1).
A specimen for metallographic examination was prepared from one sample.
Because of moisture and air sensitivity, this was carried out in a glove-box using
paraffin oil as lubricant. A bright field image of the microstructure is
shown in Figure 3b, which reveals a domain structure.
This is a typical signature for a tetragonal phase formed from a
high-temperature cubic phase.
Specific heat measurements of LiMnAs in the temperature range of
240–780 K revealed only one DSC peak (see Figure 3a)
corresponding to a reversible phase transition with onset temperature
K.
To identify the nature of this phase transition, temperature-dependent
powder XRD was performed with a Stoe STADI II diffractometer with Mo K radiation.
The powder (20–50 m) was sealed in a 0.5 mm quartz glass capillary.
The measurements were carried out in the range from 323 K to 873 K in steps of 50 K.
The observed powder patterns are shown in the range of
in Figure 4. All powder patterns up to 723 K can be indexed
based on a tetragonal unit cell, whereas the powder patterns at 823 K and 873 K
are indexed based on a cubic unit cell with .
The high-temperature phase, HT-LiMnAs, crystallizes in MgAgAs structure
type (, , Li on , Mn on and As on ) according to the Rietveld analysis.
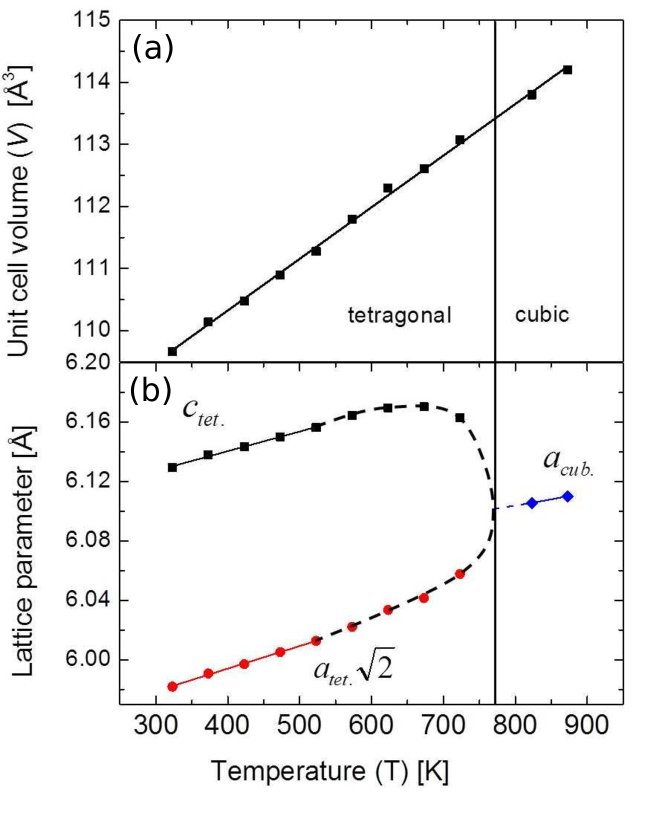
The temperature dependence of the lattice parameters , and as well as the unit cell volume in a
pseudo-cubic setting are plotted versus the temperature in Figure 5.
Both parameters and increase nearly linearly with
Å/K and
Å/K up to 600 K.
Above 650 K, increases and decreases until they match at 768 K, where Å.
The volume increases linearly with the temperature expansion coefficient
of Å3/K.
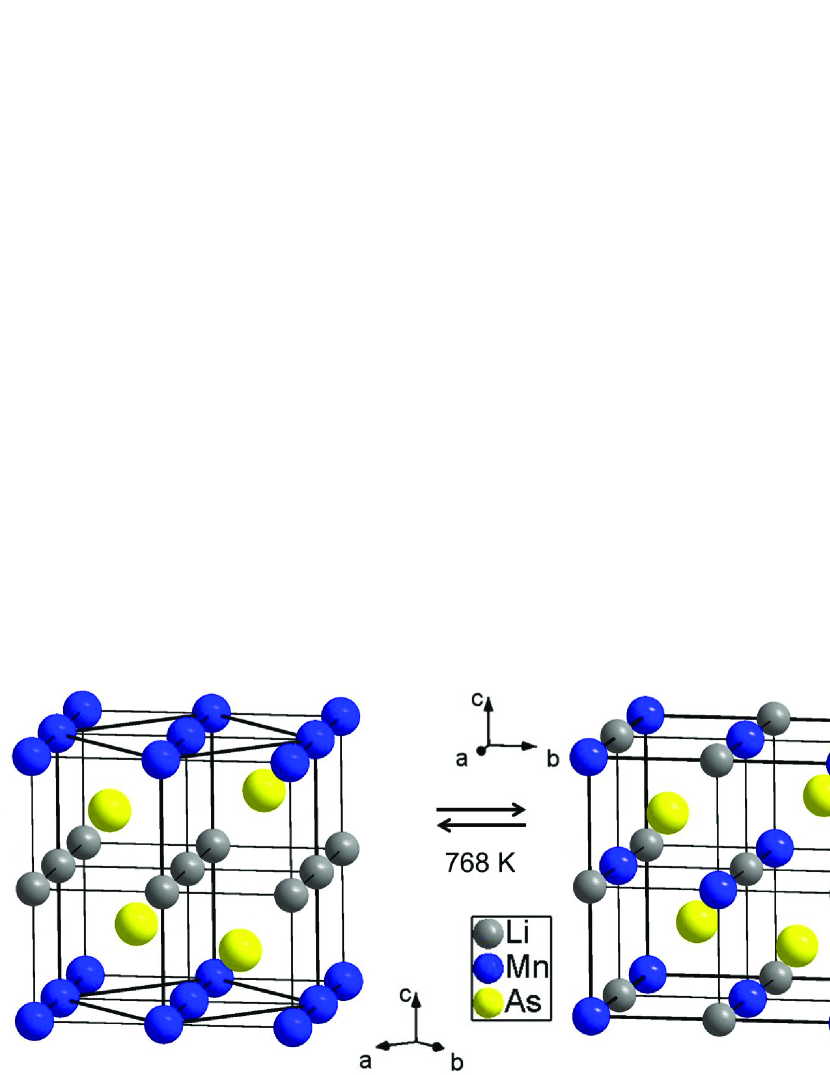
The structural relationship between tetragonal LiMnAs and the high-temperature cubic form
is shown in Figure 6 with the tetragonal structure given in the pseudo-cubic setting.
The crystal structure at room temperature form can be described as an alternate stacking of slabs
composed of edge connected slightly distorted MnAs4 and LiAs4 tetrahedra.
The MnAs4 tetrahedra are slightly smaller than the LiAs4 tetrahedra.
At higher temperatures the ratio in pseudo-cubic setting
approaches one. At 768 K, all tetrahedra become regular and half of the
Li and Mn atoms of each layer exchange positions with each other in such a way
that a Half-Heusler structure is obtained.
The diffusion of the Li atoms to the Mn sites and vice versa likely occurs
via the empty Li4As4 cubes, showing that Li is rather mobile in LiMnAs.
There is no perceptible discontinuity in the volume curve at the temperature
of the phase transition, and transits smoothly to one.
Although this fulfills the requirements for a second-order phase transition,
the fast exchange of Li and Mn cannot be described by a continuous process.
This can therefore be only a first-order phase transition.
The measured change in the entropy and the enthalpy at the phase transition
temperature is J/(Kmol) ( meV/f.u.)
and J/(Kmol).
For the magnetic characterization of LiMnAs, neutron powder diffraction patterns were recorded on the E6 Focusing Powder Diffractometer at Helmholtz-Zentrum Berlin, Germany, using the wavelength Å. The measurements were performed at seven different temperatures in the range from 1.6 K to 873 K. Five diffraction patterns in the range of 1.6 K to 300 K correspond to tetragonal and antiferromagnetically ordered LiMnAs. To protect the sample against moisture and oxidation, a 10 mm fused silica tube was filled and sealed under vacuum. A representative neutron powder diffraction pattern obtained at 1.6 K is shown in Figure 7 along with the fit from the Rietveld refinement using the nuclear and magnetic structures.
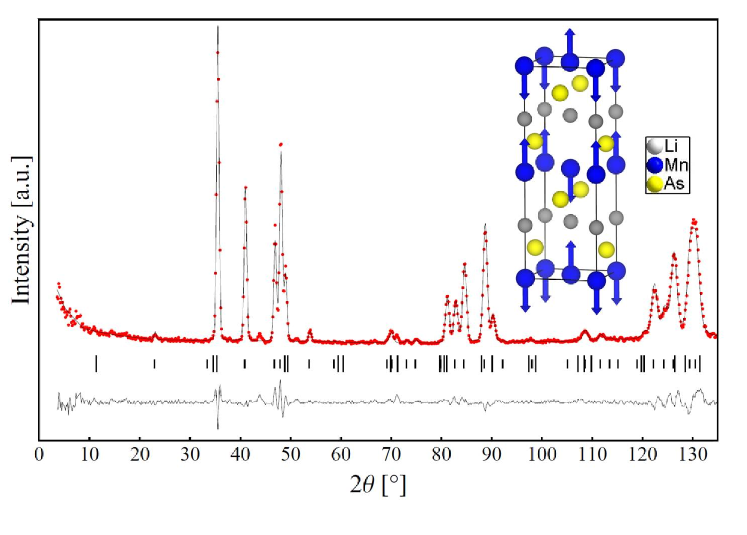
Table 3 lists crystallographic data obtained from the Rietveld refinements of the crystal structures based on neutron powder patterns at various temperatures. The powder patterns below the ordering temperature reveal Bragg peaks of magnetic order that can be indexed with the modulation vector . This corresponds to an antiferromagnetically ordered structure doubling the c-axis of the nuclear structure. The refinement in the magnetic space group (Belov notation) reveals that the magnetic moments at the Mn sites with at 1.6 K are aligned parallel to the axis. These observations are in good agreement with the previously reported data, except that the magnetic space group was wrongly assigned in Ref. Bronger et al., 1986. The low temperature magnetic moment of is smaller than the value of expected for the high-spin () state of Mn2+, assuming a -factor of 2 ().
| [K] | [Å] | [Å] | V[Å3] | [] | |
|---|---|---|---|---|---|
| 1.6 | 4.262(1) | 12.338(1) | 224.12 | 0.3787(5) | 3.72(3) |
| 10 | 4.262(1) | 12.338(1) | 224.12 | 0.3795(5) | 3.68(3) |
| 13 Bronger et al. (1986) | 4.253(1) | 12.310(1) | 222.66 | 0.3800(1) | 3.75(3) |
| 30 | 4.262(1) | 12.338(1) | 224.12 | 0.3796(5) | 3.70(3) |
| 50 | 4.261(5) | 12.337(9) | 224.00 | 0.3789(1) | 3.61(3) |
| 293 Bronger et al. (1986) | 4.267(1) | 12.356(1) | 224.97 | 0.3800(1) | 2.59(2) |
| 300 | 4.259(2) | 12.333(4) | 223.70 | 0.3813(1) | 2.63(3) |
| 317 | 4.269(2) | 12.363(4) | 225.20 | 0.3792(1) | 2.40(3) |
| 322 | 4.269(2) | 12.366(4) | 225.40 | 0.3796(1) | 2.41(3) |
| 332 | 4.270(2) | 12.372(4) | 225.60 | 0.3778(1) | 2.25(3) |
| 348 | 4.272(2) | 12.374(4) | 225.80 | 0.3771(1) | 2.05(3) |
| 352 | 4.273(2) | 12.373(4) | 225.80 | 0.3800(1) | 1.90(3) |
| 357 | 4.274(2) | 12.377(4) | 226.00 | 0.3783(1) | 1.74(3) |
| 362 | 4.273(2) | 12.380(4) | 226.00 | 0.3799(1) | 1.61(3) |
| 366 | 4.276(2) | 12.380(3) | 226.40 | 0.3802(4) | 1.49(3) |
| 370 | 4.275(3) | 12.383(3) | 226.20 | 0.3783(4) | 1.15(3) |
| 373 | 4.275(2) | 12.382(3) | 226.20 | 0.3814(3) | 0.91(3) |
| 393* Bronger et al. (1986) | 4.273(1) | 12.370(1) | 225.86 | 0.3800(1) | 1.59(3) |
| 423 Bronger et al. (1986) | 4.279(1) | 6.193(1) | 113.39 | 0.7610(2) | - |
| 573 | 4.289(5) | 6.203(0) | 114.11 | 0.7582(1) | - |
| 873 | 6.155(4) | - | 233.18 | - |
*magnetic moment not compatible with our data
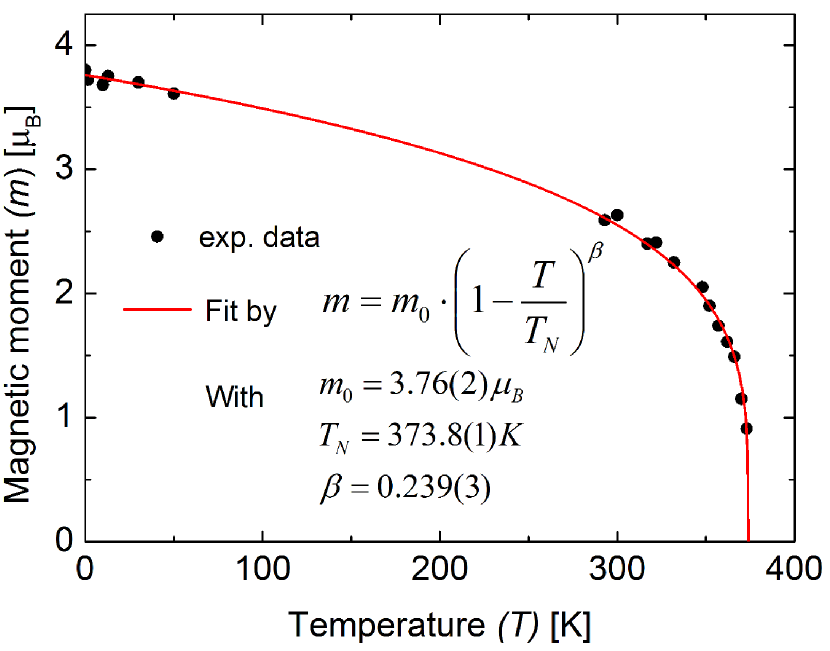
Figure 8 shows the temperature dependence of the magnetic moment
m obtained from the refinement of the neutron diffraction data.
All data below 380 K were fitted by the power law of
with Nel temperature, = 373.77 K and the critical exponent
= 0.239.
Regarding the magnetism of LaOMnAs, in Ref. Emery et al., 2010, it was found
that it is antiferromagnetically ordered in the plane, similar to
LiMnAs, according to neutron diffraction analysis at lower temperatures.
The small increase in the magnetic moments was explained Emery et al. (2010) by a
weak ferromagnetic behavior as a result of a small spin canting.
Such canting could be caused by broken inversion symmetry, giving rise to
the Dzyaloshinskii-Moriya Dzyaloshinskii (1958); Moriya (1960) interaction
modifying the magnetic ground state, which ceases to remain collinear.
However, in LiMnAs and LaOMnAs, the inversion symmetry break occurs anyway
at their surfaces or interfaces.
Thus, in bulk LaOMnAs we would expect, that canting plays a negligible role.
Instead of canting, we explain the small remanent total moment of these compounds
with the formation of MnAs as an impurity phase.
This is because during synthesis, independent of the method used,
tiny amounts of MnAs (%) can easily be formed,
which cannot be detected by techniques such as XRD or energy-dispersive X-ray
spectroscopy (EDX).
As shown by the data in Table 2, MnAs is an ordered FM
material. It has a Curie temperature of
approximately 320 K,Ishikawa et al. (2006b) exactly coinciding with the magnetic transition temperature in our
measurements. Thus, the presence of MnAs impurities in the samples offer a more straightforward
explanation for the small remanent total moments reported in
Ref. Emery et al., 2010, rather than spin canting.
Regarding the non-Curie-Weiss-like behavior of the magnetization as a function
of temperature reported for related Mn compounds Schucht et al. (1999),
our DFT calculations (see below) have shown that within the layers, the Mn
moments are very strongly coupled relative to the weak interlayer couplings.
Additionally, in LiMnAs between the layers, the Mn atoms are actually coupled
ferromagnetically with their next nearest neighbors and antiferromagnetically
with their second nearest neighbors.
Because of this complex interaction between Mn moments, even above the Néel
temperature, a short-range local order is present, causing the
non-Curie-Weiss-like behavior described above.
In comparison with theory, DFT calculations (see below) yield a value of
for the antiferromagnetically ordered structure at 0 K.
In the refinement, the magnetic form factor for Mn2+ has been used.
Instead of Mn2+, taking the magnetic form factor for Mn+
results in a slight correlation with the magnetic moments, where the magnetic
moment of Mn is enhanced by about 0.1-0.2 .
However, in LiMnAs, referring to Mn2+ makes chemically more logical.
This is supported by analyzing the X-ray absorption near edge structure
spectroscopy (XANES) data of several Mn compounds including LiMnAs.
The environment and the valence state of the Mn atoms in LiMnAs have been
investigated by means of extended X-ray absorption fine-structure (EXAFS)
and XANES at the Mn edge (6539 eV) at room temperature in the
transmission arrangement at the EXAFS beamline
of the Hamburg synchrotron radiation laboratory, HASYLAB, at DESY.
Wavelength selection was realized by means of a Si(111) double-crystal
monochromator. The near edge region of 6510-6560 eV was measured with a minimal
step size of 0.25 eV, and the EXAFS regime was measured up to 7540 eV.
A mass of approximately 10 mg of powdered Mn compounds with a particle size
of m were diluted with powder and mixed with
polyethylene powder.
The mixture was pressed to form a pellet with a diameter of 10 mm.
All of the handling was performed under an argon atmosphere in a glove-box.
Reference data were measured simultaneously with a Mn-foil.
This spectrum serves as an external reference for energy calibration and Mn valency.
Figure 9 shows the EXAFS signal, , and the
corresponding Fourier transform.
The EXAFS data were analyzed in accordance with the standard procedure for data
reduction,Konigsberger and Prins (1988) using IFFEFIT.Newville (2001)
The FEFF program was used to obtain the phase shift and amplitudes.Zabinsky et al. (1995)
The EXAFS signal was extracted and Fourier-transformed (FT)
using a Kaiser-Bessel window with a range of 7.0 Å-1.
The curve shows the characteristic pattern for this compound.
The FT pattern shows one broad peak at approximately 2.2 Å
(uncorrected for the phase shift),
which corresponds to the Mn–As and Mn–Mn scattering contributions.
The Mn–Li scattering contribution is also included in this region;
however, it does not have a strong influence on the main peak.
The grey line in Figure 9 represents the best fitting curve of the data.
The structural parameters obtained from the Rietveld refinement were used as
the input data to generate the cluster of atoms used.
Only single scattering events were considered in the fitting procedure.
The excellent agreement between the data and the theoretical structure was
accomplished by the low factors(%).
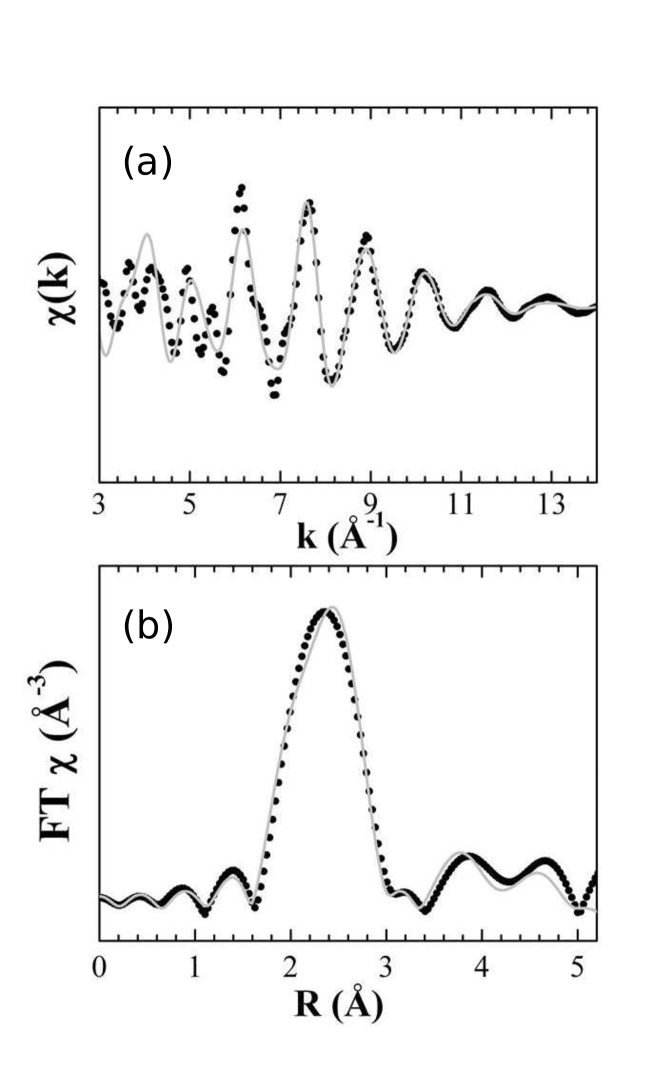
A quantitative analysis extracted from the EXAFS data is summarized in Table 4. The amplitude-reduction term (S0)2 used was 0.75. The Mn–As and Mn–Mn distances are slightly contracted by % and the Mn–Li by % compared to the crystallographic data.
| Shell | Element | CN | [Å] | [Å] | [Å2] | [%] |
|---|---|---|---|---|---|---|
| 1st | As | 4 | 2.601 | 2.550 | 0.006 | |
| 2nd | Mn | 4 | 3.012 | 2.953 | 0.006 | 0.6 |
| 3rd | Li | 2 | 3.085 | 2.870 | 0.006 |
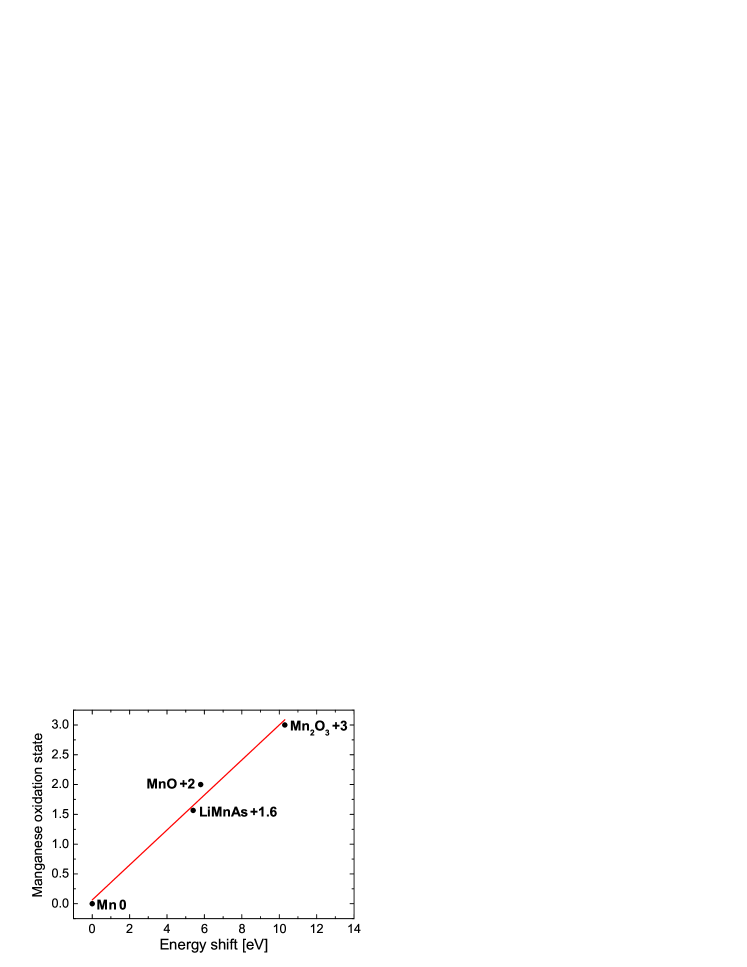
In Table 4, the distances obtained by the neutron-diffraction refinement are compared with the EXAFS data. The oxidation state of Mn in LiMnAs was obtained by using the XANES analysis with a widely used method as described by Wong et al.Wong et al. (1984) This method considers the determination of the edge shift in relation to the Mn0 edge energy for a given compound. In this case, there is a linear relation between this energy shift and the oxidation state. Using the oxidation state and energy shift of some standard oxides (Mn2O3 and MnO in this case), it is possible to find a linear relation, and obtain the oxidation state for the compound (Figure 10). This method reveals an oxidation state of Mn in LiMnAs of 1.6. Such a decrease in the oxidation state can be expected from weak homonuclear Mn–Mn interactions in the plane. This is supported by DFT calculations (see below), which show a considerable interaction in the planes of Mn atoms, affecting their hybridization.
II.3 DC-resistivity
The resistivity of polycrystalline LiMnAs was recorded using the ”Van der Pauw”
method in the temperature range of 50-300 K.
For LaOMnAs, the electrical resistivities (T) from 100-400 K were obtained
by a standard linear four-point contact method.
The measurement was performed by means of a physical property measurements system
(PPMS, Quantum design model 6000, supported by LOT Germany).
Bars of LaOMnAs mm3 were cut from pellets obtained by a
spark plasma sintering (SPS) process.
Both LiMnAs and LaOMnAs show very high resistivity below ca. 100 K.
The resistivity measurements suggest a semiconducting behavior.
The Arrhenius equation and an Arrhenius plot were used in order to
obtain the activation energy, which has a value of approximately
half of the band gap energy for intrinsic semiconductors Kittel (1973) according to
the relation:
| (1) |
where = Boltzmann constant (8.617332 eV/K), is the absolute temperature, and is the band gap width. Figure 11 shows the Arrhenius plot and the temperature dependence of the conductivity measurements for LiMnAs and LaOMnAs.
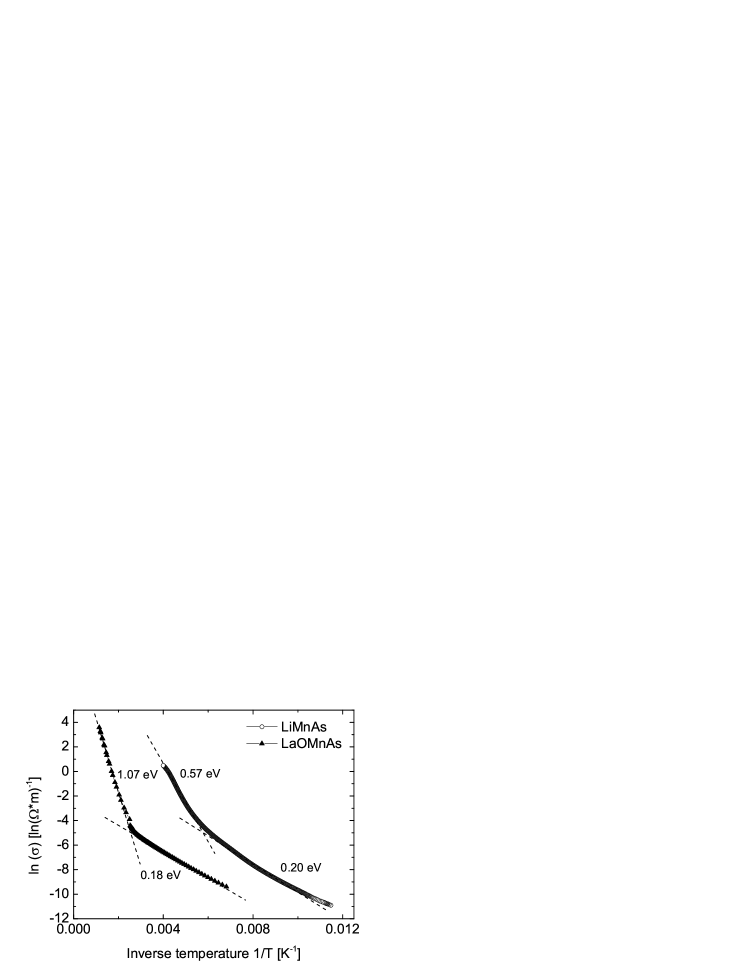
In the resistivity measurements both samples show the same behavior, namely, two distinct sections of activated conduction with a small of 0.20 eV for LiMnAs and an of 0.18 eV for LaOMnAs, which indicate doped levels at lower temperatures and a larger of 0.57 eV for LiMnAs and an of 1.07 eV for LaOMnAs respectively, at higher temperatures.
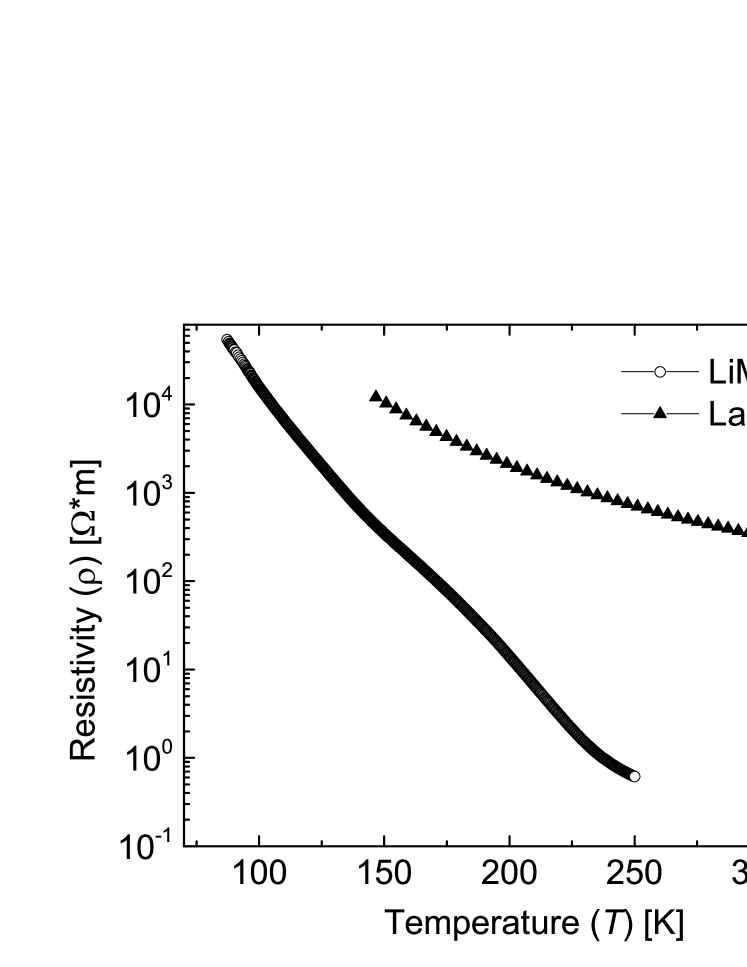
Figure 12 shows the resistivity as a function of temperature on a logarithmic scale. We note in particular, that the electrical resistivity changes by more than five orders of magnitude for LiMnAs in the temperature range of 100–250 K and by about two orders of magnitude for LaOMnAs from 150–350 K.
II.4 Dielectric permittivity
Ellipsometric measurements covering the far-infrared to deep-ultraviolet spectral range (10 meV–6.5 eV) were carried out at room temperature on LaOMnAs ceramic dense pellets polished to an optical grade finish. The measurements in the near-infrared to deep ultraviolet spectral range (0.75 eV - 6.5 eV) were performed with a rotating analyzer-type Woolam VASE variable-angle ellipsometer. For the infrared measurements from 0.01 eV to 1.0 eV, we used home-built ellipsometers in combination with a Bruker Vertex 80v FT-IR spectrometer. Some of the experiments were performed at the infrared IR-1 beamline of the ANKA synchrotron light source at the Karlsruhe Institute of Technology, Germany. The complex dielectric function, was directly determined from ellipsometric angles and Woollam and Co . The inversion of the ellipsometric data was performed within the framework of an effective medium approximation, which in the case of polycrystalline samples corresponds to the volume average of the anisotropic dielectric tensor projections. We did not take into account the surface roughness grain texturing effects on , which is estimated to be less than 10 over the measured spectral range. Because of the air sensitivity, it was not possible to obtain ceramics of LiMnAs sufficiently dense for optical measurements.
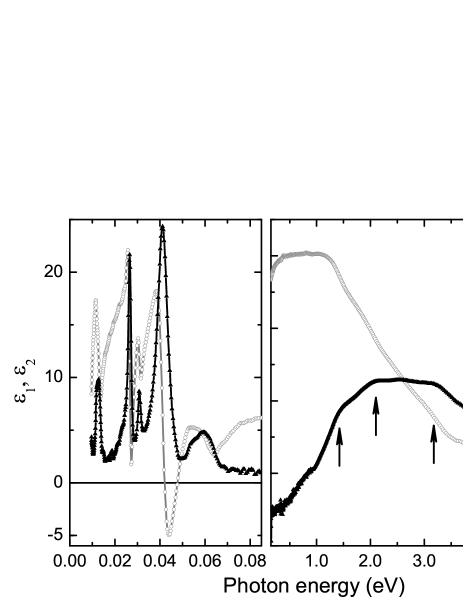
Figure 13 shows the complex dielectric function of the LaOMnAs sample at K. In the far-infrared range, there are six strong phonon modes. The lowest interband transition in this material lies above 0.4 eV. One can clearly distinguish three optical bands peaked at , , and eV.Boris et al. (2009). These transitions provide the main contribution to the static permittivity and form the direct absorption edge, below which the real part of the dielectric permittivity becomes nearly constant down to the phonon frequencies, eV eV. We note that the main features resemble those that characterize the interband electronic contribution to the dielectric function of polycrystalline LaOFeAs, while shifted by eV to higher energy Boris et al. (2009). The rise of above 0.4 eV can be attributed to indirect interband transitions.
II.5 DFT calculations
In order to gain further insights into the electronic structure and energetics
of LiMnAs and LaOMnAs, we have performed ab-initio calculations based on
the density functional theory (DFT) with the VASP Kresse and Furthmüller (1996a, b) code.
For the approximate treatment of the electron exchange and correlation, we have used the
Perdew, Burke, Ernzerhof (PBE) functional Perdew et al. (1996) together with the
projector-augmented wave (PAW) method with a plane-wave cutoff energy of 400 eV.
In the irreducible part of the Brillouin zone, the k-point integration was performed on an
884 Monkhorst-Pack mesh.
To describe the magnetic ordering in the compounds as found from neutron
diffraction for the tetragonal antiferromagnetic structures, spin polarized calculations
have been carried out for supercells containing four primitive unit cells
(see Fig. 1).
In the case of LiMnAs, the calculated local Mn moments of 3.82 for the
ground state are in excellent agreement with the value of 3.72
measured at 1.6 K, which is the most representative temperature for a comparison between
experiment and theory.
As already mentioned in the introduction, the magnetic moment of the Mn
atoms is well localized in this class of materials.
Based on a fully ionic picture of LiMnAs, i. e.
Li+, Mn2+, As3-, one would expect that the oxidation state of Mn
to be 2+.
The experimentally obtained value of 1.6+ from XANES measurements
are somewhat lower than this 2+ expected value.
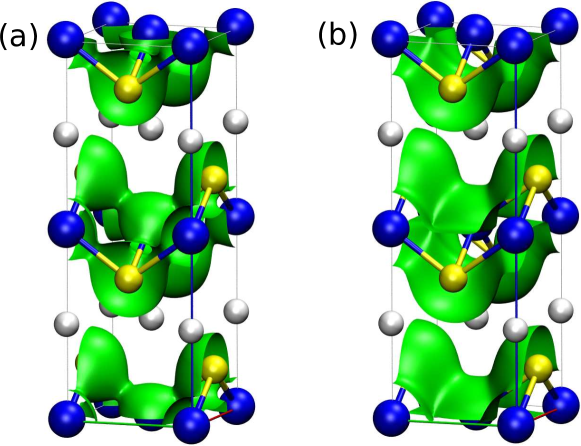
Therefore, we have looked into the real-space density of LiMnAs, and
apart from the expected hybridization between Mn and As
(see left panel in Fig. 14), we found that there is also
a feature present that corresponds to a mixture between Mn–Mn bonds
and Mn–As bonds (see right panel in Fig. 14).
From subsequent DFT calculations, we have determined the magnetic exchange coupling
constants of the classical Heisenberg model,
, where
are the unit vectors corresponding to the directions of the local magnetization
at sites and .
For this purpose, we have employed the SPR-KKR program package,Ebert et al. (2011)
which is a suitable numerical tool for such computational task, not relying on
pseudopotentials, where can be evaluated within the Green’s function
formalism.
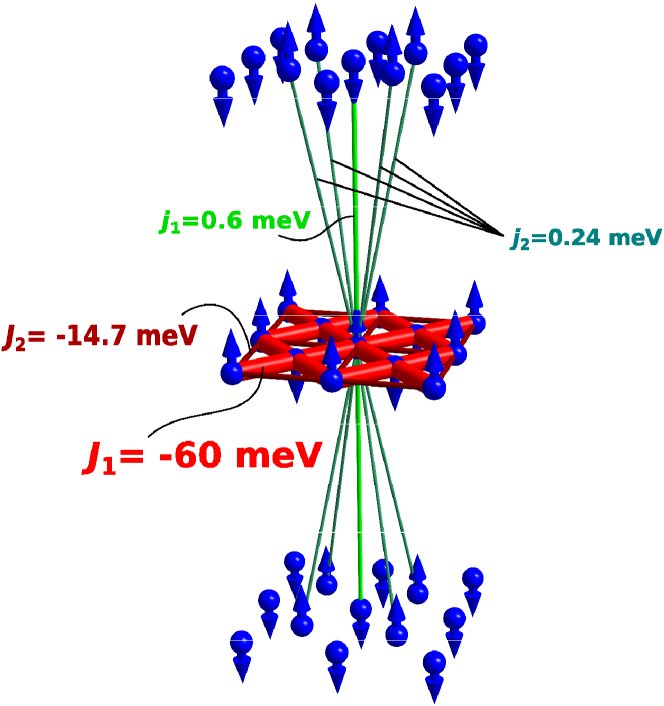
As it follows from analysis of the exchange coupling scheme (see Fig. 15),
within each Mn plane, the magnetic moments of the nearest neighbors are coupled
antiparallel (with meV, shown in red), and this strong antiparallel
coupling cannot be perturbed by the competing but smaller next-nearest neighbor antiparallel
interaction ( meV, shown in dark-red).
Thus, within each plane the nearest Mn
magnetic moments are ordered antiferromagnetically. Further, to
understand how the nearest planes are magnetically oriented to one
another, we consider the inter-plane exchange coupling. Both
leading constants of the inter-plane exchange are positive,
and 0.24 meV, which correspond to the nearest and
next-nearest inter-plane interactions, respectively. It is easy to see
that for an already fixed in-plane magnetic order, these two interactions are
also competing. Despite the fact that , each Mn atom (for simplicity we
consider one in the center of Fig. 15) has only
2, but 8 next-nearest inter-plane neighbors, which leads to
an overall domination of the next-nearest inter-plane coupling
(); thus, the next-nearest Mn planes are coupled antiferromagnetically.
Based on the Mulliken analysis, the corresponding partial charges, i. e., oxidation
numbers of Li, Mn, and As were computed as , , and , respectively.
This is again in good agreement with the XANES measurement presented
above, where an oxidation state of 1.6 was determined for the Mn atom in LiMnAs.
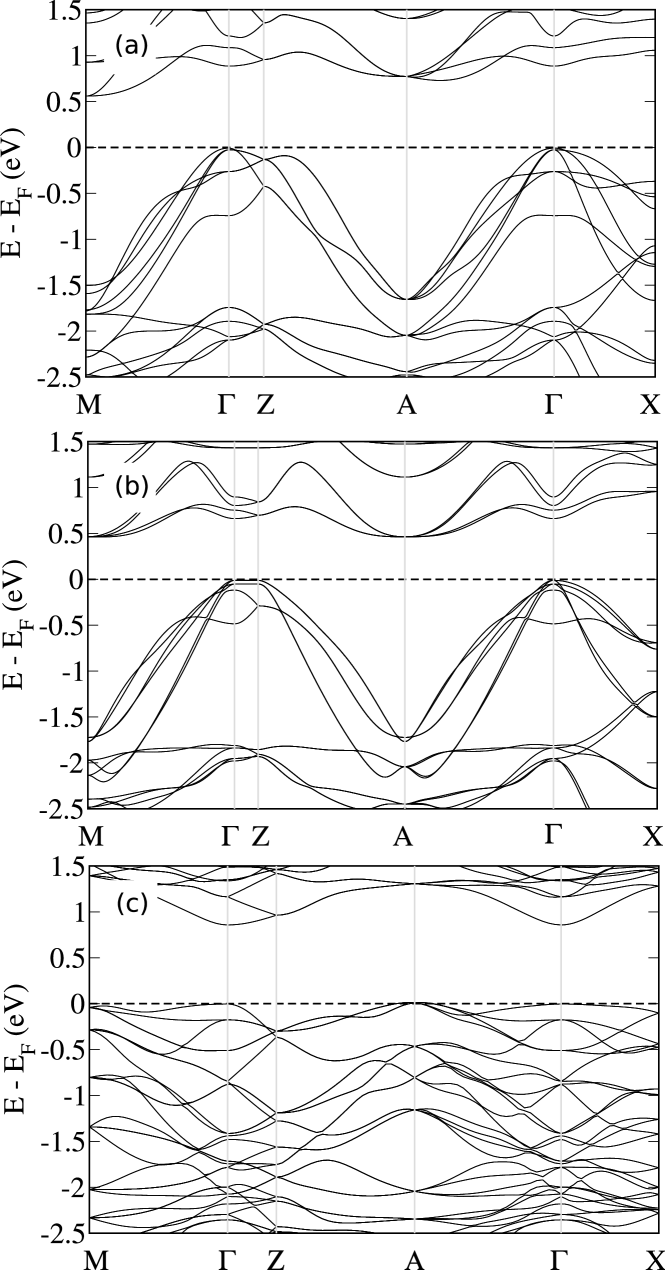
For LiMnAs, in our calculations we found an indirect band gap of 0.55 eV
(see Fig. 16 (a)), which is very close to the 0.57 eV gap estimated from the higher
temperature range of the Arrhenius plot of the conductivity measurements given in the previous
sections.
These results are also in a good agreement with the recent full potential
calculations for bulk LiMnAs, where within the local density approximation (LDA)
a -M indirect gap of approximately 0.5 eV Jungwirth et al. (2011) was computed.
As already shown, at 768 K LiMnAs undergoes a phase transition to the cubic crystal system.
Due to computational limitations and difficulties from the perspective of the
methodology, the implicit treatment of temperature effects in ab-initio
calculations is not straightforward.
Therefore, for the study of the cubic phase we have assumed, that the Mn atoms
are ordered antiferromagnetically as in the tetragonal phase.
Using this model, our calculations indicate, that in contrast to the tetragonal
phase, the cubic structure has a direct band gap of 0.84 eV.
By comparing the computed total energies of the tetragonal and cubic phases,
we found that the cubic phase is only 24 meV higher in energy per formula unit
than the tetragonal phase.
Thus, although the tetragonal structure is the ground state, the
tetragonal-to-cubic phase transition can easily take place.
This is because the two phases are rather close in energy, and the energy
difference of 24 meV is lower than the 75 meV thermal energy of the system at
768 K, which means that the system can easily surmount the energy difference
of 24 meV.
Hence, there is good agreement between the theoretically estimated
energy difference and the experimentally measured 23 meV/f.u.
change in enthalpy, which justifies the use of the
simplified theoretical model.
Our calculations suggest that AFM ordering dominates in LiMnAs so strongly,
to the extent that even if LiMnAs could be synthesized in the cubic phase,
the pure undoped compound would still be an AFM semiconductor.
In the case of LaOMnAs, the theoretical local moments as obtained with the
PBE functional for the Mn atoms are .
In contrast to these results, via neutron diffraction measurements performed at
290 K, the refined magnetic moment of Mn was ,
which is more than one lower compared to our theoretical result.
In a later experiment,Emery et al. (2011) however, it was shown that the moments at 2 K
are 3.34 , which is in good agreement with our calculations.
In the case of LiMnAs, our neutron-diffraction data also show a similar trend as a
function of temperature, where at 300 K the Mn moments are reduced from
3.72 to 2.62 (see Table 1).
Furthermore, in case of the structurally closely related BaMn2As2 the Mn local moments
were determinedSingh et al. (2009) to be 3.88 at 10 K.
Hence, the magnetic properties and magnetic moments are rather similar in the
whole family of the MnAs ( = Li, LaO, Ba, etc.) layered structure type.
The computed oxidation state of the La, O, Mn, and As atoms are +2.4, -0.8, +1.4, and -3.1,
respectively, i. e., the oxidation state of O is underestimated, and that of As
is overestimated.
Regarding the electronic structure, we found that LaOMnAs is also an indirect
band-gap semiconductor with an of 0.46 eV (see Fig. 16 (b)),
which is considerably lower than the value of 1.07 eV derived from the Arrhenius plot.
III Conclusion
In summary, in this paper, we have presented a broad overview of the synthesis,
atomic and electronic structure, and magnetic properties of LiMnAs, LaOMnAs, and other
related compounds in the Mn family.
Thus, with this work, we respond to several important questions raised concerning this
important class of materials.
In general, the compounds in the Mn family can be classified in two main categories:
AFM semiconductors and FM metals.
The nature of the magnetic coupling and of the semiconducting or metallic
behavior is mainly determined by the shortest Mn–Mn distances (),
which seems to be a general property of the compounds containing MnAs layered networks.
For LiMnAs and LaOMnAs, our data are in good agreement with the literature,
showing that both are antiferromagnetic semiconductors, with a magnetic moment
of ca. 4 per Mn atom at low temperatures.
Interestingly, by combining thermal analysis and temperature dependent XRD
measurements, a phase transition to the cubic Half-Heusler phase has been discovered.
Theoretical calculations suggest that even if cubic LiMnAs could be stabilized,
the ideal undoped cubic counterpart would still be an AFM
semiconductor, similar to the tetragonal compound.
EXAFS and XANES measurements indicate the oxidation state of Mn to be 1.6.
This is in agreement with the concept of localized moments on Mn and explains
the close relationship between the cubic and tetragonal phase and the connection
between Mn and rare earth ions in tetragonally coordinated structures.
Regarding the weak ferromagnetism, in contrast to Refs. Emery et al., 2010, 2011,
due to symmetry considerations, we expect that canting takes place at the
surfaces and interfaces of LiMnAs and LaOMnAs, but in the bulk it is unlikely.
Resistivity measurements on LiMnAs and LaOMnAs show two distinct regions of
activated transport behavior, and a large change in resistivity by
more than five and two orders of magnitude, respectively.
Furthermore, we have shown that LaOMnAs is also a promising material for the
realization of spin valves,Park et al. (2011)
and our findings suggest that compounds such as BaMn2As2 and
related compounds are promising candidates as well.
IV Acknowledgments
Financial support from the ERC Advanced Grant (291472) is gratefully acknowledged. We are grateful to Susann Scharsach for the DSC measurements, Dr. Gudrun Auffermann for the chemical analysis measurements and Igor Veremchuk for the spark plasma sintering (SPS) measurements from the Max-Planck-Institute for Chemical Physics of Solids. Prof. F. Bernardi received a research grant from CNPq - Brazil. Financial support from the DFG project FOR 1464 “ASPIMATT” (1.2-A) is gratefully acknowledged. We also thank Y.-L. Mathis for providing support at the infrared beamline of the synchrotron facility, ANKA, at the Karlsruhe Institute of Technology.
References
- Žutić et al. (2004) I. Žutić, J. Fabian, and S. Das Sarma, Rev. Mod. Phys. 76, 323 (2004).
- Dietl et al. (2000) T. Dietl, H. Ohno, F. Matsukura, J. Cibert, and D. Ferrand, Science 287, 1019 (2000).
- Jungwirth et al. (2006) T. Jungwirth, J. Sinova, J. Mašek, J. Kučera, and A. MacDonald, Rev. Mod. Phys. 78, 809 (2006).
- Deng et al. (2011) Z. Deng, C. Jin, Q. Liu, X. Wang, J. Zhu, S. Feng, L. Chen, R. Yu, C. Arguello, T. Goko, F. Ning, J. Zhang, W. Y., A. A. Aczel, T. Munsie, T. Williams, G. Luke, T. Kakeshita, S. Uchida, W. Higemoto, T. Ito, B. Gu, S. Maekawa, G. Morris, and Y. Uemura, Nature Comm. 2, 1 (2011).
- Mašek et al. (2007) J. Mašek, J. Kudrnovský, F. Máca, B. L. Gallagher, R. P. Campion, D. H. Gregory, and T. Jungwirth, Phys. Rev. Lett. 98, 067202 (2007).
- Jungwirth et al. (2011) T. Jungwirth, V. Novak, X. Marti, M. Cukr, F. Maca, A. Shick, J. Mašek, P. Horodyska, P. Nemec, V. Holy, J. Zemek, P. Kuzel, I. Nemec, B. Gallagher, R. Campion, C. Foxon, and J. Wunderlich, Phys. Rev. B 83, 035321 (2011).
- Novak et al. (2011) V. Novak, M. Cukr, Z. Soban, T. Jungwirth, X. Marti, V. Holy, P. Horodyska, and P. Nemec, J. Crys. Growth 323, 348 (2011).
- Wijnheijmer et al. (2012) A. Wijnheijmer, X. Marti, V. Holy, M. Cukr, V. Novak, T. Jungwirth, and P. Koenraad, Appl. Phys. Lett. 100, 112107 (2012).
- Máca et al. (2012) F. Máca, J. Mašek, O. Stelmakhovych, X. Martí, H. Reichlová, K. Uhlířová, P. Beran, P. Wadley, V. Novák, and T. Jungwirth, J. Magn. Magn. Materials 324, 1606 (2012).
- Wunderlich et al. (2006) J. Wunderlich, T. Jungwirth, B. Kaestner, A. Irvine, A. Shick, N. Stone, K.-Y. Wang, U. Rana, A. Giddings, C. T. Foxon, R. Campion, D. Williams, and B. Gallagher, Phys. Rev. Lett. 97, 077201 (2006).
- Tapp et al. (2008) J. H. Tapp, Z. Tang, B. Lv, K. Sasmal, B. Lorenz, P. C. W. Chu, and A. M. Guloy, Phys. Rev. B 78, 060505R (2008).
- Bronger et al. (1986) W. Bronger, P. Müller, R. Höppner, and H. Schuster, Z. Anorg. Allg. Chem. 539, 175 (1986).
- Emery et al. (2010) N. Emery, E. Wildman, J. Skakle, G. Giriat, R. Smith, and A. Mclaughlin, Chem. Comm. 46, 6777 (2010).
- Graf et al. (2011) T. Graf, C. Felser, and S. Parkin, Prog. Solid. State Ch. 39, 1 (2011).
- Kübler et al. (1983) J. Kübler, A. Williams, and C. Sommers, Phys. Rev. B 28, 1745 (1983).
- Kandpal et al. (2006) H. Kandpal, C. Felser, and R. Seshadri, J. Phys. D: Appl. Phys. 39, 776 (2006).
- Felser et al. (2007) C. Felser, G. Fecher, and B. Balke, Angew. Chem. Int. Ed. 46, 668 (2007).
- Schucht et al. (1999) F. Schucht, A. Dascoulidou, R. Müller, W. Jung, H.-U. Schuster, W. Bronger, and P. Müller, Z. Anorg. Allg. Chem. 625, 31 (1999).
- Müller et al. (1991) R. Müller, M. Kuckel, H.-U. Schuster, P. Müller, and W. Bronger, J. Alloy. Compd. 176, 167 (1991).
- Otto et al. (1987) M. Otto, H. Feil, R. A. M. van Woerden, J. Wijngaard, P. Van Der Valk, C. F. van Bruggen, and C. Haas, J. Magn. Magn. Materials 70, 33 (1987).
- Emery et al. (2011) N. Emery, E. Wildman, J. Skakle, A. Mclaughlin, R. Smith, and A. Fitch, Phys. Rev. B 83, 144429 (2011).
- Dinh et al. (2008) V. Dinh, K. Sato, and H. Katayama-Yoshida, J. Phys. Soc. Japan 77, 014705 (2008).
- Van Engelen et al. (1994) P. Van Engelen, D. De Mooij, J. Wijngaard, and K. Buschow, J. Magn. Magn. Materials 130, 247 (1994).
- Ishikawa et al. (2006a) F. Ishikawa, K. Koyama, K. Watanabe, T. Asano, and H. Wada, J. Phys. Soc. Japan 75, 084604 (2006a).
- Haneda et al. (1977) S. Haneda, N. Kazama, Y. Yamaguchi, and H. Watanabe, J. Phys. Soc. Japan 42, 1201 (1977).
- Simonson et al. (2012) J. W. Simonson, Z. P. Yin, M. Pezzoli, J. Guo, J. Liu, K. Post, A. Efimenko, N. Hollmann, Z. Hu, H.-J. Lin, C.-T. Chen, C. Marques, V. Leyva, G. Smith, J. W. Lynn, L. L. Sun, G. Kotliar, D. N. Basov, L. H. Tjeng, and M. C. Aronson, Proc. Natl. Acad. Sci. 109, 10751 (2012).
- Achenbach and Schuster (1981) G. Achenbach and H. U. Schuster, Z. Anorg. Allg. Chem. 9, 475 (1981).
- Petricek et al. (2006) V. Petricek, M. Dusek, and L. Palatinus, “Jana 2006. The crystallographic computing system,” (Institut of Physics, Praha, Czech Republic, 2006).
- Dzyaloshinskii (1958) I. E. Dzyaloshinskii, J. Chem. Solids 4, 241 (1958).
- Moriya (1960) T. Moriya, Phys. Rev. Lett. 4, 228 (1960).
- Ishikawa et al. (2006b) F. Ishikawa, K. Koyama, K. Watanabe, T. Asano, and H. Wada, J. Phys. Soc. Japan 75, 084604 (2006b).
- Konigsberger and Prins (1988) D. Konigsberger and R. Prins, eds., X-Ray Absorption: Principles, applications and techniques of EXAFS, SEXAFS and XANES in Chemical Analysis, Vol. 92 (Wiley, New York, 1988).
- Newville (2001) M. Newville, J. Synchr. Rad. 8, 322 (2001).
- Zabinsky et al. (1995) S. Zabinsky, J. Rehr, A. Ankudinkov, R. Albers, and M. Eller, Phys. Rev. B 52, 2995 (1995).
- Wong et al. (1984) J. Wong, F. Lytle, R. Messmev, and D. Maylotte, Phys. Rev. B 30, 5596 (1984).
- Kittel (1973) C. Kittel, Introduction to Solid State Physics, 4th Edition (Wiley, New York, 1973).
- (37) J. Woollam and Co, Spectroscopic Ellipsometry Data Acquisition and Analysis Software WVASE32® [http://www.jawoollam.com].
- Boris et al. (2009) A. Boris, N. Kovalena, S. Seo, J. Kim, P. Popovich, Y. Matiks, R. Kremer, and B. Keimer, Phys. Rev. Lett. 102, 027001 (2009).
- Kresse and Furthmüller (1996a) G. Kresse and J. Furthmüller, Phys. Rev. B 54, 11169 (1996a).
- Kresse and Furthmüller (1996b) G. Kresse and J. Furthmüller, Comput. Mater. Sci. 6, 15 (1996b).
- Perdew et al. (1996) J. P. Perdew, K. Burke, and M. Ernzerhof, Phys. Rev. Lett. 77, 3865 (1996).
- Ebert et al. (2011) H. Ebert, D. Ködderitzsch, and J. Minár, Rep. Prog. Phys. 74, 096501 (2011).
- Singh et al. (2009) Y. Singh, M. A. Green, Q. Huang, A. Kreyssig, R. J. McQueeney, D. C. Johnston, and A. Goldman, Phys. Rev. B 80, 100403 (2009).
- Park et al. (2011) B. G. Park, J. Wunderlich, X. Martí, V. Holý, Y. Kurosaki, M. Yamada, H. Yamamoto, A. Nishide, J. Hayakawa, H. Takahashi, A. B. Shick, and T. Jungwirth, Nature Mat. 10, 347 (2011).