Orbital superexchange and crystal field simultaneously at play in :
resonant inelastic x-ray scattering at the V edge and the O edge
Abstract
We report on the observation of orbital excitations in YVO3 by means of resonant inelastic x-ray scattering (RIXS) at energies across the vanadium L3 and oxygen K absorption edges. Due to the excellent experimental resolution we are able to resolve the intra- excitations at 0.1 - 0.2 eV, 1.07 eV, and 1.28 eV, the lowest excitations from the into the levels at 1.86 eV, and further excitations above 2.2 eV. For the intra- excitations at 0.1 - 0.2 eV, the RIXS peaks show small shifts of the order of 10 - 40 meV as a function of temperature and of about 13 - 20 meV as a function of the transferred momentum . We argue that the latter reflects a finite dispersion of the orbital excitations. For incident energies tuned to the oxygen K edge, RIXS is more sensitive to intersite excitations. We observe excitations across the Mott-Hubbard gap and find an additional feature at 0.4 eV which we attribute to two-orbiton scattering, i.e., an exchange of orbitals between adjacent sites. Altogether, these results indicate that both superexchange interactions and the coupling to the lattice are important for a quantitative understanding of the orbital excitations in YVO3.
pacs:
71.27.+a, 71.70.Ch, 75.30.Et, 78.70.CkI Introduction
The electronic properties of strongly correlated transition-metal oxides strongly depend on spin and orbital degrees of freedom.Tokura and Nagaosa (2000) Both spins and orbitals on neighboring sites interact with each other via superexchange interactions,Kugel and Khomskii (1973) giving rise to a complex interplay and potentially to novel states induced by orbital quantum fluctuations. In this context the occurrence of orbital order and more exotic states, like an orbital Peierls stateUlrich et al. (2003); Sirker and Khaliullin (2003); Horsch et al. (2003) and an orbital-liquid ground state have been discussed.Khaliullin (2005) One possibility to test materials for those orbital states is to investigate the character of the elementary orbital excitations. If the superexchange interaction dominates, one expects novel collective elementary excitations, namely orbital waves or orbitons with a significant dispersion,Ishihara and Maekawa (2000) analogous to spin waves in a magnetically ordered state. However, the orbitals are also strongly coupled to the lattice,Jahn and Teller (1937) therefore orbital excitations in many compounds are well described in the limit of ‘local’ crystal-field excitations. If both, superexchange interactions and the coupling to the lattice are relevant, the spectral signatures become more difficult to interpret, a complex situation that has hardly been studied thus far.van den Brink (2001); Schmidt et al. (2007); Krivenko (2012); Horsch et al. (2008)
The experimental observation of orbitons at low energies 250 meV has been claimed based on Raman data of LaMnO3, TiO3, and VO3 with = rare earth.Saitoh et al. (2001); Miyasaka et al. (2005, 2006); Sugai and Hirota (2006); Ulrich et al. (2006) However, the orbiton interpretation of these data has caused controversy.Grüninger et al. (2002); Rückamp et al. (2005); Iliev et al. (2007); Benckiser et al. (2008); Jandl et al. (2010); Miyasaka et al. (2005, 2006); Sugai and Hirota (2006); Ulrich et al. (2006) For manganites with partially occupied states in a predominantly octahedral crystal field, it is meanwhile well established that the orbital degree of freedom is quenched by the strong crystal-field splitting of the order of 1 eV.Kovaleva et al. (2004); Gössling et al. (2008) Recently, it has been shown by resonant inelastic x-ray scattering (RIXS) on 1D cuprate chains that such high-energy orbital excitations may show a significant dispersion.Wohlfeld et al. (2011); Schlappa et al. (2012) The large dispersion reflects the strong superexchange coupling of the cuprates, and the high excitation energy results from the crystal-field splitting. At the same time, the high excitation energy of the lowest orbital excitation is a clear signature that orbital fluctuations are weak in the ground state, and that this orbitally ordered ground state is not affected by the high-energy dispersion. In contrast, the crystal-field splitting is much weaker for the partially occupied states in titanates and vanadates. For VO3 with electron configuration, it has been suggested that orbital quantum fluctuations may be comparatively strong because superexchange interactions between electrons are frustrated on a cubic or nearly cubic lattice.De Raychaudhury et al. (2007); Ishihara (2004); Ulrich et al. (2003); Horsch et al. (2003); Khaliullin et al. (2001) From magnetic neutron scattering, indications for highly unusual orbital correlations were found and the existence of an orbital Peierls state in the intermediate phase of YVO3 has been proposed.Ulrich et al. (2003) However, a recent study of the optical excitations across the Mott-Hubbard gap rules out that orbital fluctuations are strong in VO3.Reul et al. (2012) Some of us reported the observation of orbital excitations in the optical conductivity of YVO3.Benckiser et al. (2008) An optical absorption band at 0.4 eV for polarization of the electric field has been attributed to the exchange of orbitals on adjacent sites, i.e., to the direct excitation of two orbitons. A two-orbiton interpretation has also been discussed for the RIXS data of the orbital excitations of the compounds LaTiO3 and YTiO3.Ulrich et al. (2009); Ament and Khaliullin (2010) In the titanates, the two-orbiton character is difficult to prove since the orbital excitations are observed at the same energy of 0.20 - 0.25 eV in RIXS, Raman spectroscopy, and infrared absorption,Ulrich et al. (2006, 2008, 2009); Rückamp et al. (2005) while there is no clear signature of a one-orbiton excitation at about half the energy of the proposed two-orbiton peak. It has been claimed that the RIXS intensity of two-orbiton excitations may exceed that of single-orbiton modes in titanates, in particular if quantum fluctuations are large in the orbital sector.Ulrich et al. (2009); Ament and Khaliullin (2010)
RIXS is the analogue of Raman spectroscopy with x-ray photons. RIXS is very sensitive to orbital excitations, in particular in the soft x-ray range.Schmitt et al. (2002, 2004a, 2004b); Ghiringhelli et al. (2004); Chiuzbăian et al. (2005); Ghiringhelli et al. (2006a); Duda et al. (2006); Braicovich et al. (2007); Ulrich et al. (2008); Hague et al. (2008); Forte et al. (2008); Ament et al. (2011); Marra et al. (2012) At the V edge, a photon is resonantly absorbed, exciting a core electron to an empty state, and subsequently this intermediate state decays by re-emitting a photon, leaving the system in, e.g., an orbitally excited state. One major advantage of RIXS over Raman scattering with visible light is the short wavelength of x-rays, allowing to study the excitations as a function of the transferred momentum . Furthermore, by tuning the energy of the incoming light to a particular absorption band, special ions are selected and potentially also specific crystallographic sites. Since the probing depth for soft x-rays is comparatively large, bulk properties are probed. Here, we report on RIXS measurements with a resolution of 60 meV at the V edge and 70 meV at the O edge. We observe spin-conserving intra- excitations at 0.1 - 0.2 eV, orbital excitations from the high-spin = 1 ground state to low-spin = 0 states at 1.07 eV and 1.28 eV (these are allowed due to the strong spin-orbit coupling of the core hole), and further excitations above 1.8 eV. Our central results are the observations of a finite dispersion of the low-energy orbital excitations at 0.1 - 0.2 eV and of an additional weak peak at 0.4 eV for x-ray energies tuned to the O edge. The combination of RIXS and optical dataBenckiser et al. (2008) gives strong evidence for the interpretation of the 0.4 eV peak as a two-orbiton excitation.
The paper is organized as follows. Experimental details are given in Sec. II, followed in Sec. III by a short description of the crystal structure, the spin/orbital-ordered phases, and the electronic structure. Section IV describes our results. In Sec. IV.1 we briefly discuss x-ray absorption spectra. The RIXS features observed at the V edge are assigned to the different orbital excitations in Sec. IV.2. In Sec. IV.3 we concentrate on the low-energy orbital excitations observed at 0.1 - 0.2 eV, focussing on the observation of a finite dispersion and on the competition between superexchange interactions and the crystal field. Section IV.4 addresses the RIXS data measured at the O edge. Conclusions are given in Sec. V. In the appendix, we discuss optical data on crystal-field excitations of V3+ ions in DySc0.9V0.1O3.
II Experimental Details
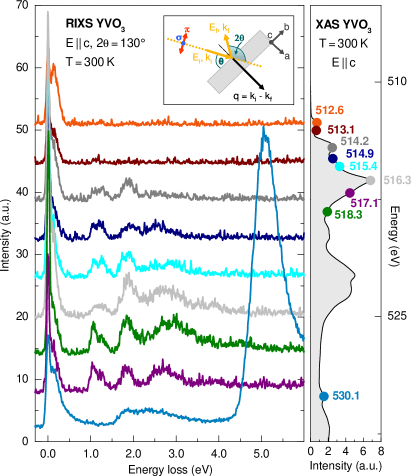
Single crystals of YVO3 were grown by the traveling-solvent floating zone method.Blake et al. (2002) Prior to the experiments the samples have been freshly cleaved in air. The measurements were performed using the soft x-ray spectrometer SAXES at the ADRESS beam line at the Swiss Light Source, Paul Scherrer Institut, Villigen, Switzerland, which has been designed especially for high-resolution RIXS.Strocov et al. (2010); Ghiringhelli et al. (2006b) The RIXS data were measured with a combined energy resolution (monochromator and spectrometer) of = 60 meV at the V edge and = 70 meV at the O edge for scattering angles of = 90∘ and 130∘ (see sketch in Fig. II). All measurements were performed in specular geometry to keep the transferred momentum parallel to the crystallographic axis. For this purpose, the sample was oriented with the axis perpendicular to the scattering plane and the incident x-rays were linearly polarized with ( polarization). Compared to polarization parallel to the scattering plane, polarization has the advantage that the orientation of the electric field with respect to the crystallographic axes is independent of the scattering angle. The polarization of the scattered light has not been determined. The attempt to measure a second sample with a different orientation to obtain data for failed due to experimental problems with this sample.
The incident energy has been varied across the V L3 and O K edges. Before the RIXS measurements, room-temperature x-ray absorption (XAS) spectra were measured in situ in total electron yield (TEY) mode (see right panel in Fig. II). Below about 100 K, the resistivity of the samples is very high, thus charging effects constricted the measurement of the drain current. Therefore, we additionally measured XAS spectra in total fluorescence yield (TFY) mode (inset in Fig. IV.1). Note that the absolute energy scale has been calibrated by a comparison with the XAS data of polycrystalline YVO3 and of V2O3.Pen et al. (1999); Park et al. (2000)
III Crystal Structure, Magnetic and Orbital Order, and Crystal-Field Levels
The pseudo-perovskite compound YVO3 shows several phase transitions as a function of temperature. In the room-temperature phase an orthorhombic structure (Pbnm) is adopted, while for a monoclinic structure (P21/b) with long-range orbital order was observedBlake et al. (2002); Reehuis et al. (2006)( type, possibly with an admixture of type, see discussion in Ref. Benckiser et al., 2008). Antiferromagnetic order of type was found below = 116 K. Below 77 K, the structure becomes orthorhombic (Pbnm) again, accompanied by a change to -type orbital and -type spin order.Blake et al. (2002); Reehuis et al. (2006) As far as the electronic structure is concerned, YVO3 is a Mott insulator with two localized electrons in the shell of each V3+ ion. A crystal field of predominantly octahedral symmetry gives rise to a splitting of the levels into a lower-lying level and an level. These are further split by the deviations from cubic symmetry.De Raychaudhury et al. (2007); Solovyev (2006, 2008); Otsuka and Imada (2006); Benckiser et al. (2008) In cubic approximation, the lowest-lying two-electron state shows symmetry (, = 1), the lowest excited states are of and symmetry (, = 0) and are expected above 1 eV (see Sec. IV.2). At still higher energies, states with the following symmetries are expected: (, = 1), (, = 0), as well as , , and (, = 0 or 1).Sugano et al. (1970) The cubic approximation is sufficient for the overall assignment of all RIXS peaks observed above 1 eV at the V edge. However, for the discussion of orbital excitations below about 0.5 eV we have to take into account deviations from cubic symmetry (see Secs. IV.2 and IV.3).
IV Results and Discussion
IV.1 XAS spectra
XAS spectra have been measured in total fluorescence yield at 22 K, 100 K, and 300 K, i.e., in all three crystallographic phases (inset of Fig. IV.1). The absorption bands peaking at about 516 eV, 522 eV, and 534 eV correspond to the V , V , and O edges, respectively, i.e., transitions from the spin-orbit split V and V core states to empty V states, and from O to O states, respectively. Empty states within the level of oxygen arise due to hybridization. In particular, the lowest peak at the O edge at 530.1 eV is attributed to states of mixed O - V character.Pen et al. (1999); Mossanek et al. (2009) A detailed analysis of the x-ray absorption spectra of YVO3 can be found in Refs. Hollmann, 2011 and Pen et al., 1999.
| (=1) | (=0) | (=1) | (=0, 1) | |
| and (=0) | ||||
| RIXS 2=90∘ | ||||
| 300K | (0.10 0.20)† | 1.07 1.25 | 1.84 | 2.2 - 3.5 |
| 100K | (0.11 0.20)† | 1.07 1.28 | 1.86 | 2.2 - 3.5 |
| 22K | (0.12 0.20)† | 1.07 1.27 | 1.88 | 2.2 - 3.5 |
| RIXS 2=130∘ | ||||
| 300K | (0.10 0.20)† | 1.07 1.25 | 1.84 | 2.2 - 3.5 |
| 100K | (0.13 0.22)† | 1.07 1.28 | 1.86 | 2.2 - 3.5 |
| Optics | ||||
| 300K | 0.12 - 0.22‡ | 1.1-1.2 | 1.84-1.87∗‡ | 2.2∗‡ |
| 100K | 0.12 0.22‡ | 1.1-1.3 | ||
| 22K | 0.12 0.21‡ | 1.1-1.3 | ||
| Theory (Ref. De Raychaudhury et al., 2007) | ||||
| 300K | 0.08 0.21 | |||
| 100K (V1) | 0.08 0.24 | |||
| 100K (V2) | 0.06 0.20 | |||
| 65K | 0.08 0.20 | |||
IV.2 Assignment of RIXS peaks (V edge)
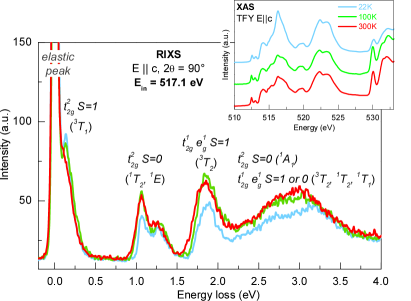
Figure II shows RIXS spectra at room temperature as a function of the transferred energy for different incident energies which are indicated by color-coded dots in the XAS data (right panel). Each spectrum has been accumulated over 30 minutes. Long-time scans with better statistics, accumulated over 3 hours are given in Fig. IV.1 for = 517.1 eV. At the V edge, we observe a series of inelastic peaks with energy transfers of about 0.10 - 0.20 eV, 1.07 eV, 1.25 eV, and 1.84 eV, and a broad band of overlapping features between 2.2 eV and 3.5 eV at 300 K. The spectral weights of these peaks strongly depend on but the peak energies do not (see Figs. II and IV.1), clearly demonstrating the Raman character of these modes. With increasing , the spectral weight of the higher-lying bands increases, which reflects the change of the intermediate state and the corresponding change of the resonance conditions.
The main contribution to the RIXS process at the V edge can be denoted by .Ghiringhelli et al. (2005); Ament et al. (2011) In the first step a V core electron is excited by a photon with to the open shell. In the second step an electron relaxes to the shell, leaving the system either in the initial ground state (, elastic peak), or in a low-energy excited state (, inelastic peaks). For energies smaller than the Mott-Hubbard gap of about 1.6 eV,Benckiser et al. (2008) this low-energy excitation can be a phonon, a magnon, or an orbital excitation. In general, also combined excitations such as an orbital excitation with phonon (or magnon) sidebands are allowed. In YVO3 phonon energies are smaller than 0.09 eV,Tsvetkov et al. (2004); Miyasaka et al. (2005, 2006); Sugai and Hirota (2006); Jandl et al. (2010) and magnon energies do not exceed 0.04 eV,Ulrich et al. (2003) thus we attribute the observed RIXS features to orbital excitations. Indeed, the excitation energies observed in RIXS are in excellent agreement with the values derived for the orbital excitations by optical absorption measurements.Benckiser et al. (2008) For the sake of completeness we note that these orbital excitations may show phonon (or magnon) sidebands, which may be important for the discussion of the line width (see Sec. IV.3.1). YVO3 shows inversion symmetry on the V sites. Thus orbital (or -) excitations are forbidden in optics by parity and do not directly contribute to the optical absorption spectrum due to the dipole selection rule. A weak contribution to the optical spectrum arises by the simultaneous excitation of a phonon. In oxides, the O phonon modes of 50 - 80 meV are most effective. In contrast, an orbital excitation in RIXS corresponds to two subsequent dipole-allowed transitions, thus orbital excitations contribute directly to the RIXS signal. When comparing the results of the two spectroscopies for the energies of the spin-conserving excitations from the = 1 ground state to = 1 final states (see Tab. 1), the phonon shift occurring in optical absorption data has to be taken into account.
At the V edge, the overall RIXS spectrum (see Fig. IV.1) can be well described in a local crystal-field scenario. For a high-spin = 1 ground state, we expect the following orbital excitations with increasing energy: spin-conserving intra- excitations at low energies; spin-flip intra- excitations to a low-spin = 0 final state at about , where eV denotes Hund’s coupling;Zaanen and Sawatzky (1990); Mizokawa and Fujimori (1996) and excitations at higher energies (see Tab. 1). In the optical data,Benckiser et al. (2008) the spin-conserving intra- excitations have been identified with a feature at about 0.20 - 0.26 eV. Subtracting a phonon shift of 50 - 80 meV, this yields 0.12 - 0.21 eV for the orbital excitations, in excellent agreement with the RIXS peak at about 0.1 - 0.2 eV. These values also agree with various theoretical results predicting the intra- transitions in the range of 0.06 - 0.24 eV.De Raychaudhury et al. (2007); Solovyev (2006, 2008); Otsuka and Imada (2006) Based on Raman scattering data, the observation of orbitons has been claimed in VO3 at lower excitation energies of 43 meV and 62 meV (Refs. Miyasaka et al., 2005, 2006) and at 45 meV and 84 meV.Sugai and Hirota (2006) However, a more recent studyJandl et al. (2010) suggests that these peaks have to be interpreted as multiphonons, in agreement with our results. A more detailed analysis of the low-energy RIXS feature is given in Sec. IV.3.
Intra- excitations from the high-spin = 1 ground state to a low-spin = 0 final state are expected at about eV.Zaanen and Sawatzky (1990); Mizokawa and Fujimori (1996) In optics, these excitations give rise to a rich structure with dominant peaks at about 1.1 - 1.3 eV,Benckiser et al. (2008) again in excellent agreement with the RIXS data. The value of is hardly screened in a solid, thus very similar energies are observed for ions in different compounds, e.g., V-doped -Al2O3.Dong-ping et al. (1997) In the intermediate state of the RIXS process at the V edge, spin is not a good quantum number due to the large spin-orbit splitting between V and V core-hole states. Therefore, the spin-selection rule does not apply, giving rise to a large spectral weight of such high-spin to low-spin excitations.de Groot et al. (1998); Ghiringhelli et al. (2009) This is corroborated by the absence of RIXS peaks between 1.1 and 1.3 eV in the data obtained at the O edge (see Fig. II). The core hole in the corresponding intermediate state does not show an orbital moment, thus the spin-orbit mechanism is ‘switched off’ and the spin-selection rule applies. Also in optics, the spin-flip excitations are suppressed by the spin selection rule, but they become weakly allowed by spin-orbit coupling or by the simultaneous excitation of a magnon.Sugano et al. (1970); Figgis and Hitchman (2000) Therefore, it is not necessary to consider a phonon shift for the comparison of optics and RIXS in the case of spin-flip excitations.
The RIXS peak observed at 1.84 eV at 300 K (see Fig. IV.1) corresponds to excitations from the level into the level, , i.e., to excitations into in cubic approximation. A value of roughly 2 eV is typical for a V3+ ion in an oxygen octahedron.Sugano et al. (1970); Figgis and Hitchman (2000); Dong-ping et al. (1997); Ishii et al. (2002) Again, RIXS and optical results are in excellent agreement with each other (see Appendix). A detailed assignment of the higher-lying excitations is hindered by the fact that the different contributions strongly overlap in the RIXS data. At 300 K, we observe a peak at about 3.0 eV with shoulders at about 2.3 eV and 2.7 eV. For the configuration in a ligand field of intermediate strength, the Tanabe-Sugano diagramSugano et al. (1970); Figgis and Hitchman (2000) predicts in cubic approximation that the energy of the spin-flip excitation is about 2.1 - 2.2 times the energy of the band observed at 1.07 - 1.25 eV. Thus we expect the peak roughly at 2.2 - 2.8 eV, i.e., in the range of the shoulders at 2.3 eV and 2.7 eV. Above the peak, the Tanabe-Sugano diagram predicts excitations to , , and . As noted above for the peaks at 1.07 - 1.25 eV, the orbital excitation energies observed here are similar to the ones reported for V3+ ions doped into -Al2O3, in which the and excitations lie at 2.6 eV and 3.1 eV, respectively.Dong-ping et al. (1997) For the data measured at the V edge we conclude that the RIXS spectrum above about 1 eV can be well described in terms of local crystal-field excitations.
IV.3 Low-energy orbital excitations at 0.1 - 0.2 eV
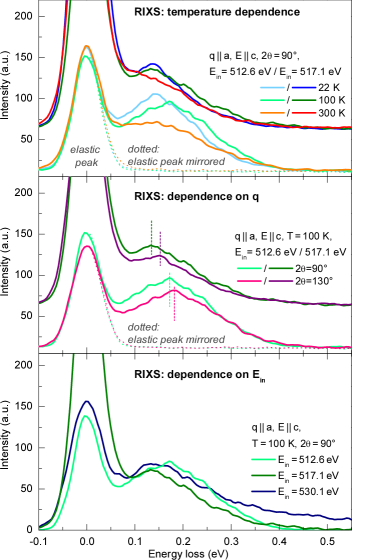
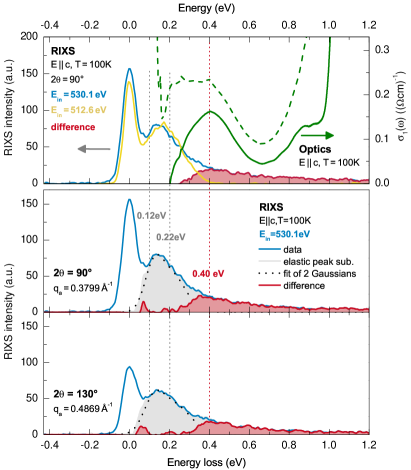
Our main goal is to clarify whether a local crystal-field scenario fully describes the orbital excitation spectrum, or whether superexchange plays a significant role. A thorough quantitative analysis has to consider both the crystal field and superexchange interactions simultaneously. However, this complex problem has hardly been addressed thus far.van den Brink (2001); Schmidt et al. (2007); Krivenko (2012); Horsch et al. (2008) Therefore we focus on the two limiting cases, either a dominant crystal field or dominant superexchange interactions. Both, superexchange and the non-cubic crystal field lift the threefold orbital degeneracy of the cubic ground state, giving rise to low-energy intra- excitations. We concentrate on these excitations below 0.5 eV, where the energy scale of superexchange interactions may become comparable to the excitation energy itself. Figure IV.3 depicts the dependence of the low-energy RIXS spectra on temperature (top panel) and crystal momentum (middle panel) for incident energies of eV and 517.1 eV, as well as the dependence on (bottom panel).
IV.3.1 Line width, peak energy, and number of peaks
The overall line width of about 0.2 eV of the features at 0.1 - 0.2 eV is certainly larger than the experimental resolution of 60 meV. We identify two main reasons for the large line width: (i) a multi-peak structure, i.e. the experimental feature is composed of more than one peak, and (ii) the coupling to phonons or magnons, giving rise to incoherent parts of the orbital spectra.
In a crystal-field scenario, the coupling of the orbital degrees of freedom to phonons gives rise to a vibronic character of the elementary excitations. The spectrum is composed of a series of phonon ‘sidebands’. In a solid, these sidebands are typically not resolved but form a broad excitation continuum.Figgis and Hitchman (2000); Henderson and Imbusch (1989) Concerning point (i), a multi-peak structure arises both from the splitting of the orbitally threefold degenerate state in a non-cubic environment and from the existence of two different V sites within the unit cell in the intermediate phase at 100 K. In total, this yields four different excitation energies in a crystal-field scenario. However, results based on LDADe Raychaudhury et al. (2007) (local density approximation) and first principlesSolovyev (2008) indicate that the crystal-field splitting is similar for the two V sites and that the excitation spectrum can be grouped into two bands (at 0.06 - 0.08 eV and 0.20 - 0.24 eV according to Ref. De Raychaudhury et al., 2007, see Tab. 1, or at 0.10 - 0.13 eV and 0.20 eV according to Ref. Solovyev, 2008) which reflect the splitting of the cubic state.
In a superexchange scenario, one also expects a multi-peak structure, namely two different one-orbiton modes. For the intermediate state at = 100 K with -type spin order and -type orbital order, one mode is expected to show a dispersion for (see below) whereas the other one remains dispersionless.Oleś et al. (2007); Ishihara (2004) A model based only on superexchange neglects the coupling to phonons and thus neglects the vibronic broadening. However, orbital excitations are also coupled to magnons via the common superexchange processes, giving rise to broad incoherent parts of the orbital spectra.Wohlfeld et al. (2011, 2012) Even broader features are expected for two-orbiton excitations, which will be discussed in Sec. IV.4.
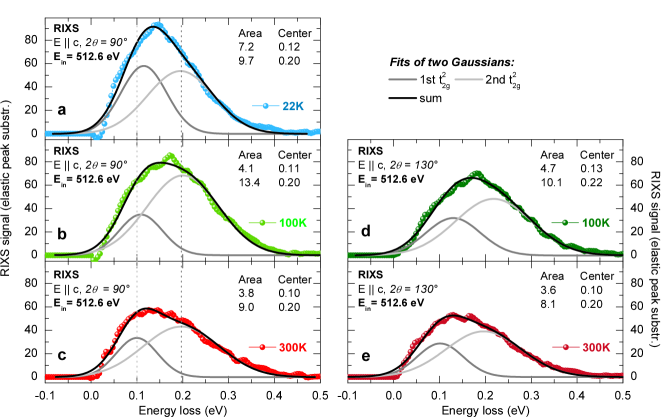
In the RIXS data, it is not possible to directly distinguish different contributions to the broad feature at 0.1 - 0.2 eV. However, there is an interesting dependence on at the V edge (see Fig. IV.3). The RIXS peak maximum is at 0.13 - 0.14 eV for = 517.1 eV, about 30 - 40 meV lower than for = 512.6 eV. This is valid both for = 90∘ and 130∘. At the same time, the inelastic peaks extend to about 0.4 eV for all data obtained at the V edge, irrespective of the shift of the peak maximum. This can be rationalized by assuming that the RIXS feature consists of two different peaks with spectral weights that depend on , similar to the overall behavior depicted in Fig. II. A strong dependence of the relative spectral weight of orbital excitations was observed also in RIXS on TiOCl.Glawion et al. (2011) We emphasize that it is possible to describe our RIXS data by two orbital excitations at 0.10 - 0.13 eV and 0.20 - 0.22 eV with Gaussian line shapes under the assumption that the spectral weights of these two excitations depend on , temperature, and momentum (see Fig. IV.3).
A two-peak scenario is supported not only by the LDA and first-principles results mentioned aboveDe Raychaudhury et al. (2007); Solovyev (2008) but also by the optical conductivity, showing these excitations with a higher energy resolution at about 0.20 eV and 0.26 eV.Benckiser et al. (2008) Subtracting a phonon shift of 50 - 80 meV from the optical results yields orbital excitation energies of 0.12 - 0.15 eV and 0.18 - 0.21 eV, in agreement with our analysis of the RIXS data (see Tab. 1).
The orbital excitation energies observed in RIXS agree with the expectations of a crystal-field scenario but are hard to reconcile with a pure superexchange scenario. The energy scale for superexchange interactions is given by = , where denotes the nearest-neighbor V-V hopping parameter and the on-site Coulomb repulsion 5 eV. The value of can been determined from, e.g., the spin-wave dispersion observed in inelastic neutron scattering.Ulrich et al. (2003) Note that sets the overall energy scale for a spin-orbital superexchange model but that the effective spin-exchange coupling constants and are smaller than , they depend on the orbital correlations and thus on the ground state (see, e.g., Fig. 4 in Ref. Oleś et al., 2007). Accordingly, different estimates have been givenUlrich et al. (2003); Oleś et al. (2007); Horsch et al. (2008) for the size of (0.02 - 0.04 eV). For , the dispersion of orbital excitations in the intermediate phase between 77 K and 116 K with -type spin order and -type orbital order is given byOleś et al. (2007)
| (1) |
with 0.13 and a gap of . The parameter depends on and on the crystal field and is explicitly given in Ref. Oleś et al., 2007. Neglecting the crystal field, one finds 1 and a maximum energy of orbital excitations of about 0.08 eV.Oleś et al. (2007) For = 40 meV, the different estimates of the crystal-field contribution yield orbital excitations with a gap of about 0.02 - 0.10 eV and a bandwidth of about 0.02 - 0.05 eV for YVO3. In comparison, the observed excitation energies of 0.1 - 0.2 eV are rather large and clearly indicate a significant contribution of the crystal field. We like to add that a superexchange scenario predicts a significantly reduced dispersion for the low-temperature phase below 77 K with -type spin order and -type orbital order.Ishihara (2004); Oleś et al. (2007) Also for the low-temperature phase, a finite dispersion is only expected for .
At first sight, a superexchange model seems to suggest an alternative scenario in which the lower peak at 0.1 eV corresponds to single-orbiton excitations and the upper one at 0.2 eV to a two-orbiton contribution, as discussed for the titanates.Ulrich et al. (2009); Ament and Khaliullin (2010) Here, one has to discuss the relationship between a single local orbital flip on a given transition-metal site (i.e., the RIXS final state at the V edge) and the number of orbitons that are excited. In a crystal-field scenario, flipping an orbital is equivalent to a single local crystal-field excitation. Two orbital flips on adjacent sites then correspond to two crystal-field excitations. This simple correspondence breaks down in a superexchange scenario, reflecting many-body physics and the quasiparticle character of the excitations. A local orbital flip has to be translated into the eigenstates of the bulk, i.e., into a superposition of one- and multi-orbiton excitations, similar to one- and multi-magnon contributions in case of a local spin flip.Haverkort (2010) However, a strong two-orbiton contribution at the transition-metal edge is only expected in case of strong orbital fluctuations.Ament and Khaliullin (2010) For YVO3, strong orbital fluctuations have been ruled out recently by optical data for the Mott-Hubbard excitations.Reul et al. (2012) Another argument against a two-orbiton interpretation of the peak at 0.2 eV is the observation of a two-orbiton peak at 0.4 eV in RIXS at the O edge (see Sec. IV.4) and in the optical conductivity.Benckiser et al. (2008) Finally, the temperature dependence of the peak energies is hard to explain in a scenario with dominant superexchange interactions, as discussed in the next paragraph. Therefore, a two-orbiton interpretation of the RIXS feature at 0.2 eV can be ruled out.
IV.3.2 Temperature dependence
The RIXS data for different temperatures resolve the dependence of the intra- excitations on the crystal structure in the different phases of YVO3 very well (see top panel of Fig. IV.3). From a phenomenological point of view, we may neglect the two-peak structure discussed above and consider solely the maximum of the experimental peak or its first moment, i.e., the center of mass of the inelastic spectrum. Both the maximum and the first moment show shifts of the order of 10 - 40 meV as a function of temperature. Similar shifts are obtained both from the fits using two Gaussians for the two-peak structure (see Fig. IV.3 and Tab. 1) and from the optical data.Benckiser et al. (2008) A shift of the excitation energy can be explained in a crystal-field scenario by a change of the crystal structure and thus of the crystal field, and in a superexchange-based scenario by a change of the orbital order.Oleś et al. (2007); Ishihara (2004) However, the orbital order changes dramatically between the different ordered phases and the orbitally disordered phase above 200 K, and orbital fluctuations are only weak above 200 K.Reul et al. (2012) Accordingly, spin-orbital superexchange models predict a significant change of the excitation energies across the phase transitions between the different phases.Ishihara (2004); Oleś et al. (2007) In contrast, the observed shifts of 10 - 40 meV are much smaller than the excitation energy of 0.1 - 0.2 eV. This clearly indicates that the excitation energy is not very sensitive to the details of the orbital order, pointing towards a dominant contribution of the crystal field. This is corroborated by the good agreement between the experimental data and the theoretical resultsDe Raychaudhury et al. (2007); Solovyev (2006, 2008); Otsuka and Imada (2006) for local crystal-field excitation energies and their temperature-induced relative shifts (see Tab. 1). Similar shifts of up to 40 meV as a function of temperature are observed for the spin-flip intra- excitation at 1.25 - 1.28 eV and for the excitations at 1.84 - 1.88 eV, see Fig. IV.1 and Tab. 1.
Not only the peak energy but also the spectral weight of the low-energy intra- excitations depends on temperature, being about 20 - 30% smaller at 300 K compared to 100 K for =512.6 eV (see Figs. IV.3 and IV.3) and =517.1 eV (see Fig. IV.1). This is surprising given that the spectral weight rather increases with temperature for all higher-lying excitations, as shown in Fig. IV.1. This particular behavior of the low-energy orbital excitations may be hard to understand in a pure crystal-field scenario.Ulrich et al. (2009)
IV.3.3 Dependence on scattering angle or momentum
The most obvious way to distinguish a local crystal-field excitation from a propagating orbiton is to study the dependence of the orbital excitation energies on the momentum . Theoretical calculations based on an effective spin-orbital superexchange model predict a significant dispersion (see Eq. (1)) with a bandwidth of up to 0.05 eV for orbital waves propagating along the axis of YVO3 in the intermediate phase with -type spin order and -type orbital order,Ishihara (2004); Oleś et al. (2007) i.e., for ferromagnetic alignment of spins along . Perpendicular to , the orbiton dispersion is strongly suppressed by the antiferromagnetic correlations which yield a strong renormalization of the orbiton dispersion in dimensions higher than one.Wohlfeld et al. (2011) Moreover, a superexchange scenario predicts no dispersion for within the plane if the orbital is occupied on every site,Oleś et al. (2007) which is typically assumed for YVO3. This feature is due to the directional hopping properties of orbitals, i.e., hopping between orbitals ( orbitals) is finite only along the direction ( direction) within the plane. This completely suppresses orbital quantum fluctuations in the plane.Oleś et al. (2007) The observed dispersion along the direction thus remains puzzling.
Experimentally, the dependence can be studied by varying the scattering angle . For small energy losses, the transferred momentum = is fully determined by the momentum of the incoming photon = and by the scattering angle . We have used = 90∘ and , which at = 512.6 eV corresponds to transferred momenta of = 0.3674 Å-1 and = 0.4709 Å-1, respectively. In the specular geometry of our measurement (see sketch in Fig. II), the transferred momentum points along the axis. With a lattice constant of = 5.273 Å,Blake et al. (2002) we find 62 % and 79 %.
From a phenomenological point of view, we may compare the first moment of the RIXS feature for = 90∘ and 130∘. At = 100 K, we find a shift of 13 meV with an estimated uncertainty of 5 meV for = 512.6 eV and 517.1 eV (see middle panel of Fig. IV.3). Remarkably, the same analysis in the orbitally disordered phase at 300 K yields a shift of 6 meV for = 512.6 eV but -4 meV for 517.1 eV, i.e., at 300 K the first moment is independent of the scattering angle within the error bars. Fitting two Gaussians for = 512.6 eV yields very similar results, i.e., no shift at 300 K (see Fig. IV.3 c e) and shifts of about 20 meV for both peaks at 100 K (see Fig. IV.3 b d). As discussed above, a bandwidth of 20 meV appears to be plausible for YVO3 with realistic parameters for the crystal field. However, a superexchange scenario predicts no dispersion for the upper peak and a finite dispersion of the lower peak only for , not for .
The RIXS feature at 0.1 - 0.2 eV is composed of at least two peaks, and the shift of 13 meV discussed above is much smaller than the line width. Therefore we have to consider an alternative scenario. A dependence of the transition matrix elementsUlrich et al. (2009) of the two different peaks may give rise to a dependence of the overall line shape (and thus of the first moment) via a transfer of the spectral weight between the two peaks around 0.1 eV and 0.2 eV. However, the data contain three arguments against this scenario: (i) The first moment is independent of within the error bars in the orbitally disordered phase at 300 K. (ii) Fits using two Gaussian peaks at 100 K yield a very similar shift of about 0.02 eV for both peaks. (iii) The -dependence of the spectral weight of the two Gaussian peaks is opposite to the expectations of such a scenario, i.e., the spectral weight of the lower (upper) peak increases (decreases) as the overall feature shifts to higher energy (see Fig. IV.3). This gives clear evidence that this alternative scenario of a transfer of spectral weight can be ruled out and supports the interpretation that the observed dependence on indeed reflects an intrinsic dependence, i.e., a finite dispersion of the low-energy orbital excitations for .
For comparison, we also determined the -dependence of the higher-lying RIXS peaks at 1.1-1.3 eV by fitting two Gaussian peaks to the data for = 517.1 eV, see Fig. IV.3.3. Note that these peaks have hardly any RIXS intensity for = 512.6 eV, see Fig. II. Thus far, a possible dispersion of these high-energy excitations has not been considered for the vanadates. The peak position of the well-pronounced lower peak at 1.07 eV with a width of about 0.13 eV does not depend on the scattering angle within the error bars. For the less intense, broader peak at 1.28 eV, we find that the peak position is about 15 meV higher for = 90∘ than for 130∘. However, this peak is much broader and shows less intensity, and the fits are affected by the noise level. Therefore, the error bars of the fitted peak position are larger, and we conclude that its position is independent of within the error bars.
IV.3.4 Summary of low-energy RIXS feature
Summarizing this section, we find evidence that neither a pure superexchange model nor a pure crystal-field scenario can explain our data. The peak energy of 0.1 - 0.2 eV and its rather small temperature dependence clearly point towards a significant or possibly even dominant contribution of the crystal field. The large line width indicates a vibronic coupling to phonons and possibly also the coupling to magnons. The temperature dependence of the intensity and in particular the finite dispersion strongly suggest that also superexchange interactions play an important role. We emphasize that our data show a finite dispersion for momentum , which is not expected in the superexchange models considered thus far.Ishihara (2004); Oleś et al. (2007) In order to quantify the individual contributions of the crystal field and of superexchange interactions both have to be considered on the same footing, which is a challenging task. The excitation spectrum is then dominated by an orbiton-phonon continuum.Schmidt et al. (2007) If we consider also the coupling to magnons,Wohlfeld et al. (2011, 2012) we have to expect an orbiton-magnon-phonon continuum. A finite dispersion of the orbital excitations is expected to reveal itself via a momentum-dependent line shape of this continuum.Schmidt et al. (2007) A detailed study of the dependence of the line shape remains a challenge to both theory and experiment.
IV.4 Two-orbiton peak at the O edge
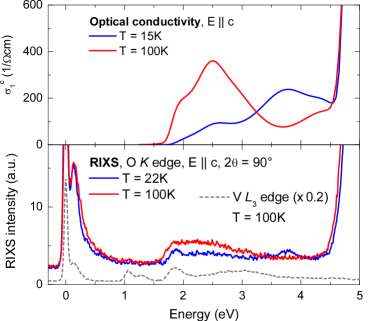
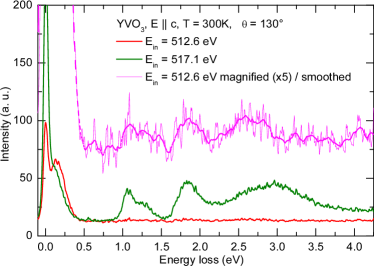
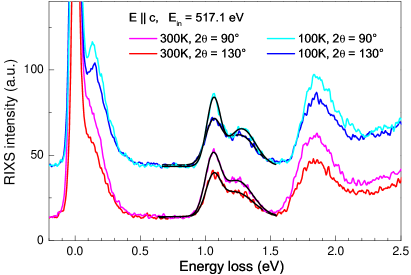
We propose that a more direct view on the relevance of intersite or superexchange interactions at present can be obtained from the RIXS data measured at the O edge, which differs in many respects from the edge data, see Figs. II and IV.4. The spin-flip excitations at 1.1 - 1.3 eV are absent (or very weak) due to the spin-selection rule, as discussed above. The low-energy RIXS feature with a peak at 0.1 -0.2 eV extends to much higher energies, see bottom panels of Figs. IV.3 and IV.4. Finally, also the peak positions above 1.5 eV are different. The very large intensity above 4.5 eV suggests x-ray fluorescence emission. We speculate that this strong feature above 4.5 eV corresponds to both fluorescence and charge-transfer excitations. This is based on the astounding overall agreement between the optical conductivityReul et al. (2012) and the RIXS data from the O edge (see Fig. IV.4): (i) the absorption edges of Mott-Hubbard excitations and of charge-transfer excitations are observed at about 1.7 eV and 4.5 eV, respectively, (ii) the dominant contribution is a broad feature peaking at about 2.5 eV, (iii) between 1.7 eV and 3.3 eV the spectral weight is smaller in the low-temperature phase, (iv) the peak at about 3.8 eV is present only in the low-temperature phase, and (v) both onset energies at about 1.7 eV and 4.5 eV show a similar temperature dependence. This gives clear evidence that RIXS at the O edge is sensitive to Mott-Hubbard and charge-transfer excitations, i.e., to intersite excitations.
Additionally, we expect to observe the spin-conserving orbital excitations discussed above for the V edge. In the optical conductivity, the spectral weight of orbital excitations is orders of magnitude smaller compared to the Mott-Hubbard and charge-transfer excitations shown in the top panel of Fig. IV.4. This explains that the pre-peak at about 1.9 eV is more pronounced in the RIXS data than in the optical conductivity, in particular in the low-temperature phase. RIXS at the O edge shows both the Mott-Hubbard excitations and the orbital excitation at about 1.8 - 1.9 eV (see Sec. IV.2). We emphasize that the RIXS intensity between 2.3 eV and 2.7 eV at the V edge was assigned to an ( = 0) excited state in Sec. IV.2. This excitation involves a spin flip and thus does not contribute to RIXS at the O edge, as shown above for the comparable excitations peaking at 1.1 - 1.3 eV. This strongly corroborates that the broad peak at 2.5 eV at the O edge corresponds to Mott-Hubbard excitations and not to orbital excitations.
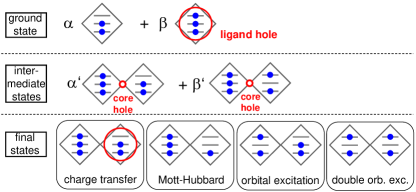
RIXS at the O edge has not been studied very much thus far. It is known to be sensitive to both orbital (or -) excitations and to intersite charge-transfer excitations.Ament et al. (2011); Duda et al. (2000); Harada et al. (2002); Okada and Kotani (2006); Duda et al. (2006); Guarise et al. (2010); Bisogni et al. (2012); Monney et al. (2013) To the best of our knowledge, this is the first report on the observation of Mott-Hubbard excitations in RIXS at the O edge. The differences between the RIXS data from the O edge and from the V edge originate from the different microscopic excitation processes. In both cases, the incoming x-ray photon excites a core electron into the upper Hubbard band. At an O site, this is possible due to the hybridization between V and O states. In a local picture for a single VO6 octahedron, the ground state can be described by — + — L with = 1, where L denotes a ligand O hole (see top panel of Fig. IV.4). The incoming x-ray thus may promote the ligand O hole to an O core hole at one particular O site which connects two octahedra. This yields an intermediate state — with a V state in the upper Hubbard band, where and refer to the two V sites (see middle panel of Fig. IV.4). The system relaxes by filling the core hole with a valence electron, which may yield different low-energy excited states, see bottom panel of Fig. IV.4. The final state corresponds to a charge-transfer excitation L if the core hole is filled by an O electron from below the Fermi energy, i.e., the final state shows both an O hole below the Fermi energy and a state within the upper Hubbard band. Similarly, a Mott-Hubbard excitation results if the valence electron is taken from the lower Hubbard band, i.e., L, which again is possible due to the - hybridization expressed by the second term. Alternatively, an orbital excitation is created if the core hole is filled by an electron from the upper Hubbard band, similar to the dominant mechanism at the V edge.
Our data were measured with linearly polarized incident x-rays with . The dipole selection rule states that the initial excitation from O to O involves a hole with character. For this hole, the - hybridization is different for V-O-V bonds along or within . Along , O shows a strong hybridization with the V orbital with symmetry. Within , O hybridizes with V orbitals with and symmetry. Therefore, V-O-V bonds along and within certainly show different contributions to our O RIXS data measured with . However, a quantitative statement requires a much more thorough theoretical investigation of the microscopic processes.
Most interesting to us is the possibility to create two orbital excitations simultaneously. In the literature, the excitation of two orbitons has been calculated for RIXS at the transition-metal and edges with a focus on manganites and titanates.Ishihara and Maekawa (2000); Forte et al. (2008); Ament and Khaliullin (2010) Two different mechanisms have been described. In the intermediate state, the core hole may ‘shake up’ the valence electrons on the transition metal site, giving rise to, e.g., a single orbital flip. This state has to be translated into the eigenstates of the bulk, e.g., a local crystal-field excitation or a single (or multi-) orbiton. Alternatively, the core hole may modulate the superexchange, giving rise to two orbital flips on adjacent sites. Similarly we expect for RIXS at the O edge that the O core hole modulates the V-O-V intersite superexchange and ‘shakes up’ the valence electrons. Therefore, the intermediate state may evolve from ; ; to , which may decay to a final state with two orbital excitations, , see Fig. IV.4. We expect that the sensitivity to such double orbital excitations is enhanced at the O edge because the excitation occurs at an O site connecting two V sites, and due to hybridization the intermediate state extends over a V-O-V bond. At the V edge, the intermediate state is much more localized on a single V site due to the strong interaction with the V core hole. This is supported by our observation of Mott-Hubbard excitations at the O edge at 2.5 eV, which clearly demonstrates the sensitivity to intersite excitations. Moreover, similar intersite excitations have been reported for RIXS at the O edge of insulating late transition-metal oxides. In NiO, a double spin flip has been observed on neighboring sites,Duda et al. (2006) and the excitation of two magnons has been discussed for insulating parent compounds of the high- cuprates.Harada et al. (2002); Guarise et al. (2010); Bisogni et al. (2012) Similar to our case, the two-magnon feature in the cuprates can be revealed by comparison of RIXS at the Cu edge and the O edge.Guarise et al. (2010); Bisogni et al. (2012)
In the optical data, a peak at 0.4 eV for in the intermediate monoclinic phase (see top panel in Fig. IV.4, right axis) has been interpreted as a two-orbiton excitation, i.e., an exchange of orbitals between two neighboring V sites along the axis.Benckiser et al. (2008) This is equivalent to a double orbital flip, i.e., from the orbital to the orbital on one site and vice versa on a neighboring site.
The RIXS spectra for = 530.1 eV in the bottom panels of Figs. IV.3 and IV.4 indeed reveal an additional contribution at the O edge, which extends up to about 0.9 eV, roughly twice the cut-off of the single orbital excitations. After subtracting an estimate of the single orbital excitations, the O edge data show a peak at about 0.4 eV (see Fig. IV.4), in good agreement with the optical data. We stress that only orbital excitations can be expected in this energy range in YVO3. As discussed above, phonons and magnons are relevant below 0.1 eV only, and the Mott-Hubbard gap is larger than 1 eV.Benckiser et al. (2008) The RIXS data at the V edge clearly demonstrate that the single orbital excitations are located at 0.10 - 0.22 eV for all temperatures measured here, and the data from the O edge strongly corroborate the existence of the two-orbiton excitation. Together, RIXS and optics provide strong evidence for the two-orbiton interpretation of the feature at 0.4 eV, demonstrating the relevance of orbital exchange processes in YVO3.
V Summary and Conclusion
In conclusion, we have reported high-resolution RIXS results at the V edge of YVO3 which reveal the orbital excitations with unprecedented quality. By comparison with optical data,Benckiser et al. (2008) peaks at 0.1 - 0.2 eV, 1.07 eV, 1.28 eV, 1.86 eV, and between 2.2 eV and 3.5 eV unambiguously can be identified as orbital excitations. Orbital excitations to final states with either = 1 or = 0 are very well resolved, demonstrating the superior capability of high-resolution RIXS for the study of orbital excitations. The lowest orbital excitations at 0.1 - 0.2 eV correspond to spin-conserving intra- excitations. The excitation energy, its small temperature dependence, and the large line width indicate a large contribution of the crystal field. This low-energy RIXS feature can be decomposed into two different contributions at 0.1 eV and 0.2 eV, respectively, which is supported by the dependence of line shape and peak energy on the incident energy. Most remarkably these low-energy excitations show a shift of about 13 - 20 meV as a function of the scattering angle. We argue that this reflects a finite dispersion of orbital excitations for . However, the shifts are much smaller than the line width and the superexchange models studied thus far do not predict any dispersion for . Therefore, we cannot disentangle quantitatively the contributions from superexchange and from the crystal field at this stage and call for further theoretical investigations of the low-energy orbital excitations in systems. In particular, the microscopic mechanism for a dispersion for needs to be understood.
RIXS at the O edge is more sensitive to intersite excitations such as charge-transfer excitations or excitations across the Mott-Hubbard gap. In particular, we find an additional contribution to the RIXS signal which peaks at about 0.4 eV. We interpret this feature as a two-orbiton excitation, i.e., an exchange of orbitals on adjacent sites, in agreement with optical results.Benckiser et al. (2008) A quantitative description of the low-energy orbital excitations in YVO3 will have to consider both superexchange interactions and the coupling to the lattice.
ACKNOWLEDGEMENT
The XAS and RIXS measurements were performed at the ADRESS beamline of the Swiss Light Source using the SAXES instrument jointly built by Paul Scherrer Institut (Switzerland), Politecnico di Milano (Italy), and École polytechnique fédérale de Lausanne (Switzerland). The authors thank N. Hollmann, L.-H. Tjeng, and L. Braicovich for fruitful discussions. This work was supported by the DFG via SFB 608 and partially by the U.S. Department of Energy, Office of Basic Energy Sciences, Division of Materials Science and Engineering, under Contract No. DE-AC02-76SF00515 and by the Alexander von Humboldt Foundation.
VI Appendix
Crystal-field excitations of V3+ ions in DySc0.9V0.1O3
Above 1.6 eV, orbital or - excitations cannot be detected by optical spectroscopy on YVO3 because they are masked by the much larger spectral weight of excitations across the Mott-Hubbard gap.Benckiser et al. (2008) As an alternative, we have chosen to study the orbital excitations of single V3+ ions substituted into DyScO3, which is isostructural to YVO3. Due to the similarity of the ionic radii, the crystal field on the V site is expected to be very similar in DySc0.9V0.1O3 and YVO3. At the same time, the band gap is much larger in DyScO3 than in YVO3, which allows us to study the excitations. Moreover, Sc3+ has a electron configuration, thus all orbital excitations of DySc0.9V0.1O3 can be attributed to Dy - or V - excitations. The Dy - excitations are well studied,Henderson and Imbusch (1989) the peaks observed in our DyScO3 data are indeed typical.Benckiser (2007) In particular, one does not expect any Dy - excitations between about 1.7 and 2.6 eV. The V - excitations can be identified by comparing DySc0.9V0.1O3 with DyScO3.
Single crystals have been grown by the traveling-solvent floating-zone method. The purity and single-phase structure of the crystals was confirmed by powder and single-crystal x-ray diffraction at room temperature. Both compounds adopt the space group and have similar lattice constants and V-O bond lengths as RVO3. Typical dimensions of the as-grown rods are a few millimeter along all three crystallographic axes. The sample of DyScO3 is transparent yellow, whereas the sample of DySc0.9V0.1O3 is opaque and dark-green. For the transmittance measurements, we cut samples of DyScO3 with [100] orientation and of DySc0.9V0.1O3 with [001] orientation (both with the axis in-plane). These were polished to a thickness of 730 10 m in case of DyScO3 and 1312 10 m in case of DySc0.9V0.1O3. Transmittance measurements were performed between 0.1 and 3.0 eV with linearly polarized light using a Fourier spectrometer.
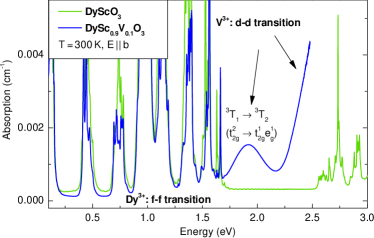
In Fig. VI we show the optical absorption , where denotes the measured transmittance. At 300 K, the absorption band of V3+ in DySc0.9V0.1O3 (excitation to in cubic notation) is observed at 1.92 eV. Subtracting a phonon shift of 50 - 80 meV yields 1.84 - 1.87 eV for the excitations, in excellent agreement with the RIXS data peaking at 1.84 eV (see Fig. IV.1 and Tab. 1). Observation of the lower-lying V3+ intra- transitions is impossible because of the superposition with the predominant - transitions. Finally, the strong increase of absorption of DySc0.9V0.1O3 above 2.2 eV (see Fig. VI) is attributed to higher-lying excitations, again in excellent agreement with RIXS.
References
- Tokura and Nagaosa (2000) Y. Tokura and N. Nagaosa, Science 288, 462 (2000).
- Kugel and Khomskii (1973) K. I. Kugel and D. I. Khomskii, Sov. Phys. JETP 37, 725 (1973).
- Ulrich et al. (2003) C. Ulrich, G. Khaliullin, J. Sirker, M. Reehuis, M. Ohl, S. Miyasaka, Y. Tokura, and B. Keimer, Phys. Rev. Lett. 91, 257202 (2003).
- Sirker and Khaliullin (2003) J. Sirker and G. Khaliullin, Phys. Rev. B 67, 100408 (2003).
- Horsch et al. (2003) P. Horsch, G. Khaliullin, and A. M. Oleś, Phys. Rev. Lett. 91, 257203 (2003).
- Khaliullin (2005) G. Khaliullin, Progress of Theoretical Physics Supplement 160, 155 (2005).
- Ishihara and Maekawa (2000) S. Ishihara and S. Maekawa, Phys. Rev. B 62, 2338 (2000).
- Jahn and Teller (1937) H. Jahn and E. Teller, Proceedings of the Royal Society of London Series A - Mathematical and Physical Science 161, 220 (1937).
- van den Brink (2001) J. van den Brink, Phys. Rev. Lett. 87, 217202 (2001).
- Schmidt et al. (2007) K. P. Schmidt, M. Grüninger, and G. S. Uhrig, Phys. Rev. B 76, 075108 (2007).
- Krivenko (2012) S. Krivenko, Phys. Rev. B 85, 064406 (2012).
- Horsch et al. (2008) P. Horsch, A. M. Oleś, L. F. Feiner, and G. Khaliullin, Phys. Rev. Lett. 100, 167205 (2008).
- Saitoh et al. (2001) E. Saitoh, S. Okamoto, K. Takahashi, K. Tobe, K. Yamamoto, T. Kimura, S. Ishihara, S. Maekawa, and Y. Tokura, Nature 410, 180 (2001).
- Miyasaka et al. (2005) S. Miyasaka, S. Onoda, Y. Okimoto, J. Fujioka, M. Iwama, N. Nagaosa, and Y. Tokura, Phys. Rev. Lett. 94, 076405 (2005).
- Miyasaka et al. (2006) S. Miyasaka, J. Fujioka, M. Iwama, Y. Okimoto, and Y. Tokura, Phys. Rev. B 73, 224436 (2006).
- Sugai and Hirota (2006) S. Sugai and K. Hirota, Phys. Rev. B 73, 020409 (2006).
- Ulrich et al. (2006) C. Ulrich, A. Gössling, M. Grüninger, M. Guennou, H. Roth, M. Cwik, T. Lorenz, G. Khaliullin, and B. Keimer, Phys. Rev. Lett. 97, 157401 (2006).
- Grüninger et al. (2002) M. Grüninger, R. Rückamp, M. Windt, P. Reutler, C. Zobel, T. Lorenz, A. Freimuth, and A. Revcolevschi, Nature 418, 39 (2002).
- Rückamp et al. (2005) R. Rückamp, E. Benckiser, M. W. Haverkort, H. Roth, T. Lorenz, A. Freimuth, L. Jongen, A. Möller, G. Meyer, P. Reutler, B. Büchner, A. Revcolevschi, S.-W. Cheong, C. Sekar, G. Krabbes, and M. Grüninger, New Journal of Physics 7, 144 (2005).
- Iliev et al. (2007) M. N. Iliev, V. G. Hadjiev, A. P. Litvinchuk, F. Yen, Y.-Q. Wang, Y. Y. Sun, S. Jandl, J. Laverdière, V. N. Popov, and M. M. Gospodinov, Phys. Rev. B 75, 064303 (2007).
- Benckiser et al. (2008) E. Benckiser, R. Rückamp, T. Möller, T. Taetz, A. Möller, A. A. Nugroho, T. T. M. Palstra, G. S. Uhrig, and M. Grüninger, New Journal of Physics 10, 053027 (2008).
- Jandl et al. (2010) S. Jandl, A. A. Nugroho, and T. T. M. Palstra, J. Phys.: Conf. Ser. 200, 032025 (2010).
- Kovaleva et al. (2004) N. N. Kovaleva, A. V. Boris, C. Bernhard, A. Kulakov, A. Pimenov, A. M. Balbashov, G. Khaliullin, and B. Keimer, Phys. Rev. Lett. 93, 147204 (2004).
- Gössling et al. (2008) A. Gössling, M. W. Haverkort, M. Benomar, H. Wu, D. Senff, T. Möller, M. Braden, J. A. Mydosh, and M. Grüninger, Phys. Rev. B 77, 035109 (2008).
- Wohlfeld et al. (2011) K. Wohlfeld, M. Daghofer, S. Nishimoto, G. Khaliullin, and J. van den Brink, Phys. Rev. Lett. 107, 147201 (2011).
- Schlappa et al. (2012) J. Schlappa, K. Wohlfeld, K. J. Zhou, M. Mourigal, M. W. Haverkort, V. N. Strocov, L. Hozoi, C. Monney, S. Nishimoto, S. Singh, A. Revcolevschi, J.-S. Caux, L. Patthey, H. M. Ronnow, J. van den Brink, and T. Schmitt, Nature 485, 82 (2012).
- De Raychaudhury et al. (2007) M. De Raychaudhury, E. Pavarini, and O. K. Andersen, Phys. Rev. Lett. 99, 126402 (2007).
- Ishihara (2004) S. Ishihara, Phys. Rev. B 69, 075118 (2004).
- Khaliullin et al. (2001) G. Khaliullin, P. Horsch, and A. M. Oleś, Phys. Rev. Lett. 86, 3879 (2001).
- Reul et al. (2012) J. Reul, A. A. Nugroho, T. T. M. Palstra, and M. Grüninger, Phys. Rev. B 86, 125128 (2012).
- Ulrich et al. (2009) C. Ulrich, L. J. P. Ament, G. Ghiringhelli, L. Braicovich, M. M. Sala, N. Pezzotta, T. Schmitt, G. Khaliullin, J. van den Brink, H. Roth, T. Lorenz, and B. Keimer, Phys. Rev. Lett. 103, 107205 (2009).
- Ament and Khaliullin (2010) L. J. P. Ament and G. Khaliullin, Phys. Rev. B 81, 125118 (2010).
- Ulrich et al. (2008) C. Ulrich, G. Ghiringhelli, A. Piazzalunga, L. Braicovich, N. B. Brookes, H. Roth, T. Lorenz, and B. Keimer, Phys. Rev. B 77, 113102 (2008).
- Schmitt et al. (2002) T. Schmitt, L.-C. Duda, A. Augustsson, J.-H. Guo, J. Nordgren, J. E. Downes, C. McGuinness, K. E. Smith, G. Dhalenne, A. Revcolevschi, M. Klemm, and S. Horn, Surface Review and Letters 09, 1369 (2002).
- Schmitt et al. (2004a) T. Schmitt, L.-C. Duda, M. Matsubara, M. Mattesini, M. Klemm, A. Augustsson, J.-H. Guo, T. Uozumi, S. Horn, R. Ahuja, A. Kotani, and J. Nordgren, Phys. Rev. B 69, 125103 (2004a).
- Schmitt et al. (2004b) T. Schmitt, L.-C. Duda, M. Matsubara, A. Augustsson, F. Trif, J.-H. Guo, L. Gridneva, T. Uozumi, A. Kotani, and J. Nordgren, Journal of Alloys and Compounds 362, 143 (2004b).
- Ghiringhelli et al. (2004) G. Ghiringhelli, N. B. Brookes, E. Annese, H. Berger, C. Dallera, M. Grioni, L. Perfetti, A. Tagliaferri, and L. Braicovich, Phys. Rev. Lett. 92, 117406 (2004).
- Chiuzbăian et al. (2005) S. G. Chiuzbăian, G. Ghiringhelli, C. Dallera, M. Grioni, P. Amann, X. Wang, L. Braicovich, and L. Patthey, Phys. Rev. Lett. 95, 197402 (2005).
- Ghiringhelli et al. (2006a) G. Ghiringhelli, M. Matsubara, C. Dallera, F. Fracassi, A. Tagliaferri, N. B. Brookes, A. Kotani, and L. Braicovich, Phys. Rev. B 73, 035111 (2006a).
- Duda et al. (2006) L.-C. Duda, T. Schmitt, M. Magnuson, J. Forsberg, A. Olsson, J. Nordgren, K. Okada, and A. Kotani, Phys. Rev. Lett. 96, 067402 (2006).
- Braicovich et al. (2007) L. Braicovich, G. Ghiringhelli, L. H. Tjeng, V. Bisogni, C. Dallera, A. Piazzalunga, W. Reichelt, and N. B. Brookes, Phys. Rev. B 76, 125105 (2007).
- Hague et al. (2008) C. F. Hague, J.-M. Mariot, V. Ilakovac, R. Delaunay, M. Marsi, M. Sacchi, J.-P. Rueff, and W. Felsch, Phys. Rev. B 77, 045132 (2008).
- Forte et al. (2008) F. Forte, L. J. P. Ament, and J. van den Brink, Phys. Rev. Lett. 101, 106406 (2008).
- Ament et al. (2011) L. J. P. Ament, M. van Veenendaal, T. P. Devereaux, J. P. Hill, and J. van den Brink, Rev. Mod. Phys. 83, 705 (2011).
- Marra et al. (2012) P. Marra, K. Wohlfeld, and J. van den Brink, Phys. Rev. Lett. 109, 117401 (2012).
- Blake et al. (2002) G. R. Blake, T. T. M. Palstra, Y. Ren, A. A. Nugroho, and A. A. Menovsky, Phys. Rev. B 65, 174112 (2002).
- Strocov et al. (2010) V. N. Strocov, T. Schmitt, U. Flechsig, T. Schmidt, A. Imhof, Q. Chen, J. Raabe, R. Betemps, D. Zimoch, J. Krempasky, X. Wang, M. Grioni, A. Piazzalunga, and L. Patthey, Journal of Synchrotron Radiation 17, 631 (2010).
- Ghiringhelli et al. (2006b) G. Ghiringhelli, A. Piazzalunga, C. Dallera, G. Trezzi, L. Braicovich, T. Schmitt, V. N. Strocov, R. Betemps, L. Patthey, X. Wang, and M. Grioni, Review of Scientific Instruments 77, 113108 (2006b).
- Pen et al. (1999) H. F. Pen, M. Abbate, A. Fujimori, Y. Tokura, H. Eisaki, S. Uchida, and G. A. Sawatzky, Phys. Rev. B 59, 7422 (1999).
- Park et al. (2000) J.-H. Park, L. H. Tjeng, A. Tanaka, J. W. Allen, C. T. Chen, P. Metcalf, J. M. Honig, F. M. F. de Groot, and G. A. Sawatzky, Phys. Rev. B 61, 11506 (2000).
- Miyasaka et al. (2002) S. Miyasaka, Y. Okimoto, and Y. Tokura, Journal of the Physical Society of Japan 71, 2086 (2002).
- Mossanek et al. (2009) R. J. O. Mossanek, M. Abbate, P. T. Fonseca, A. Fujimori, H. Eisaki, S. Uchida, and Y. Tokura, Phys. Rev. B 80, 195107 (2009).
- Reehuis et al. (2006) M. Reehuis, C. Ulrich, P. Pattison, B. Ouladdiaf, M. C. Rheinstädter, M. Ohl, L. P. Regnault, M. Miyasaka, Y. Tokura, and B. Keimer, Phys. Rev. B 73, 094440 (2006).
- Solovyev (2006) I. V. Solovyev, Phys. Rev. B 74, 054412 (2006).
- Solovyev (2008) I. V. Solovyev, Journal of Physics: Condensed Matter 20, 293201 (2008).
- Otsuka and Imada (2006) Y. Otsuka and M. Imada, Journal of the Physical Society of Japan 75, 124707 (2006).
- Sugano et al. (1970) S. Sugano, Y. Tanabe, and H. Kamimura, Multiplets of Transition-Metal Ions in Crystals (New York: Academic Press, 1970).
- Hollmann (2011) N. Hollmann, Local Magnetism and Orbital Occupation in Novel Transition Metal Oxides, Ph.D. thesis, University of Cologne (2011).
- Benckiser (2007) E. Benckiser, Optical Spectroscopy of Orbital and Magnetic Excitations in Vanadates and Cuprates, Ph.D. thesis, University of Cologne (2007), urn:nbn:de:hbz:38-24351.
- Ghiringhelli et al. (2005) G. Ghiringhelli, M. Matsubara, C. Dallera, F. Fracassi, R. Gusmeroli, A. Piazzalunga, A. Tagliaferri, N. B. Brookes, A. Kotani, and L. Braicovich, Journal of Physics: Condensed Matter 17, 5397 (2005).
- Tsvetkov et al. (2004) A. A. Tsvetkov, F. P. Mena, P. H. M. van Loosdrecht, D. van der Marel, Y. Ren, A. A. Nugroho, A. A. Menovsky, I. S. Elfimov, and G. A. Sawatzky, Phys. Rev. B 69, 075110 (2004).
- Zaanen and Sawatzky (1990) J. Zaanen and G. Sawatzky, Journal of Solid State Chemistry 88, 8 (1990).
- Mizokawa and Fujimori (1996) T. Mizokawa and A. Fujimori, Phys. Rev. B 54, 5368 (1996).
- Dong-ping et al. (1997) Ma Dong-ping, Ma Xiao-dong, Chen Ju-rong, and Liu Yan-yun, Phys. Rev. B 56, 1780 (1997).
- de Groot et al. (1998) F. M. F. de Groot, P. Kuiper, and G. A. Sawatzky, Phys. Rev. B 57, 14584 (1998).
- Ghiringhelli et al. (2009) G. Ghiringhelli, A. Piazzalunga, C. Dallera, T. Schmitt, V. N. Strocov, J. Schlappa, L. Patthey, X. Wang, H. Berger, and M. Grioni, Phys. Rev. Lett. 102, 027401 (2009).
- Figgis and Hitchman (2000) B. N. Figgis and M. A. Hitchman, Ligand Field Theory and Its Applications (New York: Wiley-VCH, 2000).
- Ishii et al. (2002) T. Ishii, K. Ogasawara, and H. Adachi, The Journal of Chemical Physics 116, 471 (2002).
- Henderson and Imbusch (1989) B. Henderson and G. F. Imbusch, Optical Spectroscopy of Inorganic Solids (Clarendon Press, Oxford, 1989).
- Oleś et al. (2007) A. M. Oleś, P. Horsch, and G. Khaliullin, Phys. Rev. B 75, 184434 (2007).
- Wohlfeld et al. (2012) K. Wohlfeld, M. Daghofer, G. Khaliullin, and J. van den Brink, Journal of Physics: Conference Series 391, 012168 (2012).
- Glawion et al. (2011) S. Glawion, J. Heidler, M. W. Haverkort, L. C. Duda, T. Schmitt, V. N. Strocov, C. Monney, K. J. Zhou, A. Ruff, M. Sing, and R. Claessen, Phys. Rev. Lett. 107, 107402 (2011).
- Haverkort (2010) M. W. Haverkort, Phys. Rev. Lett. 105, 167404 (2010).
- Duda et al. (2000) L.-C. Duda, J. Downes, C. McGuinness, T. Schmitt, A. Augustsson, K. E. Smith, G. Dhalenne, and A. Revcolevschi, Phys. Rev. B 61, 4186 (2000).
- Harada et al. (2002) Y. Harada, K. Okada, R. Eguchi, A. Kotani, H. Takagi, T. Takeuchi, and S. Shin, Phys. Rev. B 66, 165104 (2002).
- Okada and Kotani (2006) K. Okada and A. Kotani, Journal of the Physical Society of Japan 75, 044702 (2006).
- Guarise et al. (2010) M. Guarise, B. Dalla Piazza, M. Moretti Sala, G. Ghiringhelli, L. Braicovich, H. Berger, J. N. Hancock, D. van der Marel, T. Schmitt, V. N. Strocov, L. J. P. Ament, J. van den Brink, P.-H. Lin, P. Xu, H. M. Rønnow, and M. Grioni, Phys. Rev. Lett. 105, 157006 (2010).
- Bisogni et al. (2012) V. Bisogni, L. Simonelli, L. J. P. Ament, F. Forte, M. Moretti Sala, M. Minola, S. Huotari, J. van den Brink, G. Ghiringhelli, N. B. Brookes, and L. Braicovich, Phys. Rev. B 85, 214527 (2012).
- Monney et al. (2013) C. Monney, V. Bisogni, K.-J. Zhou, R. Kraus, V. N. Strocov, G. Behr, J. Málek, R. Kuzian, S.-L. Drechsler, S. Johnston, A. Revcolevschi, B. Büchner, H. M. Rønnow, J. van den Brink, J. Geck, and T. Schmitt, Phys. Rev. Lett. 110, 087403 (2013).