Variable neutron star free precession in Hercules X-1 from evolution of RXTE X-ray pulse profiles with phase of the 35-day cycle
Abstract
Accretion of matter onto the surface of a freely precessing neutron star with a complex non-dipole magnetic field can explain the change of X-ray pulse profiles of Her X-1 observed by RXTE with the phase of the 35-day cycle. We demonstrate this using all available measurements of X-ray pulse profiles in the 9-13 keV energy range obtained with the RXTE/PCA. The measured profiles guided the elaboration of a geometrical model and the definition of locations of emitting poles, arcs, and spots on the NS surface which satisfactorily reproduce the observed pulse profiles and their dependence on free precession phase. We have found that the observed trend of the times of the 35-day turn-ons on the O-C diagram, which can be approximated by a collection of consecutive linear segments around the mean value, can be described by our model by assuming a variable free precession period, with a fractional period change of about a few percent. Under this assumption and using our model, we have found that the times of phase zero of the neutron star free precession (which we identify with the maximum separation of the brightest spot on the neutron star surface with the NS spin axis) occur about 1.6 days after the the mean turn-on times inside each ’stable’ epoch, producing a linear trend on the O-C diagram with the same slope as the observed times of turn-ons. We propose that the 2.5% changes in the free precession period that occur on time scales of several to tens of 35-day cycles can be related to wandering of the principal inertia axis of the NS body due to variations in the patterns of accretion onto the NS surface. The closeness of periods of the disk precession and the NS free precession can be explained by the presence of a synchronization mechanism in the system, which modulates the dynamical interaction of the gas streams and the accretion disk with the NS free precession period.
keywords:
accretion - pulsars:general - X-rays:binaries1 Introduction
The X-ray pulsar Her X-1 is an accreting neutron star (NS) with a spin period of s in a 1.7-day orbit around 1.8-2 star (Tananbaum et al., 1972). Since its discovery in 1972 by the UHURU satellite, the detailed nature of the source has been a subject of intensive studies, primarily because of its very complex time behavior.
The long-term X-ray light curve of Her X-1 is modulated with a -day period. The cycle includes the main-on state with an average duration of days and the secondary (short-on) state of smaller intensity which lasts days. Most 35-d cycles last for about 20, 20.5, or 21 orbital cycles; see (Staubert et al., 1983; Shakura et al., 1998). These two on-states are separated by time intervals with a duration of about four orbital periods during which the X-ray flux almost vanishes. These changes, as well as spectral measurements from the RXTE satellite (Kuster et al., 2005), clearly indicate the eclipse of the X-ray source by a precessing accretion disk.
The 35-day cycle in Her X-1 is generally interpreted to be a manifestation of the precession motion of the accretion disk around the NS in the retrograde orbital direction (Gerend & Boynton, 1976; Shakura et al., 1999). Soon after the discovery of this X-ray pulsar it was proposed that free precession of the NS can also be responsible for the observed long-term modulation of the X-ray flux (Brecher, 1972). Later, Trümper et al. (1986) had interpreted the evolution of the X-ray pulse profile shape with the phase of the 35-day cycle as observed by EXOSAT as due to the free precession of the NS in Her X-1.
One of the observed properties of the 35-d cycle in Her X-1 is its turn-ons occurring predominantly around orbital phases or 0.7 (see, however, the recent debate in Leahy & Igna (2010) based on the analysis of the RXTE ASM data). This feature can be explained by tidal nutation motion of outer parts of the accretion disk at about double orbital frequency (Katz et al., 1982; Levine & Jernigan, 1982; Boynton, 1987), as at these orbital phases the disk inclination angle to the line of sight changes most rapidly (see also (Klochkov et al., 2006)).
Immediately after the beginning of active studies of Her X-1 it became clear that the tilted accretion disk in this binary system must have a twisted form. During the retrograde precession, the outer parts of such a disk open the view to the central X-ray source (the turn-on of the source), and the inner parts of the disk cover it at the end of the main-on (Boynton, 1987). The ingress and egress to and from the two 35-day low states are asymmetric due to scattering of X-ray emission by the hot rarefied corona above the disk. Indeed, the opening of the X-ray source at the beginning of the main-on is observed to be accompanied by significant changes in the soft X-ray band suggesting strong absorption (Becker et al., 1977; Davison & Fabian, 1977; Parmar et al., 1980; Kuster et al., 2005).
The change of X-ray pulse profiles with the 35-d phase is a well-established property of Her X-1 and has been observed by various satellites (see e.g. Trümper et al. (1986); Deeter et al. (1998); Scott et al. (2000); Staubert et al. (2013)). In the present paper we show that the changes in X-ray pulse profiles observed by RXTE/PCA in the 9-13 keV range with 35-d phase can be explained by a model which assumes a freely precessing neutron star with complex surface magnetic field structure. In addition to the canonical magnetic poles (of a dipole field), bright arc-like or quasi-circular structures must be present around the poles. As was first considered in Shakura et al. (1991); Panchenko & Postnov (1994), to form such structures around the poles, the magnetic field of NS must have substantially non-dipole structure. The appearance of complex emitting regions on the surface of an accreting NS with non-dipole magnetic field was confirmed by detailed numerical 3D MHD simulations (Long et al. (2008, 2012)).
Due to the free precession, the emitting regions on the NS surface change location with respect to the line of sight leading to gradual change of X-ray profiles with the 35-d cycle phase. More rapid changes in pulse profiles (which are observed at the end of the main-on state) can be additionally caused by the eclipse of the NS surface by the inner parts of the disk. At low states (when the X-ray source is hidden behind the accretion disk), only a sine-line component (mostly pronounced in soft X-rays) due to reflection of X-ray emission of the NS by the inner warped parts of the twisted accretion disk remains.
We also show that in our model the times of phase zero of the NS precession (defined by the maximum angle between the brightest spot on the NS surface and the NS angular momentum vector), as derived from modeling of pulse profiles in individual 35-day cycles, make straight line segments on the O-C diagram, which closely follow the shape of the turn-ons of the source, suggesting the presence of a stable clock over periods up to several tens of 35-day cycles.
The change in slope of the linear segments in the O-C diagram implies a variable free precession period with a fractional period change . The possible reason for the free precession period variations is the corresponding change in angle between the principal axis of inertia of the neutron star body and the total angular momentum during the accretion of matter onto the NS with complex surface magnetic field.
2 Physical motivation
2.1 Previous works
The apparent change of X-ray pulse profiles with 35-day cycle has been previously addressed in several papers. Trümper et al. (1986) discussed change of pulse profiles in the main-on and short-on states observed by EXOSAT in terms of the neutron star free precession. Later, however, the free precession model was questioned. For example, Bisnovatyi-Kogan et al. (1989) argued that the model of a freely precessing neutron star approximated by a Maclaurin spheroid of rotation, with the geometrical parameters of (symmetric) dipole magnetic field as derived from EXOSAT observations, is unable to explain the observed X-ray pulse profile evolution. They proposed the model of a progradely precessing accretion disk with the inner radius at NS radii around a NS with rather low surface magnetic field of - G. In this model, the pulse profile is shaped by the inner disk eclipsing a broad emission region on the NS surface. To explain difference in pulse profiles between the main-on and short-on states of the source observed by EXOSAT, Petterson, Rothschild & Gruber (1991) proposed an alternative qualitative model. In their model, the inner radius of the retrogradely precessing accretion disk around non-precessing neutron star was assumed to circulate synchronously with the neutron star rotation (1.24 s) and to be partially responsible for the observed changes in the pulse profiles. The complex pulse shape in the main-on state was, however, attributed to the complex radiation transfer in the accretion column. The main concern about the free precession model advocated by Trümper et al. (1986) was the secular alignment of the spin axis of the accreting NS with the orbital angular momentum. Later, Scott et al. (2000) analyzed the Ginga observations of Her X-1, and thereby provided a very detailed look at the evolution of the X-ray pulse profiles across the entire 35-day cycle. They discarded the NS free precession model (again, in the simplest version with symmetric magnetic field and under model assumptions on the X-ray pattern) and proposed an alternative model, in which the pulse profile is shaped by the combination of X-ray pattern effects (pencil beam from the magnetic poles mostly seen in hard X-ray band plus softer fan beam formed at a distance of 1.5 NS radii above the NS surface), light bending effects in the NS strong gravitational field distorting the fan beam and forming the soft subpulses flanking the main pulse, and eclipses by the inner edge of the retrogradely precessing accretion disk located at NS radii. The model was shown to be capable of qualitatively reproducing the observed changes in X-ray pulse profiles with the 35-day phase. The need for a central off-set of the magnetic dipole to explain the observed changes in the pulse shape asymmetries was also noted.
Clearly, all the models proposed to explain the observed change of X-ray pulse profiles in Her X-1 are based on a number of assumptions, whose physical justification is not always obvious. Therefore, it seemed to us that a return to the free precession model of the neutron star as the underlying clock mechanism for the 35-day cycle and the cause of the visible change of X-ray pulse profiles could be useful to understand the nature of this complex source.
The wealth of excellent observational data obtained by dedicated RXTE PCA observations of Her X-1 at different phases of the 35-day period make it possible to check a distinctive feature of the NS free precession model. If the regular pulse shape changes are due to stable NS free precession and turn-ons of the X-ray source are caused by the (less stable) precession of the tilted twisted accretion disk around the NS, then assuming the stable NS free precession period one would expect to observe the same pulse shapes at different phases relative to the turn-on times. In other terms, on the O-C diagram for the turn-ons, the pulses of the same shape would not follow the turn-on trend and, instead, would stay along a strict line. The slope of this line would correspond to the ’true’ period of the NS free precession. This program was pursued in the recent study by Staubert et al. (2010b, 2013), and gave a perplexing result: contrary to expectations, phases of the ’template’ profiles constructed from the RXTE database during main-on states of Her X-1 closely trailed the O-C trend for turn-ons, suggesting only one 35-day clock in the system. This finding implies that either the precessing accretion disk is solely responsible for both the 35-day variability and the corresponding X-ray pulse changes (e.g. like in Petterson, Rothschild & Gruber (1991) and Scott et al. (2000) models), or the NS free precession is still there, but the precession period in not stable, but varies by , and there exists a strong synchronization between the NS free precession period and the precessional motion of the accretion disk. The Occam’s razor principle would incline us in favor of the first possibility, but then we have to understand why the 35-day disk precession persists over many years at around the same value? What is the reason for the accretion disk tilt?
The possible answer could be the corresponding behavior of the optical component HZ Her itself (e.g. Petterson (1975)). However, we think that the NS free precession as the clock mechanism of the observed 35-day periodicity remains an attractive alternative. If present, it allows synchronization of the precessional motion of the disk via dynamical effect of gas streams acting on the disk (see Shakura et al. (1999)) and keeps the phase of the disk’s precessional motion after anomaloue low states (ALS) of the source (those states where the X-ray emission from the NS is blocked by the accretion disk all the times Coburn et al. 2000; Vrtilek et al. 2001). The aim of this paper is to show that accretion onto a freely precessing prolate NS with complex non-dipolar magnetic field can successfully reproduce the observed X-ray pulse profiles and their changes with the 35-day NS free precession period.
2.2 The present model
The present model has several features.
A) NS free precession.
It is well known that free precession of a non-spherical solid body changes the angle between a given point on the body’s surface and the total angular momentum vector (if none of the inertia axes coincides with the angular momentum vector), therefore the location of the magnetic poles, where most of the X-ray emission is presumably generated, will change with respect to the line of sight to produce periodic modulation of the observable X-ray flux.
The NS ellipticity , which is required to explain the -day free precession period in Her X-1, can be a natural consequence of the presence of a strong internal toroidal magnetic field of G in the NS (Braithwaite, 2009). Such a field leads to a prolate form of the NS body and causes its prograde free precession. In an isolated NS (e.g. a single pulsar), electromagnetic torques would secularly damp the free precession (Goldreich, 1970). But this can not be the case for an accreting NS subjected to torques with different signs from the disk-magnetospheric interaction.
B) Disk-magnetosphere interaction.
The disk-magnetosphere interaction is an extremely complicated process which is not fully understood as yet and can lead to different quasi-periodic phenomena (see, for example, recent 3D MHD simulations by Romanova et al. (2013)). When a strongly magnetized NS is surrounded by a thin diamagnetic disk, the NS magnetic field will exert a torque on the disk (see Lai (1999) and references therein). If such a NS freely precesses, the torque changes with the phase of precession. A torque of the same magnitude but with the opposite sign is exerted on the NS from the disk via the magnetic field. The value and sign of this torque averaged over the NS spin period (1.24 s in Her X-1) will depend on the angle between the magnetic pole and the NS angular momentum vector . For a dipole magnetic field, there is a critical value of this angle at which the spin-averaged torque on the NS vanishes (Lipunov & Shakura, 1980), and at which the inner parts of the disk are effectively not subjected to any forces from the NS magnetic field. If , the inner twisted parts of the disk take a spiral-like shape with a certain direction of twisting. The inner edge of the disk then tends to co-align with the NS rotational equator. If , the inner disk is also twisted and tends to co-align with the NS rotational equator, but with the opposite direction of twisting.
Generally, the NS spin axis can be misaligned with the orbital angular momentum. The initial misalignment of the NS angular momentum and the orbital angular momentum can be due to, for example, the natal kick received by the NS during its formation in a core-collapse supernova. The accreting matter brings the orbital momentum to the NS, so the spin axis of a non-precessing NS (i.e., with some fixed value of the angle ) should tend to eventually co-align with the orbital angular momentum of the binary (this argument, we remind, was used by Petterson, Rothschild & Gruber (1991) as evidence against the NS free precession in Her X-1). However, if the NS precesses, the disk-magnetosphere interaction could substantially slow down (or stop altogether) the secular NS–orbit alignment. Indeed, the interaction of the NS with the disk tends to co-align its spin axis with the orbital momentum if , and counter-align for . The net NS angular momentum misalignment will be determined by the sum of differentials due to the magnetospheric torque and the angular momentum of matter supplied to NS. During one free precession period changes sign, and the net angular momentum misalignment can be strongly reduced in the case of accretion onto a precessing NS in comparison with a non-precessing NS. Therefore, it is very likely that due to the disk-magnetosphere interaction the spin axis of a freely precessing NS in a binary system can remain tilted to the orbital angular momentum. This misalignment is important to produce a tilt of the outer parts of the accretion disk via gas streams which are non-coplanar with the orbital plane due to asymmetric illumination of the optical star atmosphere (Shakura et al. (1999), but see also Katz (1973), Gerend & Boynton (1976) for other discussions of the causes of the outer disk tilt).
C) Complex structure of the NS surface magnetic field.
In the simplest case where most of the accreting energy is released at the magnetic poles (e.g. for a pure dipole magnetic field), the X-ray pulse profile would be formed by one or two components depending on the visibility conditions (as in radio pulsars). However, in Her X-1 the pulse profile has a very complex multi-component shape (e.g. Staubert et al. (2013) and below), which changes with the 35-d phase first smoothly and slowly and then more rapidly and strongly.
Observations show (Deeter et al., 1998; Kuster et al., 2005) that the form of the pulse profiles at one precession phase is strongly dependent on energy. In the main-on state, the hard central peak flanked by two softer details is clearly seen. The sub-pulse is much less pronounced and is better seen at lower photon energies. The ratio of the height of the sub-pulse to that of the central peak also changes with the 35-d phase. To explain the observed smooth evolution of profiles at early phases of the 35-d cycle (during the main-on state) we introduce arc-like (or horseshoe-like) structures around the magnetic poles which may be due to non-dipole magnetic field structures near the NS surface (Shakura et al., 1991). This complex field structure near the surface can be formed either initially (Ruderman, 2001; Braithwaite, 2009) or emerge when accreting matter is solidified with the NS crust. Indeed, during accretion the crust thickness near the magnetic poles increases, and the ductile spreading (readjustment) of the crust from poles toward the equator can begin. Assuming the strong freezing of the magnetic field into the conducting crust, the deformation of the initial dipole field into quadrupole and more complex configurations will naturally occur111A non-dipolar character of surface magnetic field of a freely precessing NS has recently been used to explain the anomalous braking index observed in radio pulsars (Barsukov & Tsygan, 2010).. As a result, at a distance of several NS radii above the NS surface, regions with close to zero field strength are formed in the magnetosphere of the accreting NS, where the accreting flux can split into different channels. Therefore, it is natural to expect that the X-ray emission can be generated both in the usual magnetic poles (which can be shifted due to the dipole off-set in the NS body) and in arclets, horseshoes, or ring-like structures surrounding the magnetic poles. This natural process during accretion onto a magnetized NS can split the initial large-scale magnetic field into smaller substructures, which could dissipate more rapidly due to magnetic field reconnection.
3 Parameters of the present model
To explain the observed evolution of X-ray pulse profiles with 35-day phase, the following model is proposed. The model includes the geometrical parameters of the NS (shape, viewing angle) and properties of the emitting regions (their location on the NS surface and emission diagrams).
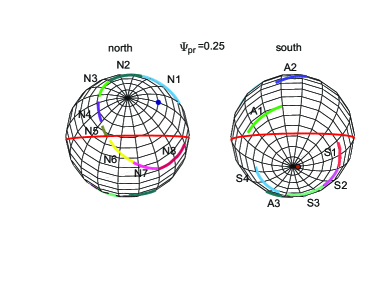
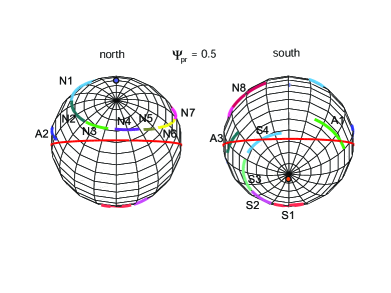
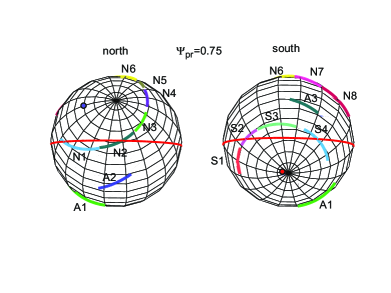
A) NS body. The NS represented by a solid body with two but not three equal principal moments of inertia, (Fig. 1). The axis of the larger principal moment of inertia (axis in the figure) is inclined relative to the angular momentum vector by an angle . If there are no external torques, such a body should freely precess around its principal axis in the sense coincident with the spin (prograde precession) or opposite to it (retrograde precession), depending on whether the precession occurs around the minimum (, prolate body) or maximum (, oblate body) moment of inertia, respectively. To describe features on the NS surface, we choose a reference frame fixed inside the NS body with the polar axis directed along the inertia axis . Below, all coordinates on the NS surface will be given in terms of the latitude (with zero at the inertia equator) and longitude counted counter-clockwise in the northern hemisphere, with the zero meridian passing through the axis of inertia and the north magnetic pole.
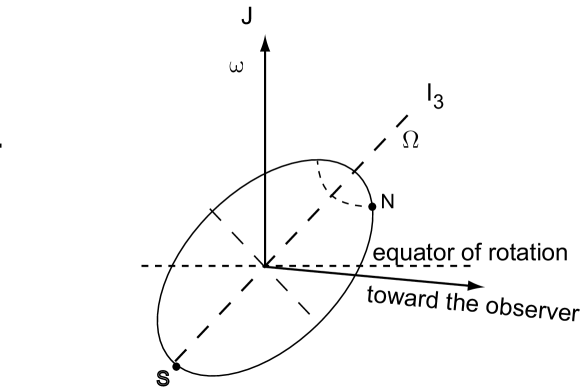
B) Viewing angle of the NS spin axis. The Her X-1 binary system is observed virtually edge-on, at a binary inclination angle of Cheng et al. (1995); Reynolds et al. (1997). The observed evolution of pulses is best reproduced for the angle between the direction towrd the observer and the rotational equator of the neutron star (i.e. when this direction makes an angle of with the NS spin axis, see Fig. 1). This means that during one rotation of the NS the direction toward the observer draws on the NS surface a small circle lying below the NS rotational equator. This circle is shown in Fig. 2 by the solid (red) line. For the nearly edge-on binary system, this geometry is natural if the NS spin axis is coaligned with the orbital angular momentum. However, as discussed above, the NS initial spin-orbit misalignment can be maintained for a long time due to disk-magnetosphere interaction around the freely precessing NS; in that case the NS spin axis lying almost in the plane normal to the line of sight is by chance.
C) Emission regions. As discussed above, complex shape of the X-ray profiles in Her X-1 requires several emission components. We associate them with different emission regions on the NS surface. The two principal emission spots include the magnetic poles where accreting matter is channeled by the NS magnetosphere. However, if there is a more complex structure of the NS surface magnetic field, there could be additional emission regions. From the analysis of X-ray profiles in Her X-1 it was suggested earlier (Shakura et al., 1991; Panchenko & Postnov, 1994) that the NS surface magnetic field can have a quadrupole structure. In the simplest case of an additional quadrupole component aligned with the magnetic dipole, matter can accrete onto a ring around the magnetic pole. Such a structure of emitting regions around magnetic poles was confirmed by 3D numerical MHD-simulations by Long et al. (2008). It was found in the latter paper that for an inclined dipole plus quadrupole the matter accretes onto ring-like structures (arcs) around the magnetic pole. The form of these arcs can be more complex, especially if the center of symmetry of the magnetic dipole is offset from the center of the NS.
C) Magnetic poles. The north (N) magnetic pole has coordinates , that is the angle between the N-pole and the inertia axis is . The south (S) pole has coordinates , i.e. lies very close to the inertia axis; it is observed always by about the same angles during the NS precession period.
D) Arcs. It is convenient to describe the arcs by the coordinates of their centers, the radius (in degrees), and the coordinates of the arc beginning and end in degrees counted along the circle with the specified radius from the zero meridian. Several emission arcs were found to be needed to describe the X-ray pulse profiles in Her X-1. Their positions are specified in Table 1.
E) Transient features. In addition to permanently emitting regions on the NS surface (poles, arcs), transient emitting features appear in several cycles. They represent some spots and arcs which ordinarily do not contribute to the total emission, but sometimes appear quite strong and are responsible for the emergence of distinct features in the pulse profile. The appearance of these features sometimes repeated in different cycles, so we believe them to be real transient emitting regions on the NS surface. Their location is also specified in Table 1 (P1 – transient ’pole’, A1, A2, A3 – transient ’arcs’).
| Poles | ||||||
|---|---|---|---|---|---|---|
| b | l | (deg) | ||||
| N | 60 | 180 | 16 | |||
| S | -85 | 0 | 16 | |||
| P1 | -17 | 80 | 14 | |||
| Arcs | ||||||
| No | center | radius | beg. | end | ||
| b | l | (deg) | (deg) | (deg) | (deg) | |
| N1 cyan | 70 | 160 | 50 | 200-210 | 250 | 14 |
| N2 dark green | 75 | 180 | 43 | 250 | 300 | 13 |
| N3 light green | 65 | 180 | 43 | 302 | 350 | 12 |
| N4 violet | 65 | 170 | 53 | 355 | 400 | 11 |
| N5 grey | 60 | 160 | 55 | 45 | 60 | 11 |
| N6 yellow | 60 | 150 | 50 | 65 | 95 | 11 |
| N7 dark rose | 58 | 160 | 55 | 95 | 120 | 11 |
| N8 red | 70 | 140 | 60 | 120 | 160 | 13 |
| S1 dark rose | -97 | 180 | 44 | 330 | 350 | 11 |
| S2 light rose | -97 | 180 | 44 | 20 | 50 | 11 |
| S3 light green | -97 | 180 | 44 | 50 | 100 | 11 |
| S4 light blue | -95 | 200 | 42 | 110 | 170 | 8 |
| A1 green | -100 | 200 | 65 | 205 | 260 | 11 |
| A2 blue | 60 | 180 | 80 | 245-255 | 275-285 | 11 |
| A3 dark green | 75 | 180 | 105 | 90 | 120 | 11 |
The X-ray emission is assumed to form a Gaussian-like beam with the characteristic width : , where is the angle between the local normal and the diection toward the observer at the precession phase , and the pulse phase ; the angle characterizes the width of the X-ray beam. (One should distinguish the NS precession phase and the phase of the 35-day period; the latter is zero by definition at the moment of the turn-on, while the former can be non-zero at the turn-on (see section 5.1 below).
When calculating the model pulse profiles, the emission poles were treated as point-like, while the emission arcs are represented as the sum of one-degree-long segments. At a given precessional phase , the total emission flux received by a distant observer as a function of the pulse phase was calculated by summing over all visible regions (marked by variable ) at given phases , plus a sine-like component:
Here is the angle between the local normal of the -th emitting area (or its elementary 1-degree part, if the area is extended) on the NS surface and the direction toward the observer, is the effective optical depth which takes into account the fading of the X-ray emission observed through the accretion disk (we remind that the binary inclination angle in Her X-1 is close to 90∘, so the line of sight slides closely above the accretion disk surface). The sine-like component is produced by the reflection of the X-ray emission generated near the NS surface from the warped twisted disk. The sine-like component is most clearly visible when the NS is screened by the accretion disk during ’off’ states between the ’main-on’ and the ’short-on’ states and dominates during the ’short-on’ state of the source, but its presence is also required to describe pulse profiles in the ’main-on’ state (see model pulse profiles below). The parameters (, and ) have clear physical meaning and should be taken into account in addition to purely geometrical change in the aspect ratio of the emitting regions on the neutron star surface and are necessary to describe the observed pulse profile changes with the 35-day phase. We also stress that within a given 35-day cycle we fixed relative intensities of all emitting regions and poles on the NS surface. However, some of them were found to vary from cycle to cycle (see Table 2).
No light ray bending in the gravitational field of NS was taken into account, since the width of emission beams is typically 8-14 degrees and most of the radiation escapes almost normally to the NS surface.
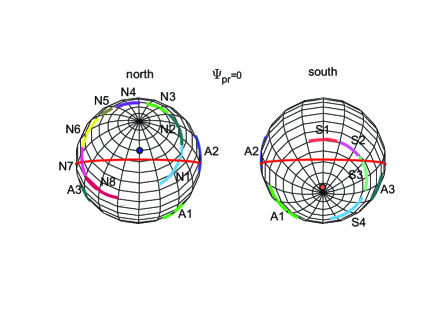
The projection of the NS surface onto the sky plane (perpendicular to the line of sight) at different precession phases at the spin phase corresponding to the minimum angle between the line of sight and the precession axis is shown in Fig. 2. The coordinate grid on the NS surface is connected to the axis of precession. The solid (red) line shows the small circle lying below the NS rotational equator, which is the trace of the line of sight that intersects the center of the NS on the NS surface over one spin period. The NS rotates from left to right and precesses counterclockwise (i.e., prograde) around the axis of inertia (the pole of the grid). We emphasize that the prograde direction of NS free precession is in line with the expectation of the prolate NS body form as being due to strong internal toroidal magnetic field (Braithwaite, 2009).
4 Model X-ray pulse profiles
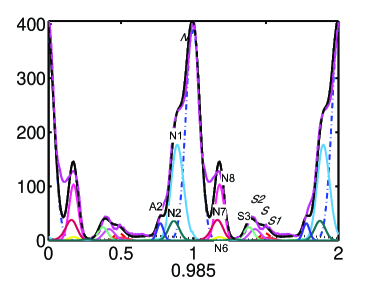
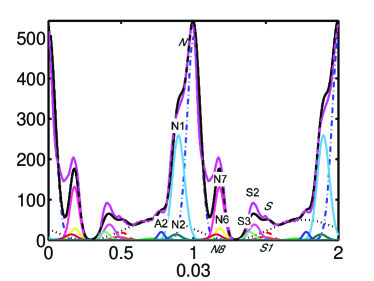
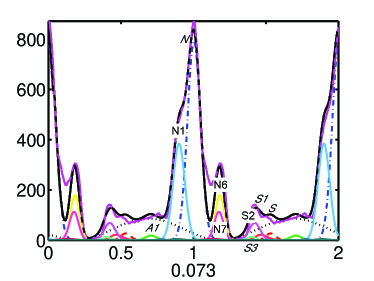
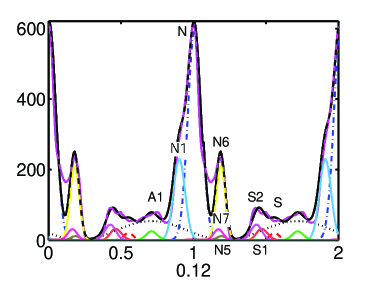
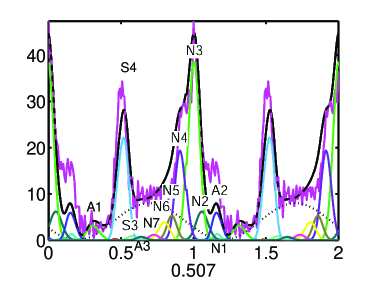
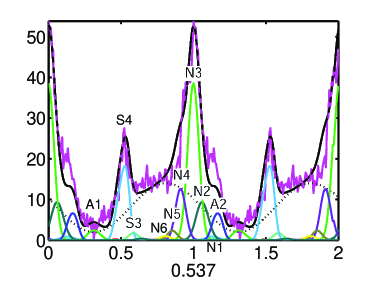
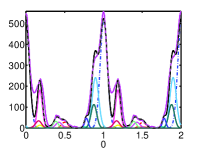
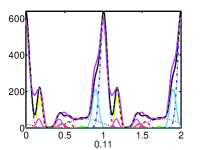
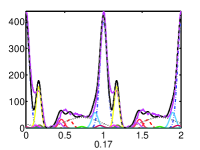
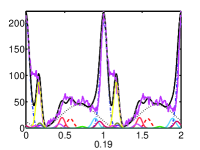
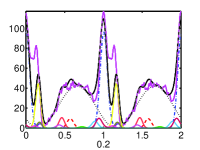
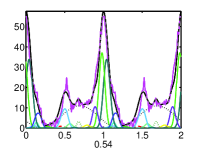
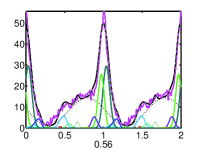
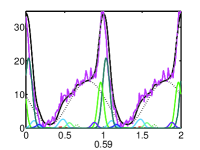
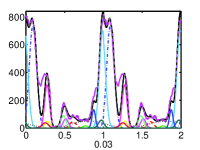
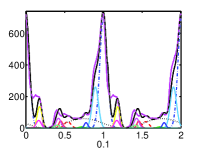
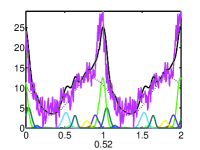
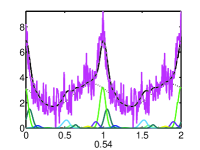
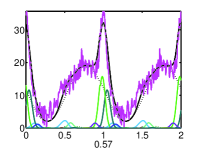
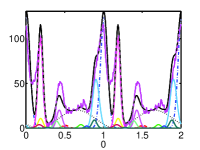
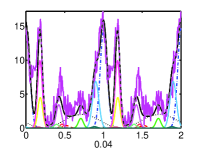
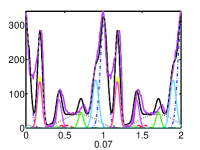
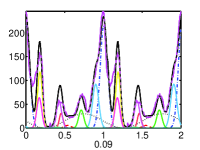
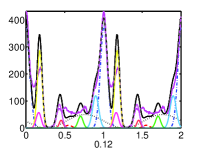
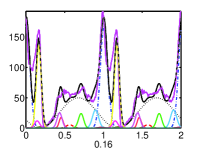
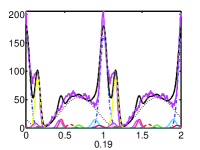
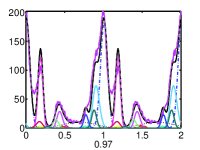
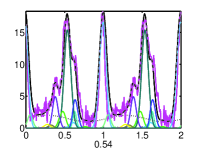
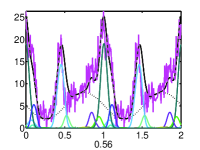
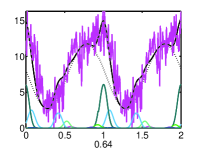
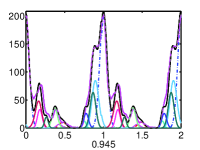
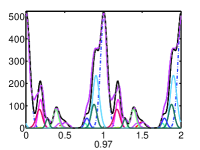
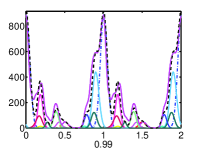
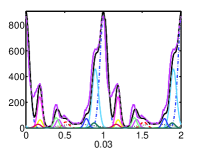
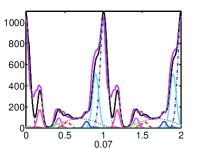
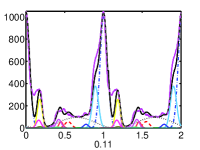
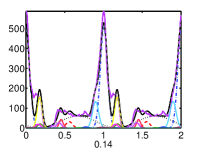
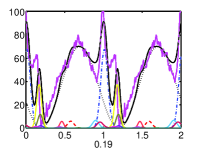
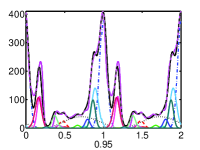
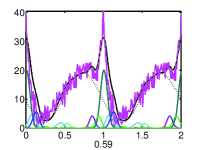
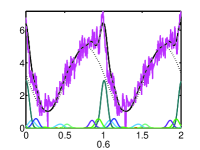
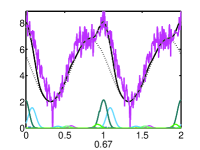
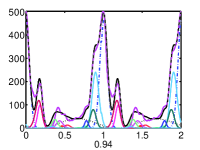
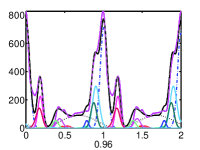
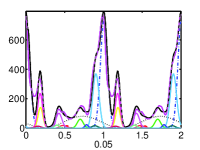
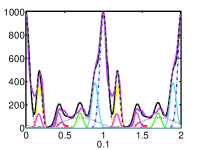
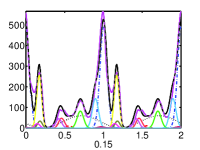
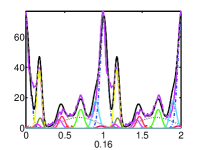
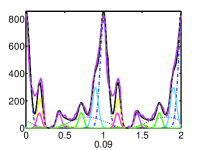
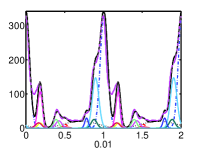
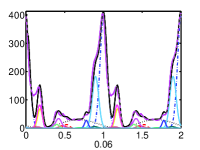
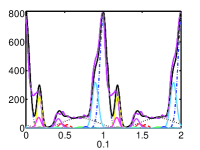
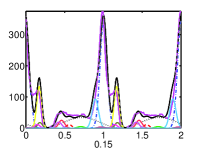
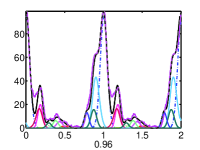
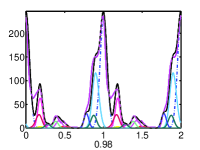
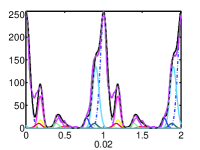
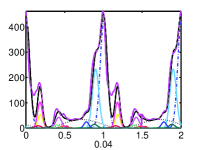
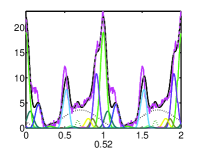
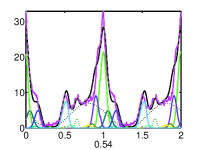
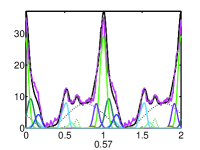
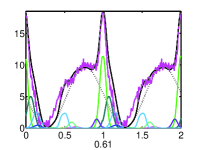
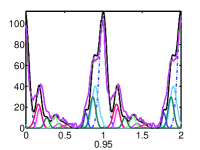
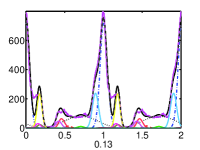
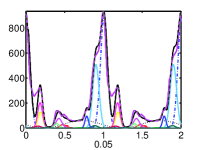
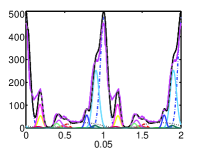
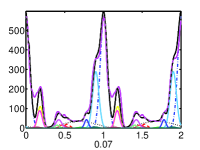
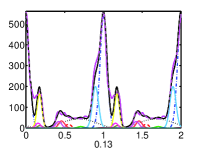
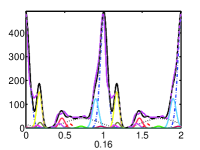
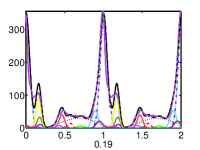
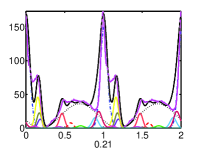
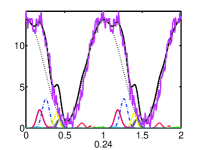
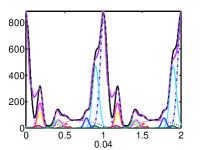
Individual RXTE observations used in our analysis are listed in the Appendix A. The RXTE PCA light curves were extracted for five energy bands: 2.0 – 4.5 keV, 4.5 – 6.5 keV, 6.5 – 9 keV, 9 – 13keV, and 13 – 19 keV. For our analysis, the requirement on the energy band was not to be close to CRSF energy keV, but still to be hard enough to avoid soft X-ray absorption. In the 14-19 keV band the pulse profiles and their evolution with 35-d phase are similar to those in the 9-13 keV band, so the use of 9-13 keV was chosen (somewhat arbitrarily). The model X-ray pulse profiles for RXTE cycle #308 (the turn-on time at MJD 52067.8), with contributions from individual regions identified, are presented in Fig. 3 as a function of the NS free precession phase . The model X-ray pulse profiles for Ginga cycle #181 and all analyzed RXTE/PCA 35-day cycles specified in Table 7 (see Appendix A) are presented in Fig. 5-21 in Appendix B. In each observation, a constant baseline component has been subtracted. The observed puls profiles are shown by solid gray lines (magenta in the on-line version). For each individual 35-day cycle, the emission intensities from each emission region specified in Table 1 were adjusted to best fit the observed pulse shape. Relative intensities of the emission regions for different cycles are listed in Table 2. Within the given 35-day cycle, only the effective optical depth , the amplitude and phase of the reflected sine-line component were varied. As an example, the values of these parameters for the profiles observed in RXTE cycle #308 shown in Fig. 3 are listed in Table 3.
It follows from Table 2 that there is a strong asymmetry in accretion rate onto the North and South hemispheres of the NS. Averaged over the NS rotation and free precession, this asymmetry in the X-ray emission should lead to the appearance of a secular radiative drag acting on the binary system (see e.g. Pal’shin & Tsygan (1998)). The acceleration of the binary system due to this force naturally explains the high galactic latitude of Her X-1/HZ Her, corresponding to kpc above the Galactic plane.
| Cycle No | 181 | 252 | 257 | 258 | 259 | 268 | 269 | 271 | 277 | 303 | 304 | 307 | 308 | 313 | 319 | 320 | 323 | 324 | mean |
| N | 100 | 100 | 100 | 100 | 100 | 100 | 100 | 100 | 100 | 100 | 100 | 100 | 100 | 100 | 100 | 100 | 100 | 100 | 100 |
| S | 27 | 31 | 27 | 45 | 32 | 25 | 27 | 33 | 30 | 27 | 31 | 40 | 43 | 24 | 25 | 27 | 44 | 48 | 32.6 |
| P1 | 2.5 | 0 | 0 | 1 | 1.5 | 0.2 | 2.7 | 0.9 | 2.7 | 0.8 | 3.3 | 0.6 | 0 | 0 | 0 | 0 | 0.7 | 0 | 0.94 |
| N1 cyan | 50 | 110 | 45 | 45 | 50 | 50 | 60 | 46 | 47 | 53 | 50 | 50 | 54 | 59 | 50 | 55 | 56 | 48 | 54.3 |
| N2 d. green | 110 | 72 | 45 | 64 | 50 | 70 | 47 | 50 | 47 | 53 | 33 | 50 | 32 | 35 | 50 | 55 | 56 | 36 | 53.1 |
| N3 l. green | 50 | 50 | 50 | 45 | 50 | 35 | 46 | 50 | 50 | 50 | 50 | 50 | 54 | 76 | 56 | 61 | 50 | 54 | 51.5 |
| N4 violet | 18 | 20 | 20 | 12 | 14 | 12 | 20 | 25 | 20 | 13 | 27 | 10 | 21 | 31 | 25 | 20 | 20 | 20 | 19.3 |
| N5 grey | 2 | 2 | 2 | 2 | 2 | 2 | 5 | 8 | 1.5 | 8 | 7 | 6 | 6 | 5 | 6 | 6 | 5 | 5 | 4.5 |
| N6 yellow | 18 | 15 | 14 | 18 | 31 | 10 | 18 | 33 | 17 | 27 | 21 | 20 | 22 | 22 | 19 | 21 | 13 | 24 | 20.2 |
| N7 d. rose | 27 | 36 | 18 | 18 | 63 | 20 | 23 | 38 | 23 | 33 | 29 | 25 | 22 | 22 | 22 | 24 | 22 | 21 | 25.8 |
| N8 red | 27 | 52 | 27 | 27 | 13 | 30 | 33 | 42 | 33 | 33 | 8 | 25 | 27 | 29 | 31 | 27 | 28 | 30 | 29 |
| S1 d. rose | 3.6 | 5.2 | 4.5 | 3.6 | 3.8 | 4 | 3.3 | 8.3 | 0 | 5.3 | 0 | 4 | 4.3 | 4.7 | 6.3 | 7 | 4.4 | 5 | 4.1 |
| S2 l. rose | 6.3 | 7.2 | 4.5 | 8 | 19 | 9 | 6 | 4.1 | 6.7 | 10.6 | 9 | 6.5 | 6.5 | 8.2 | 6.3 | 7 | 5 | 6 | 7.6 |
| S3 l. green | 7.2 | 21 | 27 | 6.3 | 7.5 | 10 | 15 | 10 | 3.4 | 6.7 | 4.2 | 10 | 6.5 | 6 | 9 | 9 | 10 | 14 | 10.2 |
| S4 l. blue | 11 | 21 | 18 | 9 | 10 | 27 | 6.7 | 13 | 3.4 | 33 | 4.2 | 25 | 19 | 18 | 22 | 22 | 20 | 23 | 17 |
| A1 green | 1 | 3 | 1 | 9 | 10 | 1 | 0 | 4 | 3.4 | 12 | 12 | 1 | 3.2 | 1 | 1 | 1 | 1 | 1 | 3.6 |
| A2 blue | 9 | 21 | 6.4 | 7 | 6.3 | 8 | 17 | 8.3 | 13 | 8 | 2.5 | 9 | 6.5 | 12 | 14 | 14 | 17 | 12 | 11 |
| A3 d. green | 1 | 1 | 1 | 9 | 1.3 | 0 | 6.7 | 1 | 3.4 | 0 | 1 | 0 | 1 | 0 | 6.3 | 6.3 | 6.3 | 6.3 | 2.7 |
| 0.985 | 0.03 | 0.073 | 0.12 | 0.507 | 0.537 | |
|---|---|---|---|---|---|---|
| 0.8 | 0.55 | 0 | 0.1 | 2.2 | 2.4 | |
| 4 | 25 | 43 | 27 | 4 | 6 | |
| 0.5 | 0.5 | 0.6 | 0.6 | 0.5 | 0.4 |
It is seen from Fig. 3 and Figs. 5-21 that the agreement between the observed pulse profiles and the model is not perfect. For example, in the framework of our model it is impossible to reproduce the pulse shape between the ’right shoulder’ (formed by the ’N6-N8’ arcs) and the ’main peak’ (formed by the ’N’ pole in the main-on state). The additional light there cannot be explained by some intermediate Gaussian from an emission region located between N pole and N8 arc, and the asymmetric form of the right shoulder rather suggests more complicated wings of the X-ray emission diagram, which cannot be calculated at present. Therefore, the formal comparison of the model with observations yields poor reduced value. For example, in the case of RXTE cycle 308 shown in Fig. 3 we find for the number of degrees of freedom . When calculating the last number, we used 129 points per each of six observed profiles in the cycle minus the number of adjustable parameters: 19 (intensities of 18 emitting regions and the ’phase zero’ of NS free precession , which were not changed during the cycle) plus 4 variables per each profile (the phase of NS free precession , the effective optical depth , the amplitude and the phase of the sine-like component. Therefore, formally we get , mostly due to failure to fit the ’main-on’ profile between the ’main peak’ and the ’right shoulder’ as discussed above. However, the general behavior of the pulse profile evolution in our purely geometrical model with the NS precession phase is well reproduced. Similar comments are pertinent for other cycles.
We would like to stress that here the important parameter is the identification of the ’phase zero’ of the NS free precession . We remind that this phase corresponds to the minimum angle between the line of sight and the direction to the brightest (North) magnetic pole (see Fig. 2, left top figure), which mostly contributes to the X-ray pulse amplitude during the main-on state. Once determined in a given 35-d cycle, the precession phase zero allowed us to assign precession phases for all other profiles observed in this cycle, since the time intervals between individual RXTE pointings are known (see Table 7). Noteworthy here are cycles for which both ’main-on’ and ’short-on’ profiles were observed (e.g., 181, 308, 313) and consecutive cycles (#268-269, #303-304, #307-308). These cycles were used to estimate the error in the determination of the phase zero, which was found to be . The identification of the zero precession phase allowed us to explore the properties of the assumed NS free precession as a function of time by plotting the moments of on the O-C diagram (see the next Section).
5 Evidence for variable NS precession period from the O-C diagram
5.1 O-C diagram for
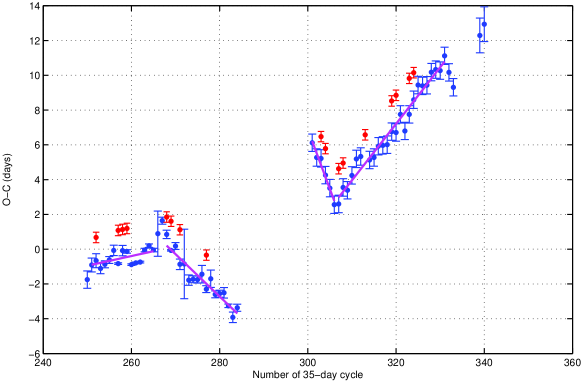
Still & Boyd (2004) pointed to the fact the O-C diagram for the turn-ons of the 35-day cycle of Her X-1 can be described by several straight segments, which means that the local value of the 35-day period during these intervals is different from the mean value used to obtain the ’calculated’ points (see also Staubert et al. (2010a, b, 2011, 2013)). The slope appears to change abruptly from one segment to the next, often close to anomalous low states (ALS), when the source is blocked by the accretion disk all the times.
If NS free precession with constant period were responsible for the long-term stability of the 35-day cycle, the expected location of NS precession zero phase on the O-C diagram would make, within errors, a straight line with the slope determining the value of the true precession period . To check this hypothesis we plotted MJD() for each 35-day cycle with known RXTE profiles from Table 7 on the O-C diagram (Fig. 4) by open diamonds. To obtain each O-C value in this plot, we took each estimated time of free-precession phase zero , and then subtracted the time of the turn-on of the given cycle calculated using the ephemeris of (Staubert et al., 1983):
where is the number of the 35-day cycle, and d is the binary orbital period.
In Fig. 4 we see that the times of the free-precession zero phases actually follow straight lines within the ’stable’ epochs, where the MJD() make straight segments, with a time delay of d with respect to the mean turn-ons calculated using the linear approximation. This time delay is found to be the same for all four ’stable’ epochs identified in the studied data set (Table 4).
| Epoch N | Cycles | (MJD) | (MJD) | MJD | (d) |
|---|---|---|---|---|---|
| I | 252 | 50111.8 | 50112.46 | 50113.14 | 34.90 |
| 257 | 50285.9 | 50286.73 | 50287.81 | ||
| 50321.5 | 50321.58 | 50322.71 | |||
| 259 | 50356.3 | 50356.43 | 50357.62 | ||
| II | 50670.96 | 50670.11 | 50671.96 | 34.61 | |
| 269 | 50704.9 | 50704.97 | 50706.57 | ||
| 271 | 50773.8 | 50774.67 | 50775.79 | ||
| 50981.5 | 50983.80 | 50983.46 | |||
| III | 303 | 51895.2 | 51889.98 | 51896.45 | 34.18 |
| 304 | 51929.1 | 51924.84 | 51930.62 | ||
| IV | 307 | 52032.0 | 52029.40 | 52034.03 | 35.18 |
| 52067.8 | 52064.25 | 52069.20 | |||
| 52243.7 | 52238.52 | 52245.10 | |||
| 319 | 52454.4 | 52447.64 | 52456.17 | ||
| 320 | 52489.2 | 52482.49 | 52491.34 | ||
| 323 | 52594.8 | 52587.05 | 52596.89 | ||
| 324 | 52630.5 | 52621.91 | 52632.06 |
∗ – cycles with pulse profiles available only during the short-on states
† – cycles where both main-on and short-on states were observed
This result rules out the hypothesis of a stable free precession period of NS as a clock mechanism for the 35-day cycle. A similar conclusion was reached by Staubert et al. (2013) using a completely different analysis, in which no assumption was made on the mechanism of pulse profile change, and the observed pulse profile template was used for the timing analysis. The apparent tight connection between the and the turn-ons of the source due to accretion disc precession suggests that either there is only one clock in the system, i.e. the precessing accretion disk around a non-precessing NS, which also produces the change in the observed X-ray pulse profiles, or the free precession of NS is there, but with changing period. Here we will discuss the second possibility, i.e. variable free precession with a fractional change of the free precession period of up to .
5.2 Variable free precession
The free precession period of an axially symmetric solid body is (Landau & Lifshits, Mechanics)
| (1) |
Here is the NS spin period, , , stand for the principal moments of inertia of the body, for an axially symmetric body. The precession takes place around the axis , and the sign of the difference determines the sense of the precessional motion (prograde or retrograde for positive and negative sign, respectively). The angle is the angle between the axis and the angular momentum of the body. In our picture, the axis of inertia is pointed far away from the NS angular momentum . The large value of the angle can be due to a complex pattern of accretion onto the NS surface with a non-dipole magnetic field, as described above.
Generally, the free precession period of the NS can vary either because of the change in the relative difference of moments of inertia , or due to the change in the angle . In our case the non-sphericity of the NS is caused by internal properties of the NS crust and appears to be independent of the external accretion. In addition, possible accretion-induced jumps of the non-sphericity parameter by a few percent are expected to be all positive or negative. Oppositely, the angle can vary near some mean value as a result of accretion of matter onto different spots on the NS surface, and its changes can be of any sign.
What happens if the angle changes abruptly by an amount due to, for example, the increase of stresses in the NS crust above some critical value in the course of accretion? Clearly, the total angular momentum of the NS must be conserved for an instantaneous change in the angle . The total angular momentum can be expressed through the NS spin angular velocity as and is independent of the angle . This means that the change in the angle should not affect the NS spin, only the precessional motion will be changed. Then from (1) we find that the fractional change of the free precession period is
| (2) |
that is to within a numerical factor of order one . This means that the fractional change in the free precession period can be both positive or negative, and can reach a few percent level for rad.
Unlike the total angular momentum and the total energy, the kinetic energy of NS rotation will change. It can be shown that the fractional change of the kinetic rotational energy is
Clearly, this fractional change is too small to have any observational consequences.
In our model, the mean free precession period during the ’stable’ epochs can be calculated from the O-C diagram for the times of the 35-day turn-ons (see Fig. 4, straight lines, and Table 4). The precession of the disk itself is subjected to action of tidal and dynamical torques which can fluctuate (see the Discussion below), and therefore is expected to be less stable than the NS precession. The moments of the disk opening of the X-ray source (the turn-on of the source, i.e. the start of the main-on state, mostly derived from the RXTE/ASM light curves, the column TO(MJD) in Table 7), should follow the free precession period only on average.
6 Discussion
A) Features of the model.
The proposed model describes the observed X-ray pulse profile of Her X-1 in terms of emission from several regions including poles and arcs on the NS surface (see Table 1). The locations of the emission show the complex pattern of accretion that occurs in the presence of a non-dipole surface magnetic field. The narrow X-ray emission beam is a crucial assumption for our model, and we think it is worth to give a more detailed justification to this statement. Generally, the width of the X-ray beam, which may be characterized by , depends on the optical depth for scattering in the region where most of the X-ray emission is generated according to (Basko, 1976; Basko & Sunyaev, 1976; Dolginov et al., 1979).
For example, in the case of Coulomb braking (Zeldovich & Shakura, 1969; Nelson et al., 1993). Therefore, if the accretion braking is due to Coulomb interactions (as is suggested by the observed positive correlation of the cyclotron line energy with X-ray flux, Staubert et al. (2007); Klochkov et al. (2011)), . The fact that the observed X-ray pulse profile can be decomposed into several narrow components was also discussed by Blum & Kraus (2000). When the braking of the accretion flow is due to radiation pressure (Davidson, 1973; Basko & Sunyaev, 1976; Wang & Frank, 1981), most of the radiation flux escapes from an optically thick accretion column which produces a wider X-ray emission diagram. The transition between the two regimes of the accretion matter braking occurs at some critical X-ray luminosity, which depends on the total area on the NS surface onto which the accretion proceeds. It lies between the local Eddington luminosity (here erg/s is the canonical Eddington luminosity for a NS mass of 1.5 ), and the X-ray luminosity , above which the accretion column height is proportional to the X-ray luminosity (Basko & Sunyaev, 1976). Apparently, in Her X-1 the effective area is large enough (because of the complex magnetic field structure near the NS surface as discussed above) that even with an X-ray luminosity of erg/s the source is in the Coulomb braking regime.
Note that a sharp hardening of the X-ray continuum in the main-on pulse is observed when the left shoulder (arc ’N1’) and the main peak (’North pole’) cross the line of sight (see Fig. 6 in Vasko et al. (2013)), which suggests a narrow X-ray beam. No such hardening is observed in the intermediate pulse (’South pole’) – indeed, in our model the latter never crosses the line of sight as it is located close to the axis of inertia of the NS. The intensities of accretion onto the ’North’ and ’South’ parts of the NS are found to be strongly different, suggesting a notable radiative drag force acting on the binary system. The secular acceleration of the system due to this force may explain the observed high galactic latitude of Her X-1.
We have found that to reproduce the observed change of X-ray pulse profiles with 35-day cycle, the NS should freely precess around one of its principal moments of inertia (assuming two-axial NS body), which is assumed to be strongly inclined to the angular momentum (by about 50 degrees). For the assumed geometry of emission regions on the NS surface, the direction of free precession is found to be prograde, which corresponds to the prolate shape of the NS (Fig. 1), as expected if the NS ellipticity is produced by a strong internal toroidal magnetic field.
B) Features of the free precession period changes. As we noted above, if moments of inertia of the NS body do not change, variations in the free precession period due to jumps of the precession axis with conserved total angular momentum do not affect the pulsar spin period (). Therefore, in principle, precise timing of the X-ray pulsar allows one to differentiate between the jumps in the precession axis and the free precession change due to jumps in the moments of inertia. However, disk-magnetosphere interaction appear to have a stronger effect on the pulse timing than precession effects.
C) Uncertainties of the model. Clearly, a purely geometrical model for generation of variable pulse profiles as considered here can not perfectly fit the observed ones. The reasons for this include time variations of the mass accretion rate onto individual zones on the NS surface which can change the emission diagram from the spots and arcs Wang & Frank (1981), temporal appearance of additional ’hot spots’ (we considered only the most stable features that form the pulse profile which are seen in most cycles), etc. For example, in the present model the prominent peak right of the main peak, which is seen almost at all main-on phases on the model pulse profile (e.g., Fig. 5, 14, 15, etc.), is produced by photons originating in the arc-like regions most distant from the North pole (N7, N8 in Table 1). Magnetic field lines in these regions can be inclined to the NS surface under some angle different from . In that case, due to relativistic light bending, the effective X-ray diagram from these emission spots will be more inclined toward the magnetic pole, and hence the part of the pulse profile that is formed when the line of sight crosses these structures, will appear more extended towards the main peak. In addition, X-ray photons scattered in the accreting flow can heat the NS surface around the poles and arcs thus producing more extended beams with non-Gaussian wings. Therefore, we do not expect to perfectly fit the observed pulse profiles by a set of Gaussians in the frame of our geometric model. Variable accretion rate onto different emitting spots on the NS surface in different cycles (see Table 2), as well as changing effective optical depth, may also cause the pulse profile to look quite different at the same NS free precession phases in different 35-day cycles (see especially unusual pulse profiles in RXTE cycles 259 and 303). However, we stress that it is the general behavior of the pulse profiles at the right precession phases in each 35-day cycle considered that is important.
Clearly, the larger number of individual profiles and the longer the time span measured during one 35-day cycle, the more precise is the determination of the time of the NS free precession zero phase . Here especially important are cycles and (see Table 7), for which both the main-on and short-on states were observed by RXTE. It is very difficult to formally calculate the uncertainty in the determination of the free precession phase we ascribe to the pulse profiles in a particular 35-day cycle, but our experience with and shows that that an error equivalent to a phase shift is admissible. This minimal error is adopted as a measure of our accuracy in the determination of the time of the free precession phase zero in a specific cycle. Of course, in a ’poor’ cycle where only a few measurements of pulse profiles are available, the phase error would be larger. But we note that for consecutive series of cycles within the epochs with a ’stable’ precession period (, see Table 4) the phase shift applied to the first measurement in a series translates to all other measurements in a given series, and in all cases the admissible phase shift was found to be less than . So in Fig. 4 we have plotted the derived times of zero precession phases in the studied cycles (open diamonds) with the error .
7 Conclusions
To explain the changing X-ray pulse profiles of Her X-1 as observed by PCA RXTE, we consider a model of accretion of matter onto the surface of freely precessing neutron star with a complex non-dipole magnetic field. The required ellipticity of the NS body is provided by the internal toroidal magnetic field, leading to the prolate shape of the NS and prograde free precession, and the free precession is not damped out because of strong disk-magnetospheric interaction. We have constructed a geometrical model that includes a number of poles, arcs and spots on the NS surface due to a complex character of the surface magnetic field of the neutron star, which emit in narrow pencil beams normally to the surface. The model satisfactorily reproduces the observed pulse profile changes with 35-day phase, which are related to the phase of the NS free precession. We have found that the observed trend of the 35-day turn-ons on the O-C diagram, which can be approximated by a collection of consecutive linear segments around the mean value, can be described by our model by assuming a variable free precession period, with a fractional period change of about a few percent. Under this assumption and using our model we have found that the times of the zero phase of the free precession (which we identify with the maximum separation of the brightest pole on the NS surface with the NS spin axis) occur about 1.6 d after the mean turn-on times inside each ’stable’ epoch, producing a linear trend on the O-C diagram with the same slope as the observed turn-on times. We argue that the few-percent change in the free precession period occurring every few years, often within a short time interval of only a few 35-day cycles, may be related to the wandering of the inertia axis around the mean value inside the NS body due to a complex pattern of accretion onto its surface. The striking closeness of periods of the disk precession and the NS free precession can be explained by the presence of a synchronization mechanism in the system, which involves the dynamical interaction of the gas streams with the accretion disk modulated by the NS free precession period.
Acknowledgements
The authors thank the anonymous referee for careful reading of the manuscript and useful notes. This work was supported by DFG-Schwerpunktprogramme (SPP 1177), grants of Russian Foundation of Basic Research 10-02-00599a and 12-02-00186a. The authors acknowledge L. Rodina for help in RXTE pulse profile analysis.
References
- Barsukov & Tsygan (2010) Barsukov D.P., Tsygan A.I., 2010, MNRAS, 409, 1077
- Basko (1976) Basko M.M., 1976, Astrophysics, 12, 169
- Basko & Sunyaev (1976) Basko M.M., Sunyaev R.A., 1976, MNRAS, 175, 395
- Becker et al. (1977) Becker R.H., Boldt E.A.,Holt S.S. et al., 1977, ApJ, 214, 879
- Blum & Kraus (2000) Blum S., Kraus U., 2000, ApJ, 529, 968
- Boynton (1987) Boynton P.E., 1987, in Physics and Astrophysics of Neutron Stars and Black Holes. Eds. R. Giacconi, R. Ruffini (Amsterdam: North-Holland Publ. Co.), p. 227
- Braithwaite (2009) Braithwaite J., 2009, MNRAS, 397, 763
- Brecher (1972) Brecher K., 1972, Nature, 239, 325
- Cheng et al. (1995) Cheng F.H., Vrtilek S.D., Raymond J.C., 1995, ApJ, 452, 825
- Coburn et al. (2000) Coburn W., Heindl W.A., Wilms J. et al, 2000, ApJ, 543, 351
- Davidson (1973) Davidson K., 1973, Nature Phys. Sci., 246, 1
- Davison & Fabian (1977) Davison P. J. N., Fabian A.C., 1977, MNRAS, 178, 1
- Deeter et al. (1998) Deeter J.E., Scott M., Boynton P.E. et al, 1998, ApJ, 502, 802
- Dolginov et al. (1979) Dolginov A.Z., Gnedin Yu.N., Silant’ev N.A., 1979, Propagation and polarization of radiation through cosmic medium (Moskva: Nauka), 423 p.
- Gerend & Boynton (1976) Gerend D., Boynton P.E., 1976, ApJ, 209, 562
- Giacconi et al. (1973) Giacconi R., Gursky H., Kellogg E.M. et al., 1973, ApJ, 184, 227
- Goldreich (1970) Goldreich P., 1970, ApJ, 160, L11
- Katz (1973) Katz J., 1973, Nat. Phys. Sci., 246, 87
- Katz et al. (1982) Katz J., Anderspon S.F., Grandi S.A., Margon B., 1982, ApJ, 260, 780
- Klochkov et al. (2006) Klochkov D., Shakura N.I., Postnov K.A., Staubert R., Wilms J., Ketsaris N., 2006, AstL, 32, 804
- Klochkov et al. (2011) Klochkov D., Staubert R., Santangelo A., Rotschild R.E., Ferrgno C., 2011, AA, 532, 126
- Kuster et al. (2005) Kuster M., Wilms J., Staubert R., Heindl W.A., Rotschild R.E., Shakura N.I., Postnov K.A., 2005, AA, 443, 753
- Lai (1999) Lai D., 1999, ApJ, 524, 1030
- Leahy & Igna (2010) Leahy D.A., Igna, C.D., 2010, ApJ, 713, 318
- Levine & Jernigan (1982) Levine A.M., Jernigan J.G., 1982, ApJ, 262, 294
- Lipunov & Shakura (1980) Lipunov V.M., Semenov E., Shakura N.I., 1981, SvA, 25, 439
- Lipunov & Shakura (1980) Lipunov V.M., Shakura N.I., 1980, SvA L, 6, 14
- Long et al. (2008) Long M., Romanova M.M., Lovelace R.V.E., 2008, MNRAS, 386, 1274
- Long et al. (2012) Long M., Romanova M.M., Lamb F.K., 2012, New Astron., 17, 232
- Nelson et al. (1993) Nelson R.W., Salpeter E.E., Wasserman I., 1993, ApJ, 418, 874
- Pal’shin & Tsygan (1998) Pal’shin V.D., Tsygan A.I., 1998, Astron. Lett., 24, 131
- Parmar et al. (1980) Parmar A. N., Sanford P. W., Fabian A. C., 1980, MNRAS, 192, 311
- Petterson (1975) Petterson J., 1975, ApJ, 201, L61
- Petterson, Rothschild & Gruber (1991) Petterson J.A., Rothschild R.E., Gruber D.E., 1991, ApJ, 378, 696
- Panchenko & Postnov (1994) Panchenko I.E., Postnov K.A., 1994, AA, 286, 497
- Reynolds et al. (1997) Reynolds A.P., Quaintrell H., Still M., et al., 1997, MNRAS, 288, 43
- Romanova et al. (2013) Romanova M.M., Ustyugova G.V., Koldoba A.V., Lovelace R.V.E., 2013, MNRAS, 430, 699
- Ruderman (2001) Ruderman M, 2001, talk at J. van Paradijs memorial conference, astro-ph/0109353
- Scott et al. (2000) Scott D.M., Leahy D.A., Wilson R.B., 2000, ApJ, 539, 392
- Shakura et al. (1991) Shakura N.I., Postnov K.A., Prokhorov M.E., 1991, SvAL, 17, 339
- Shakura et al. (1998) Shakura N.I., Ketsaris N.A., Prokhorov M.E., Postnov K.A., 1998, MNRAS, 300, 992
- Shakura et al. (1999) Shakura N.I., Prokhorov M.E., Postnov K.A., Ketsaris N.A., 1999, AA, 348, 917
- Staubert et al. (1983) Still M., Boyd P., 2004, ApJ, 606, L135
- Staubert et al. (1983) Staubert R., Bezler M., Kendziorra E., 1983, AA, 117, 215
- Staubert et al. (2007) Staubert R., Shakura N., Postnov K., et al., 2007, AA, 465, L25
- Staubert et al. (2009) Staubert R., Klochkov D., Postnov K., Shakura N., Whilms J., Rotschild R.E., 2009, AA, 494, 1025
- Staubert et al. (2010a) Staubert R., Klochkov D., Postnov K., Shakura N., Whilms J., Rotschild R.E., 2010a, AIP Conference Proceedings, 1248, 209
- Staubert et al. (2010b) Staubert R., Klochkov D., Postnov K., Shakura N., Whilms J., Rotschild R.E., 2010b, PoS (INTEGRAL 2010) 048
- Staubert et al. (2011) Staubert R., Klochkov D., Postnov K., Shakura N., Whilms J., Rotschild R.E., 2011, Paper presented at Physics of Neutron Stars-2011 conference, www.ioffe.ru/NS2011
- Staubert et al. (2013) Staubert R., Klochkov D., Vasco D., Postnov K., Shakura N., Whilms J., Rotschild R.E., 2013, AA, 550, id.A110
- Tananbaum et al. (1972) Tananbaum H., Gursky H., Kellogg E.M. et al., 1972, ApJ, 174, L143
- Trümper et al. (1986) Trümper J., Kahabka P., Ögelman H. et al., 1986, ApJ, 300, L63
- Vasko et al. (2013) Vasco D., Staubert R., Klochkov D. et al., 2013, AA, 550, idA111
- Vrtilek et al. (2001) Vrtilek S.D., Quaintrell H., Boroson B. et al., 2001, ApJ, 549, 522
- Wang & Frank (1981) Wang Y.-M. & Frank J., 1981, AA, 93, 255
- Zeldovich & Shakura (1969) Zeldovich Ya.B. & Shakura N.I., 1969, Soviet Astron., 13, 175
Appendix A RXTE data
Table 7 lists MJD of the turn-ons and of the center of Ginga (cycle 181) and RXTE/PCA (cycles 252-324) observations of Her X-1 used for pulse profile modeling in the present paper. The corresponding model phase of the NS precession for each date is presented. Turn-on times of 35-day cycles are taken from Staubert et al. (2013).
| Cyc. N | Turn-on (MJD) | Model | |
|---|---|---|---|
| 181† | 47642.2 | † Ginga data Deeter et al. (1998) | |
| main-on | 47643.9 | 0.0 | |
| 47647.8 | 0.112 | ||
| 47649.8 | 0.166 | ||
| 47650.7 | 0.193 | ||
| 47650.8 | 0.197 | ||
| short-on | 47662.8 | 0.540 | |
| 47663.0 | 0.545 | ||
| 47663.6 | 0.563 | ||
| 47664.7 | 0.591 | ||
| 252 | 50111.8 | ||
| main-on | 50114.18 | 0.03 | |
| 257 | 50285.9 | ||
| main-on | 50291.24 | 0.1 | |
| 258 | 50321.5 | ||
| short-on | 50340.90 | 0.52 | |
| 50341.75 | 0.54 | ||
| 50342.70 | 0.57 | ||
| 259 | 50356.3 | ||
| main-on | 50356.15 | 0.97 | |
| 50357.09 | 0 | ||
| 50358.55 | 0.04 | ||
| 50359.54 | 0.07 | ||
| 50360.49 | 0.09 | ||
| 50361.21 | 0.12 | ||
| 50362.71 | 0.16 | ||
| 50363.85 | 0.19 | ||
| 268 | 50670.96 | ||
| short-on | 50690.50 | 0.54 | |
| 50691.30 | 0.56 | ||
| 50694.20 | 0.64 | ||
| Cyc. N | Turn-on (MJD) | Model | |
|---|---|---|---|
| 269 | 50704.9 | ||
| main-on | 50704.67 | 0.94 | |
| 50705.53 | 0.97 | ||
| 50706.10 | 0.99 | ||
| 50707.33 | 0.03 | ||
| 50709.06 | 0.07 | ||
| 50710.47 | 0.11 | ||
| 50711.27 | 0.14 | ||
| 50713.20 | 0.19 | ||
| 271 | 50773.8 | ||
| main-on | 50773.92 | 0.95 | |
| 277 | 50981.5 | ||
| short-on | 51003.85 | 0.59 | |
| 51004.20 | 0.60 | ||
| 51006.70 | 0.67 | ||
| 303 | 51895.2 | ||
| main-on | 51894.23 | 0.94 | |
| 51895.27 | 0.96 | ||
| 51896.67 | 0.01 | ||
| 51898.26 | 0.05 | ||
| 51899.75 | 0.097 | ||
| 51900.03 | 0.105 | ||
| 51901.48 | 0.15 | ||
| 51902.07 | 0.16 | ||
| 304 | 51929.1 | ||
| main-on | 51933.66 | 0.09 | |
| 307 | 52032.0 | ||
| main-on | 52032.99 | 0.97 | |
| 52034.68 | 0.01 | ||
| 52036.27 | 0.06 | ||
| 52037.98 | 0.105 | ||
| 52039.60 | 0.15 | ||
| Cyc. N | Turn-on (MJD) | Model | |
|---|---|---|---|
| 308 | 52067.8 | ||
| main-on | 52068.69 | 0.985 | |
| 52070.34 | 0.03 | ||
| 52071.95 | 0.07 | ||
| 52073.64 | 0.12 | ||
| short-on | 52087.25 | 0.51 | |
| 52088.30 | 0.54 | ||
| 313 | 52243.7 | ||
| main-on | 52243.55 | 0.96 | |
| 52244.55 | 0.98 | ||
| 52245.64 | 0.02 | ||
| 52246.42 | 0.04 | ||
| short-on | 52263.50 | 0.52 | |
| 52264.20 | 0.54 | ||
| 52265.25 | 0.57 | ||
| 52266.40 | 0.61 | ||
| 319 | 52454.4 | ||
| main-on | 52454.31 | 0.95 | |
| 52460.89 | 0.13 | ||
| 320 | 52489.2 | ||
| main-on | 52493.09 | 0.05 | |
| 323 | 52594.8 | ||
| main-on | 52598.51 | 0.05 | |
| 52599.49 | 0.07 | ||
| 52600.55 | 0.10 | ||
| 52601.53 | 0.13 | ||
| 52602.36 | 0.16 | ||
| 52603.51 | 0.19 | ||
| 52604.23 | 0.21 | ||
| 52605.20 | 0.24 | ||
| 324 | 52630.5 | ||
| main-on | 52634.10 | 0.04 | |
Appendix B Model pulse profiles
The observed 9-13 keV pulse profiles and those predicted from our modeling are shown for each RXTE cycle at the found NS precession phases corresponding to the mean MJD time of observations. In the figures (electronic version) the observed 9-13 keV profiles are shown in magenta, the model profile is in black; the contributions from each emitting feature on the NS surface are shown in colors as in Table 1. The contributions from the north and south magnetic poles are shown by the dash-dotted blue and dash red lines, respectively. The sine-like component reflected from the disk is shown by the black dotted line.