Time-of-Flight Roton Spectroscopy in Dipolar Bose-Einstein Condensates
Abstract
Dipolar Bose-Einstein condensates may present a rotonlike dispersion minimum, which has yet to be observed in experiments. We discuss a simple method to reveal roton excitations, based on the response of quasi-two-dimensional dipolar condensates against a weak lattice potential. By employing numerical simulations for realistic scenarios, we analyze the response of the system as a function of both the lattice spacing and the -wave scattering length, showing that the roton minimum may be readily revealed in current experiments by the resonant population of Bragg peaks in time-of-flight measurements.
pacs:
03.75.Kk 05.30.Jp and 67.85.-dIntroduction. Dipole-dipole interactions in ultracold gases result in a rich physics extensively investigated in recent years Baranov2008 ; Lahaye2009 ; Baranov2012 . Quantum degeneracy has been achieved already in gases of highly magnetic atoms such as chromium Griesmaier2005 ; Beaufils2008 , dysprosium Lu2011 ; Lu2012 , and erbium Aikawa2012 . In addition, ultracold samples of heteronuclear molecules in their rovibrational ground state allow for the creation of a molecular degenerate polar gas Ni2008 ; DeMiranda2011 ; Chotia2012 .
The interesting features of ultracold polar gases originate from the anisotropic and long-range character of the dipole-dipole interaction Baranov2008 ; Lahaye2009 ; Baranov2012 that results in a geometry-dependent stability Muller2011 and in a peculiar dispersion of the elementary excitations. Gases with short-range interactions present a linear (phonon) dispersion at low momenta, monotonically increasing to a quadratic (free particle) dispersion at large momenta Stringari-Book . In contrast, under proper conditions, dipolar Bose-Einstein condensates present a dispersion minimum at intermediate momenta Santos2003 ; Ronen2007 , a feature reminiscent of the roton minimum of superfluid helium Landau1947 ; Feynman1954 . Moreover, when the rotonlike minimum reaches zero energy, the condensate becomes dynamically unstable (roton instability) Santos2003 ; Ronen2007 ; Wilson2009 ; JonaLasinio2013 against finite momentum excitations, and it collapses in a fundamentally different way compared to the usual phonon collapse Lahaye2008 .
Although rotons constitute a key feature of dipolar gases, the direct observation and characterization of rotonlike excitations in these gases is still elusive, being nowadays a major goal pursued by several experimental groups Wu2012 ; Takekoshi2012 . The detection of rotons is complicated by several issues. On one hand, the rotonized spectrum results from the peculiar momentum dependence of the dipole-dipole interactions in quasi-two-dimensional (or quasi-one-dimensional) traps, with a strong transverse harmonic confinement. The characteristic roton wavelength is approximately , where is the transverse oscillator length. As a result, the observation of the roton requires pancake-like traps with large aspect ratios. On the other hand, harmonically confined pancake condensates with large aspect ratios are characterized by an inherent local nature of the roton excitation spectrum, which leads to an effective roton confinement at the center of the trap JonaLasinio2013 ; Bisset2013 and therefore to a reduced roton signal.
Various methods have been proposed so far to detect the rotonized spectrum. For example the structure factor of a trapped dipolar gas was studied recently in Ref. Blakie2012 . However, the local nature of the roton excitations may hinder the clear characterization of the position of the dispersion minimum. In another recent interesting paper Bisset2013 , it has been shown that atom-number fluctuations may be employed to reveal not only the presence of the roton minimum but also its local confinement. However, this technique requires in situ imaging footnote-Axel , which still represents a serious technical challenge in current experiments. As a third way, rotons may be detected by stability spectroscopy Corson2013a ; Corson2013b based on the analysis of the condensate stability in the presence of a weak lattice. This technique, which has been analyzed in the absence of an overall harmonic confinement, may still be handicapped by the local nature of the roton spectrum in trapped condensates since the very presence of the confinement leads to a local, rather than global, stability of the condensate. As a consequence the onset of destabilization will also be local, thus impeding the precise determination of the roton wavelength and the roton instability regime.
In this Brief Report we propose a simple technique to reveal the roton, which similar to Refs. Corson2013a ; Corson2013b is based on the response of the condensate against a weak lattice potential. However, we do not focus on the stability of the condensate but rather on the effects of the rotonlike minimum on time-of-flight pictures of the stable condensate. The presence of a deep roton minimum at the center of the trap results in an enhanced local response against a weak lattice potential. The magnitude of the Bragg peaks in time-of-flight images presents a resonant dependence as a function of the lattice spacing, peaking in the vicinity of the roton wavelength. As such, a clear signature of the roton minimum can be revealed without in situ imaging but simply with time-of-flight images. We analyze this resonant dependence and the variation of the Bragg peak by means of numerical simulations, as a function of both the -wave scattering length and the lattice spacing. We carefully consider the effects of confinement by simulating realistic conditions in on-going experiments, showing that the Bragg peak may be readily resolved, hence opening a promising route for the observation of the roton minimum.
Model. We consider a dipolar condensate of bosons of mass and (electric or magnetic) dipole moment oriented along . The condensate is confined by a three-dimensional (3D) harmonic trap of frequencies in the plane and along , with . Within a mean field approach, the condensate wave function obeys the nonlocal Gross-Pitaevskii equation,
| (1) |
where characterizes the short-range interaction, is the -wave scattering length, is the dipole-dipole interaction potential, is the angle between r and the axis, is the radial coordinate in the plane and .
We consider a weak perturbing one-dimensional (1D) lattice formed by two intersecting lasers of wavelength , propagating on the plane with wave vectors , where is the intersection angle. The resulting lattice potential acquires the form , with a lattice spacing . Note that by changing the angle we can explore all lattice spacings larger than , an important feature for the experimental implementation of our method.
As mentioned above, a pancake dipolar condensate may become unstable against roton instability at intermediate momenta Santos2003 , with being the transverse oscillator wavelength. This occurs for an -wave scattering , where the value of the critical scattering length depends on the dipole strength and on the confinement. In the presence of the weak additional lattice, also depends on the lattice properties. For a given we determine first. Then, for each particular lattice spacing and each scattering length , we calculate the ground state of the system, using the imaginary time evolution of Eq. (1).
We are particularly interested in the properties of the density modulations induced by the weak lattice. In general, a lattice with amplitude smaller than the chemical potential leads to weak or vanishing density modulations. However, this is not the case in the presence of a deep roton minimum in the spectrum. To analyze the response of the system against the perturbing lattice, we obtain the integrated two-dimensional (2D) density and calculate the visibility of the associated density pattern, defined as
| (2) |
where is the central maximum of the density modulation while is the adjacent minimum. For the considered 1D lattice we have and .
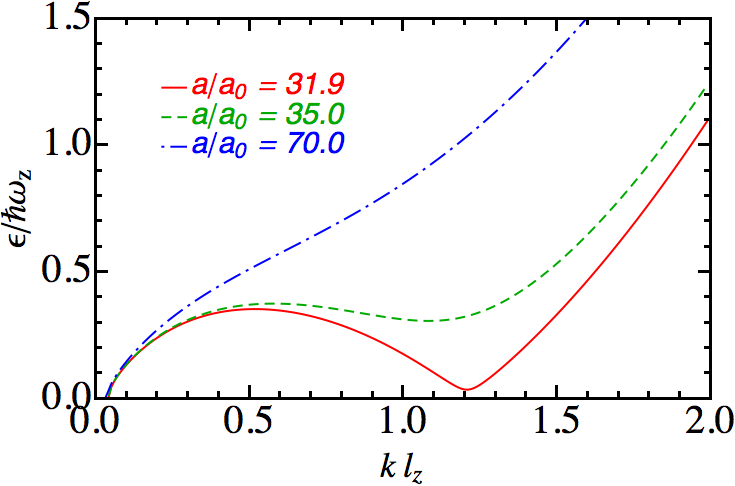
Numerical results. Our calculations are performed considering a condensate of erbium, but similar results hold for other magnetic atoms, although the particular parameters will, of course, be different. Based on ongoing experiments, we consider the particular case of 168Er atoms in a cylindrical trap with frequencies Hz and Hz (). We consider a lattice strength . The chemical potential weakly depends on , but we checked that for all the lattice momenta we consider. For these parameters we determine , where is the Bohr radius. In Fig. 1 we plot the Bogoliubov spectrum of the condensate, obtained as the solution of the Bogoliubov-de Gennes equations for the case , as detailed in Refs. Santos2003 ; JonaLasinio2013 . In this particular case we find since the perturbing lattice obviously has a destabilizing effect on the condensate. By properly tuning the scattering length using Feshbach resonances it is possible to explore the different roton regimes illustrated in Fig. 1: deep roton, ; shallow roton ; and roton free, .
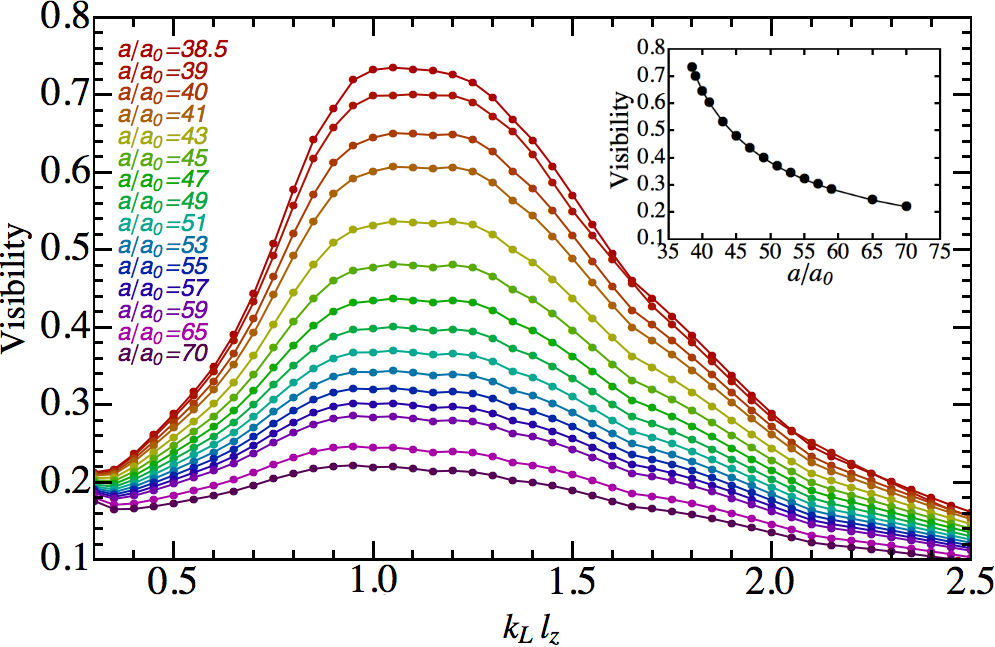
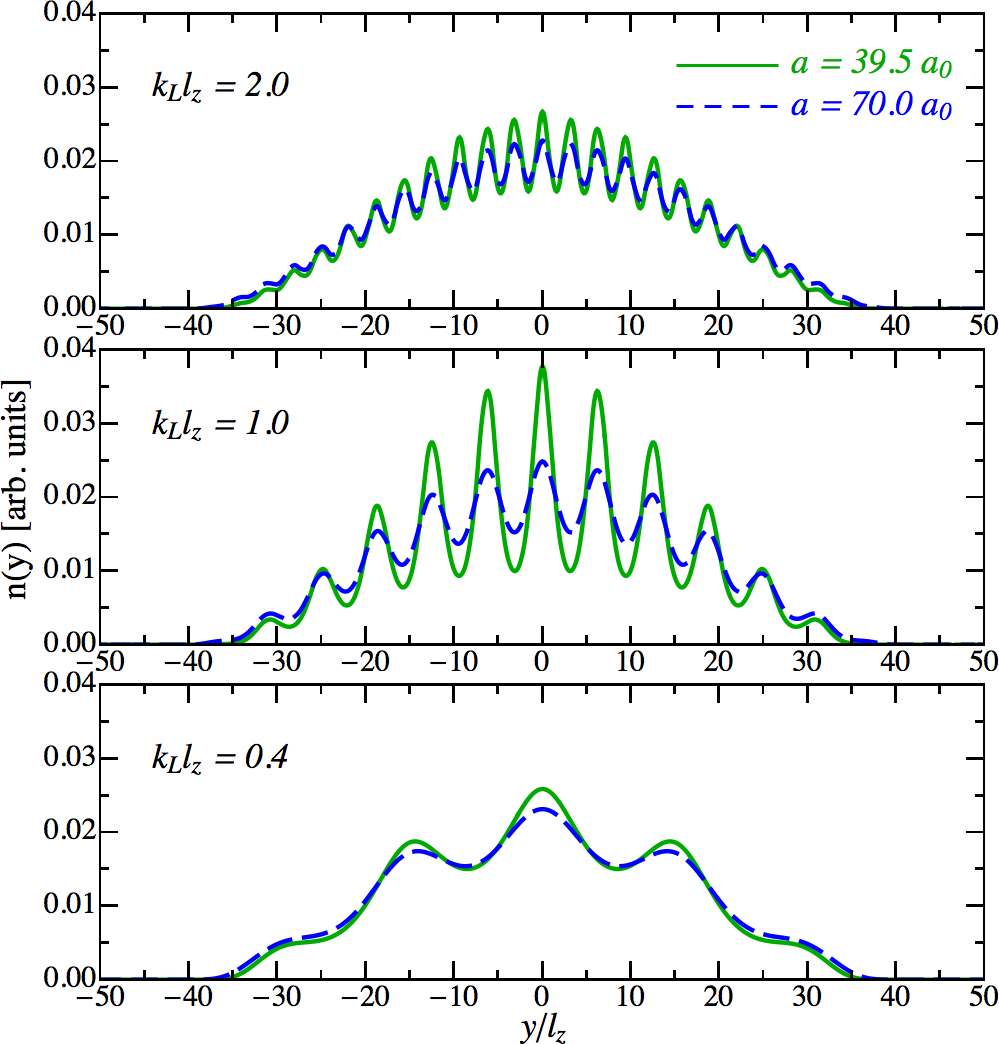
We consider the scattering length interval and the momentum interval . By changing the intersection angle , we can explore all values . Note that for the parameters discussed above nm, and hence for nm, one would be able to scan all . Note, however, that for the lattice wavelength is comparable to the radial size of the condensate, and the concept of visibility loses its meaning. The visibility as a function of the lattice momentum is plotted in Fig. 2 for several values of the scattering length . For , far away from the deep roton regime, the visibility is approximately constant around , being basically independent of . In contrast, for , close to roton instability, the contrast of the density pattern presents a marked resonance-like dependence on , increasing very significantly from to , around . As shown in Fig. 1 this value coincides with the expected roton wavelength. Hence, by measuring the contrast of the density pattern, we have access to a conclusive signature of the roton, as well as to a precise determination of the roton wavelength. This technique would, however, still require in situ measurements footnote-Axel . In Fig. 3 we plot the integrated density distribution along the lattice direction in real space to illustrate how the contrast changes as a function of the lattice momentum and of the scattering length.
To avoid the challenging requirement of in situ imaging we now analyze the effects of the presence of a rotonlike minimum in time-of-flight pictures. The density modulation discussed above results in a momentum distribution characterized by a central peak at , corresponding to the low-momentum components, and two side Bragg peaks at associated with the lattice recoil momentum. This momentum distribution may be imaged in real space after a time-of-flight expansion. A caveat is, however, necessary at this point. As has been shown recently, the time-of-flight expansion of dipolar gases in deep optical lattices may trigger the collapse of the condensate even if the condensate was stable in the trap Billy2012 . However, we always consider here a weak lattice strength compared to the 3D chemical potential , so that all the interference peaks are stable against collapse and separate during the time-of-flight expansion.
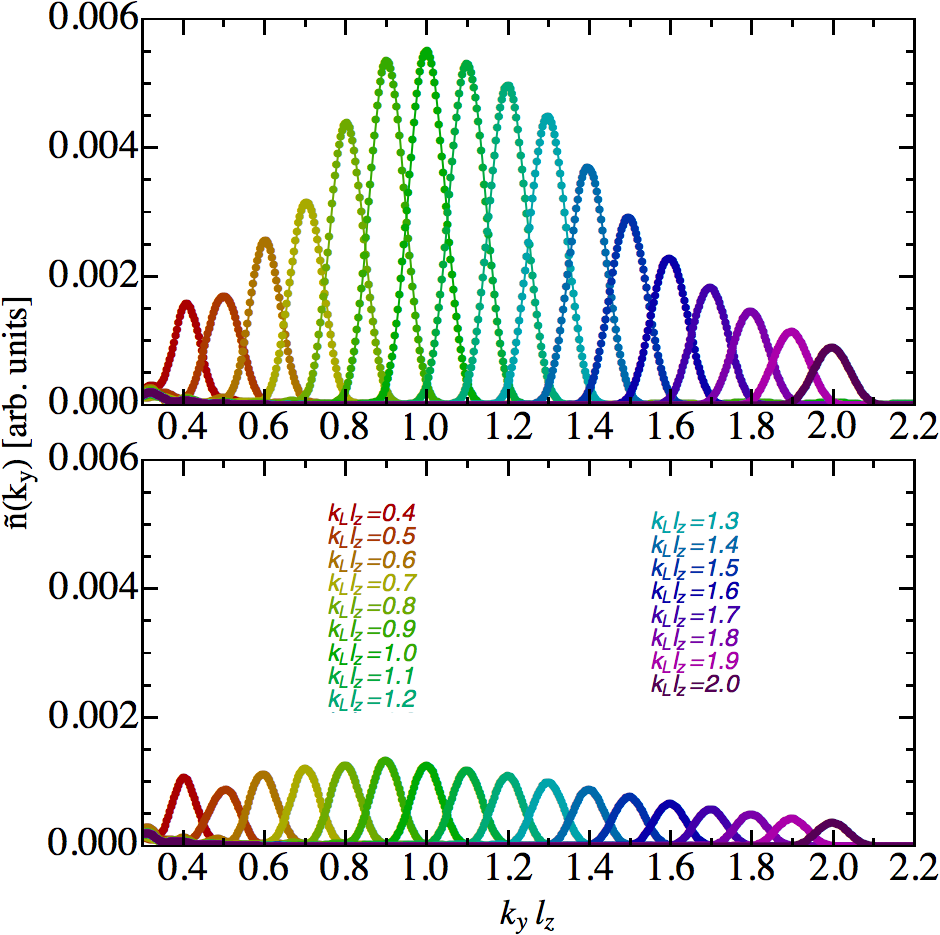
In order to address the results of a time-of-flight measurement, we calculate the integrated momentum distribution of the condensate along the lattice direction, , for different values of the lattice momentum ; see Fig. 4. In the parameter region where the dispersion of the condensate shows a roton minimum we observe an increase of the Bragg peak at whenever the lattice momentum matches that of the condensate roton mode (Fig. 4, top panel, ). In contrast, if the roton minimum is very shallow or absent (Fig. 4, bottom panel, ), the magnitude of the Bragg peak is almost insensitive to the lattice momentum. The envelope of all the Bragg peaks for different (Fig. 4) nicely illustrates the enhanced sensitivity.
In Fig. 5 we plot the absolute number of atoms in a single Bragg peak, assuming atoms in the condensate. The number of atoms in a single Bragg peak reaches its maximum around . Note that in spite of the large maximal contrast, , the corresponding population of each Bragg peak is at most of the total number of atoms. This may be understood by noting that Bragg peaks are in general weakly sensitive to amplitude modulations. A homogeneous system with a modulation presents a visibility , whereas the relative weight of a single Bragg peak is . A contrast of hence corresponds to . Second, the number of particles in the Bragg peak is further reduced by the local nature of the roton spectrum since the density modulations are only markedly contrasted at the center of the condensate. This explains the additional reduction of the maximal number of atoms at each Bragg peak, resulting in a final of the overall number, well below the population of the central peak. Note, however, that the Bragg peaks clearly separate from the dominant zero-momentum component during the time-of-flight expansion, and hence they may still be imaged without the perturbing effect of the dominant low-momentum peak. Note as well that although the relative percent is low, the absolute number of atoms in the Bragg peaks is certainly sizable. Numbers over atoms are resolvable in current experiments. In this sense, we point out that the Bragg peak is narrowly concentrated around , and hence results in a narrow density peak in the time-of-flight expansion, which will consequently result in an enhanced signal at the detectors. Therefore by measuring the number of atoms in the Bragg peaks for different values of the scattering length it should be possible to conclusively reveal roton excitations.

Conclusion. We have proposed a simple way to reveal roton excitations in quasi-2D trapped dipolar condensates based on the response of the condensate in the presence of a weak lattice. We have shown that even a weak lattice may induce a large density modulation at the center of the condensate. This modulation may be revealed by a sizable Bragg peak in time-of-flight pictures, therefore avoiding in situ imaging. We have analyzed the properties of both the contrast of the density modulation and the magnitude of the associated Bragg peak, showing that they present a resonant character as a function of the lattice spacing, peaking around the roton wavelength. The resonant behavior becomes more and more marked as the condensate approaches the roton instability. Finally, we have analyzed a realistic scenario based on current erbium experiments, showing that this technique allows for a conclusive observation of the roton excitations under current experimental conditions.
Acknowledgements.
We acknowledge funding from the German-Israeli Foundation and the DFG (Grant No. SA1031/6 and Excellenzcluster QUEST).References
- (1) M. A. Baranov, Phys. Rep. 464, 71 (2008).
- (2) T. Lahaye, C. Menotti, L. Santos, M. Lewenstein, and T. Pfau, Rep. Prog. Phys. 72, 126401 (2009).
- (3) M. A. Baranov, M. Dalmonte, G. Pupillo, and P. Zoller, Chem. Rev. 112, 5012 (2012).
- (4) A. Griesmaier, J. Werner, S. Hensler, J. Stuhler, and T. Pfau, Phys. Rev. Lett. 94, 160401 (2005).
- (5) Q. Beaufils, R. Chicireanu, T. Zanon, B. Laburthe-Tolra, E. Maréchal, L. Vernac, J.-C. Keller, and O. Gorceix, Phys. Rev. A 77, 061601 (2008).
- (6) M. Lu, N. Q. Burdick, S. H. Youn, and B. L. Lev, Phys. Rev. Lett. 107, 190401 (2011).
- (7) M. Lu, N. Q. Burdick, and B. L. Lev, Phys. Rev. Lett 108, 215301 (2012).
- (8) K. Aikawa, A. Frisch, M. Mark, S. Baier, A. Rietzler, R. Grimm, and F. Ferlaino, Phys. Rev. Lett. 108, 210401 (2012).
- (9) K.-K. Ni, S. Ospelkaus, M. H. G. de Miranda, A. Pe’er, B. Neyenhuis, J. J. Zirbel, S. Kotochigova, P. S. Julienne, D. S. Jin, and J. Ye, Science 322, 231 (2008).
- (10) M. H. G. de Miranda, A. Chotia, B. Neyenhuis, D. Wang, G. Quéméner, S. Ospelkaus, J. L. Bohn, J. Ye, and D. S. Jin, Nat. Phys. 7, 502 (2011).
- (11) A. Chotia, B. Neyenhuis, S. A. Moses, B. Yan, J. P. Covey, M. Foss-Feig, A. M. Rey, D. S. Jin, and J. Ye, Phys. Rev. Lett. 108, 080405 (2012).
- (12) T. Koch, T. Lahaye, J. Metz, B. Fröhlich, A. Griesmaier, and T. Pfau, Nature Phys. 4, 218 (2008); S. Müller, J. Billy, E. A. L. Henn, H. Kadau, A. Griesmaier, M. Jona-Lasinio, L. Santos, and T. Pfau, Phys. Rev. A 84, 053601 (2011).
- (13) L. Pitaevskii and S. Stringari, Bose-Einstein Condensation, (Oxford University Press, New York, 1993).
- (14) L. Santos, G. V. Shlyapnikov, and M. Lewenstein, Phys. Rev. Lett. 90, 250403 (2003).
- (15) S. Ronen, D. C. E. Bortolotti, and J. L. Bohn, Phys. Rev. Lett. 98, 030406 (2007).
- (16) L. D. Landau, J. Phys. USSR 11, 91 (1947); Phys. Rev. 75, 884 (1949).
- (17) R. P. Feynman, Phys. Rev. 94, 262 (1954).
- (18) R. M. Wilson, S. Ronen, and J. L. Bohn, Phys. Rev. A 80, 023614 (2009).
- (19) M. Jona-Lasinio, K. Łakomy and L. Santos, Phys. Rev. A 88, 013619 (2013).
- (20) T. Lahaye, J. Metz, B. Frölich, T. Koch, M. Meister, A. Griesmaier, T. Pfau, H. Saito, Y. Kawaguchi, and M. Ueda, Phys. Rev. Lett. 101, 080401 (2008).
- (21) C.-H. Wu, J. W. Park, P. Ahmadi, S. Will, and M. W. Zwierlein, Phys. Rev. Lett. 109, 085301 (2012).
- (22) T. Takekoshi et al., Phys. Rev. A 85, 032506 (2012).
- (23) R. N. Bisset and P. B. Blakie, Phys. Rev. Lett. 110, 265302 (2013).
- (24) P. B. Blakie, D. Baillie, and R. N. Bisset, Phys. Rev. A 86, 021604 (2012).
- (25) In situ imaging may be possible in on-going dysprosium experiments. A. Griesmaier (private communication).
- (26) J. P. Corson, R. Wilson and J. L. Bohn, Phys. Rev. A 87, 051605 (2013).
- (27) J. P. Corson, R. Wilson and J. L. Bohn, Phys. Rev. A 88, 013614 (2013).
- (28) J. Billy, E. A. L. Henn, S. Müller, T. Maier, H. Kadau, A. Griesmaier, M. Jona-Lasinio, L. Santos, and T. Pfau, Phys. Rev. A 86, 051603 (2012).