The spatial sign covariance matrix with unknown location
Abstract.
The consistency and asymptotic normality of the spatial sign covariance matrix with unknown location are shown. Simulations illustrate the different asymptotic behavior when using the mean and the spatial median as location estimator.
2010 MSC: 62H12, 62G20, 62H11
Key words and phrases:
elliptical distribution, Marcinkiewicz’s SLLN, spatial median, spatial sign1. Introduction
We define the spatial sign of as for and , where denotes the Euclidean norm in . Let be a -dimensional random vector, , having distribution . For , we call
the spatial sign covariance matrix (SSCM) of the distribution (or random variable ) with location . Letting further , where represents a random sample from the distribution , we call
the spatial sign covariance matrix of the sample with location . The term spatial sign covariance matrix was coined by Visuri, Koivunen and Oja (2000), but the estimator has a longer history in the statistics literature. It has excellent robustness properties: its influence function is bounded, and the asymptotic breakdown point is (Croux, Dehon and Yadine, 2010). Together with its simplicity, this makes the SSCM a popular scatter estimator in multivariate data analysis.
Within the theory of multivariate scatter estimation, affine equivariance plays an important role. Let denote the data matrix obtained from by applying the affine linear transformation to each data point (where denotes the -vector consisting of ones). An affine equivariant scatter estimator, say, satisfies
| (1) |
for any and any full rank square matrix , i.e. it behaves like the covariance matrix under linear transformations of the data. The problem of robust, affine equivariant scatter estimation has received much attention in the last decades, see e.g. Maronna, Martin and Yohai (2006) or Zuo (2006) for an overview. However, the SSCM lacks this property. It fulfills the weaker condition of orthogonal invariance, that is, it satisfies (1) for all orthogonal matrices . This is closely related to the fact that, at elliptical distributions, the SSCM shares the eigenvectors (and the ranking of the eigenvalues) with the covariance matrix, but the exact connection between the eigenvalues of the SSCM and covariance matrix is, even under ellipticity, rather tricky. An explicit expression is known only for (e.g. Dürre et al., 2014). Thus, the SSCM gives information about the orientation of the data (cf. Bensmail and Celeux, 1996), and its use has primarily been proposed for analyses that are based on this information only, most notably principal component analysis (Marden, 1999; Locantore et al., 1999; Croux et al., 2002; Gervini, 2008). Other such applications are direction-of-arrival estimation (Visuri et al., 2001) or testing for sphericity in the elliptical model (Sirkiä et al., 2009). The latter makes use of the fact that under the null hypothesis that is spherical, is uniformly distributed on the -dimensional unit sphere.
The scatter estimator proposed by Tyler (1987) can be regarded as an affine equivariant version of the SSCM. It lacks, however, the high breakdown point and the simplicity of the SSCM, its computation requiring an iterative algorithm. The estimate obtained when stopping the algorithm after a finite number of steps has been considered and called the -step SSCM by Croux et al. (2010). It keeps the high breakdown point of the SSCM, but has an asymptotic variance close to that of Tyler’s estimator.
In this paper, we are concerned with the asymptotic properties of the SSCM. The strong law of large numbers and the central limit theorem immediately yield
-
(I)
and
-
(II)
,
for every distribution and , where with and .
However, the estimator itself is rarely applicable, since the central location is usually unknown and needs to be estimated. Instead, is used, where is a suitable location estimator. Often, (I) and (II) are mentioned as a theoretical justification for the use of , accompanied by a more or less explicit remark that and possess the same asymptotic behavior as long as is consistent for in some suitable sense. The purpose of this article is to close this gap and rigorously prove that, under weak conditions on and , assertions (I) and (II) still hold true if is replaced . We do not study the asymptotic variance and efficiency of the SSCM in this article, but refer the reader to Magyar and Tyler (2013) and Dürre et al. (2014). Roughly speaking, the SSCM achieves the same asymptotic efficiency as Tyler’s estimator at spherical distributions, which is relative to the (suitably scaled) sample covariance matrix, but its asymptotic variance may get arbitrarily large for heteroscedastic data.
The canonical location estimator for the SSCM is the spatial median
If the data points do not lie on a straight line and none of them coincides with , the spatial signs with respect to the spatial median are centered (Kemperman, 1987, p. 228), i.e. . Thus the SSCM is indeed the sample covariance matrix of the spatial signs of the centered observations, if the latter are centered by the spatial median. The theoretical counterpart, the spatial median of the distribution is
The spatial median always exists, and, if is not concentrated on a straight line, it is unique. For further details see, e.g., Kemperman (1987), Milasevic and Ducharme (1987) and Koltchinskii and Dudley (2000). If the first moments of are finite, then the spatial median allows the more descriptive characterization as the minimizing point of . The spatial median falls within the class of -estimators, for which an elaborate asymptotic theory exists (Huber and Ronchetti, 2009, Sec. 6). See Magyar and Tyler (2011) for the asymptotic distribution and finite sample efficiencies. The computation of the spatial median is also a thoroughly studied problem (e.g. Weiszfeld and Plastria, 2009; Gower, 1974; Vardi and Zhang, 2001). Alternative names are median, mediancentre and space median. For a recent review see Oja (2010).
An alternative definition of the sample spatial sign covariance matrix with unknown location is
with . This definition is preferable for practical purposes. For instance, the trace of is always 1 (except for the uninteresting case that all observations coincide with ). The estimator , on the other hand, also contains the information how many of the data points coincide with . This information is generally of little interest. More importantly, when is observed, it is in most cases not due to properties of the underlying distribution (about which one seeks to draw inference), but is an artefact of the measurement or the location estimator. When , it is usually either caused by a coarse rounding of the data or an estimator that attains one of the data points with positive probability, which is common for many robust estimators, among them the spatial median. All asymptotic results of Section 2 concerning the estimator are also true for . The difference between both estimators is, except for very small , negligible for continuous population distributions.
A referee raised the question of the general importance of the location estimation problem and pointed out that it can be elegantly circumvented by means of symmetrization. For scatter estimation in general (univariate or multivariate), the need for a prior location estimate is usually regarded as a kind of nuisance, making thorough derivations more involved than, e.g., for the problem of location estimation alone. (We are addressing explicitly this nuisance here.) One way to avoid this problem is to use symmetrized scatter estimators. Any scatter estimator gives rise to a symmetrized estimator, which is simply the estimate computed from the pairwise differences, instead from the (suitably centered) data. To name two well-known univariate examples, the symmetrized version of the mean absolute deviation is known as Gini’s mean difference (simply the mean of all pairwise distances). The scale estimator proposed by Rousseeuw and Croux (1993), which is the lower sample quartile of all pairwise distances, can be regarded as a symmetrized version of the median absolute deviation (MAD, Hampel, 1974). Roughly speaking, symmetrized estimators tend to be more efficient at the normal model, but less efficient at very heavy tailed distributions and less robust than the original estimator. Symmetrization is often successfully applied to highly robust estimators to increase their efficiency while retaining a satisfactory degree of robustness.
Multivariate symmetrized scatter estimators have been considered, e.g., in Dümbgen (1998) and Sirkiä, Taskinen and Oja (2007). They play an important role in robust principal component analysis, since they possess the so-called independence property: symmetrized scatter functionals are always diagonal matrices at multivariate distributions with independent margins. See e.g. Oja et al. (2006) or Tyler et al. (2009) for further details. Particularly the symmetrized version of the SSCM (which we simply want to call SSSCM here) has also been considered in Visuri et al. (2000). It is denoted by there, and the authors call it the spatial Kendall’s covariance matrix. It is indeed much more efficient than the SSCM at the normal distribution. For instance, at a bivariate spherical normal distribution, where the SSCM and the SSSCM both are consistent for , the SSCM has an asymptotic relative efficiency (with respect to ) of 50%, whereas the SSSCM achieves 91%, which can be deduced from results by Sirkiä et al. (2009). However, despite their appealing efficiency properties, symmetrized estimators also have a few drawbacks, mainly a higher computational effort, and a less tractable asymptotic variance, making inferential procedures more laborious. The SSCM, with its simplicity as a major appeal, will certainly be of continuing relevance in statistics.
The rest of the paper is organized as follows: In Section 2, strong and weak consistency of the SSCM are proven under the assumption of strong and weak consistency, respectively, of the location estimator and a moment condition on . Furthermore, the asymptotic normality of is shown, provided converges at the usual rate. Section 3 contains the results of a small simulation study demonstrating the effects of different location estimators and exploring the sensitivity of the convergence of the SSCM on the aforementioned inverse moment condition. All proofs are deferred to the appendix.
2. Asymptotic theory
Our first result states conditions on the location estimator and the population distribution that guarantee weak and strong consistency, respectively, of the spatial sign covariance matrix with unknown location.
Theorem 1.
If there is an such that
-
(I)
, and
-
(II)
there is a sequence of random -vectors that satisfies
where is a sequence of random variables that converges almost surely (if ) or converges almost surely to 0 (if ),
then . If is bounded in probability (for ) or converges in probability to 0 (for ), then .
We have the following remarks concerning Theorem 1:
-
(I)
The primary assertion of Theorem 1 is the case . If is strongly or weakly consistent for , then is strongly or weakly consistent, respectively, for if the first moment of is finite. Theorem 1 states further that, if there is information on the rate of convergence of , i.e., (II) is fulfilled for some , the assumption on can be weakened, requiring less than first moments of . Note that condition (I) of Theorem 1 gets weaker with increasing , whereas (II) gets stronger.
-
(II)
For any reasonable location estimate, we expect to converge in distribution. Then we have weak consistency of if .
-
(III)
The situation is slightly different for strong consistency. If we take the mean as location estimator, i.e. and , we know by the law of the iterated logarithm that does not converge almost surely, but for any . Thus for some is required for strong consistency.
-
(IV)
Assumption (I) of Theorem 1 requires that the probability mass is not too strongly concentrated in the vicinity of . This seems intuitive: for many observations being very close to , the spatial signs and will vastly differ, even if is close to . In this sense, assumption (I) accounts for the discontinuity of the sign function at 0. However, it is a very mild condition, it is fulfilled, e.g., if the density of is bounded at .
-
(V)
A continuous, elliptical distribution is characterized by a density of the form
(2) for a function , a positive definite matrix and a -vector . The parameter coincides with the spatial median of as well as the mean, provided the latter exists. Then is fulfilled if
for some . In particular, it is always fulfilled if is bounded at the origin, thus for instance for all normal and elliptical distributions in any dimension. Note that the boundedness is not a necessary condition.
The next result gathers conditions that ensure the asymptotic normality of the SSCM with unknown location.
Theorem 2.
If
-
(I)
,
-
(II)
,
-
(III)
and for ,
where denotes the th component of the random vector , then
with being defined in Section 1.
Assumption (III) of Theorem 2 imposes some form of symmetry of the distribution around the point . It is fulfilled, e.g., if , thus in particular for elliptical distributions with center . If is not symmetric around , asymptotic normality can nevertheless be shown, but we require and to converge jointly, and the asymptotic covariance matrix of does in general not coincide with . This is the situation of our last theorem.
Theorem 3.
If
-
(I)
,
-
(II)
, and
-
(III)
for a symmetric matrix ,
then
with , where is the -dimensional identity matrix and is given by
Again, the assumptions are rather weak. If the fixed-location SSCM and the location estimator converge individually, the joint convergence (III) is usually also fulfilled, although a thorough proof may be tedious. For the sample mean, it can be seen fairly easily, and hence Theorem 3 implies that, e.g., the SSCM with sample mean location is asymptotically normal for any distribution with finite second moments and bounded density.
We have two closing remarks:
-
(I)
In all convergence results in this section, the population distribution is completely arbitrary except for the moment condition on , in particular no continuity is required. If we assume to be continuous, condition (I) of Theorem 2 can be weakened to the boundedness in probability of , and in Theorem 3 it can be dropped altogether. The connection is given by Lemma 4 in the appendix. However, the continuity of is not an essential assumption for these asymptotic statements to hold, and it can, e.g., be exchanged for uniform boundedness of the fourth moments of , which is, while being far from strict, a condition often fulfilled and easy to verify.
-
(II)
The results of this section should be compared to the analogous ones for Tyler’s shape matrix (Tyler, 1987, Sec. 4). The conditions on the population distribution and the location estimate are similar.
3. Simulations
The simulations section has two parts: in Subsection 3.1, we want to get an impression how well, for several and different population distributions, the distribution of is approximated by its Gaussian limit. We study in particular the differences when using the mean and the spatial median as location estimator. In Subsection 3.2, we consider distributions with unbounded densities to examine what happens near the limit case of the inverse moment condition of Theorem 1.
3.1. Spatial median versus mean
We sample from a bivariate, centered normal distribution with covariance matrix
| (3) |
and from a bivariate, centered, elliptical -distribution with two degrees of freedom and the same shape matrix . The corresponding spatial sign covariance matrix is
cf. Dürre et al. (2014). With the variance of the distribution not being finite, we have that, when using the mean as location estimator, the sequence does not converge. Hence we expect the SSCM not to be asymptotically normal in this case.
For both distributions and for various sample sizes, we compute the SSCM with mean and spatial median as location estimator. For each setting, 100,000 samples are evaluated, which yields a fairly precise Monte-Carlo approximation of the actual distribution of the SSCM.


In Figure 1 we see QQ plots of the off-diagonal element for the normal population distribution and . The simulated distribution is plotted against the asymptotic distribution, which is also given in Dürre et al. (2014). The pictures in the first row (mean) and second row (spatial median) are very similar, and we note very little difference for the two location measures under normality. We suspect that the bumpiness of the QQ plot for the spatial median for (lower left corner) is due to the spatial median’s tendency to coincide with one of the data points. For both estimators, we find the distribution of to have light tails for (left column). The reason is the bounded range of the estimate . If is very small, this boundedness is also visible in the QQ plots of the centered and -scaled estimator. The asymmetry (lighter upper tail) is due to the true value 0.134 not lying in the center of the possible range. However, this departure from normality quickly vanishes as increases, and the normal limit generally provides a very good approximation for fairly moderate sample sizes.


Figure 2 shows analogous results for the distribution. Here we observe a qualitatively different behavior of the SSCM depending on the location estimate. In case of the mean (first row), the off-diagonal element is clearly non-normal with heavy tails, which persist also for large . As for the spatial median, the results for normal and distribution are very similar: the second row of Figure 2 is almost identical to the second row of Figure 1.
Additional to the small bivariate example, we present some simulation results for higher dimensions. The results for various and are summarized in Tables 1 (normal distribution) and 2 (for the distribution). The set-up is slightly different: the true covariance is , corresponding to , and we do not concentrate on a single element, but consider the distance of the matrix estimate to the true . The averages of (based on 10,000 runs in each setting) are given. Note that the matrix distance does not blow up as increases. But this is not surprising considering that is bounded by 1 in any dimension . Furthermore, the SSCM with known location is included in the comparison. For instance, at Table 1 we observe observe that the loss for not knowing the location at is about 25% for and about 3% for . In contrast, it appears to make practically no difference, in case of normality, which location estimator is chosen. This is in line with the observation that the mean and the spatial median have a similar efficiency at high-dimensional spherical normal distributions, cf. e.g. Magyar and Tyler (2011).
We have also carried out simulations for a variety of other elliptical distributions, with different generators and different shape matrices . The general picture throughout is the same that is conveyed by the examples here: choosing mean or spatial median as location estimate makes little difference in situations where both estimators are root--consistent. (The differences are more pronounced for “strongly shaped” matrices , where the spatial median is relatively less efficient.) For distributions without finite second moments, taking the sample mean substantially impairs the sample SSCM.
| 5 | 10 | 30 | 1000 | |||||||||
|---|---|---|---|---|---|---|---|---|---|---|---|---|
| kn | mean | med | kn | mean | med | kn | mean | med | kn | mean | med | |
| 10 | 0.901 | 1.090 | 1.074 | 0.900 | 0.983 | 0.979 | 0.899 | 0.924 | 0.923 | 0.897 | 0.897 | 0.897 |
| 50 | 0.981 | 1.217 | 1.213 | 0.980 | 1.085 | 1.084 | 0.979 | 1.012 | 1.012 | 0.980 | 0.981 | 0.981 |
| 200 | 0.995 | 1.241 | 1.241 | 0.995 | 1.104 | 1.104 | 0.995 | 1.029 | 1.029 | 0.995 | 0.996 | 0.996 |
| 1000 | 0.999 | 1.248 | 1.248 | 0.999 | 1.110 | 1.110 | 0.999 | 1.033 | 1.033 | 0.999 | 1.000 | 1.000 |
| 5 | 10 | 30 | 1000 | |||||||||
|---|---|---|---|---|---|---|---|---|---|---|---|---|
| kn | mean | med | kn | mean | med | kn | mean | med | kn | mean | med | |
| 10 | 0.900 | 1.460 | 1.084 | 0.896 | 1.524 | 0.984 | 0.899 | 1.629 | 0.926 | 0.897 | 1.576 | 0.898 |
| 50 | 0.981 | 1.649 | 1.222 | 0.980 | 1.711 | 1.090 | 0.980 | 1.889 | 1.015 | 0.980 | 1.561 | 0.981 |
| 200 | 0.995 | 1.700 | 1.249 | 0.995 | 1.772 | 1.110 | 0.995 | 1.923 | 1.031 | 0.995 | 1.858 | 0.996 |
| 1000 | 0.999 | 1.705 | 1.256 | 0.999 | 1.753 | 1.116 | 0.999 | 1.930 | 1.036 | 0.999 | 1.662 | 1.000 |
3.2. Singularity distribution
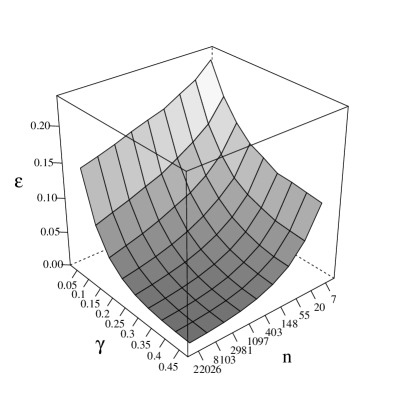
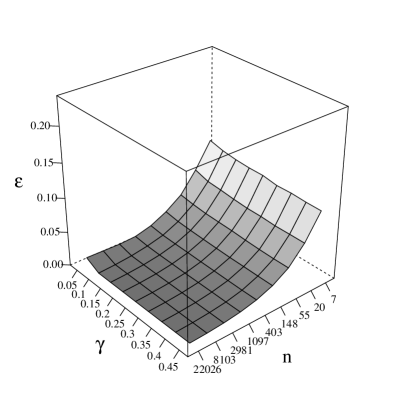
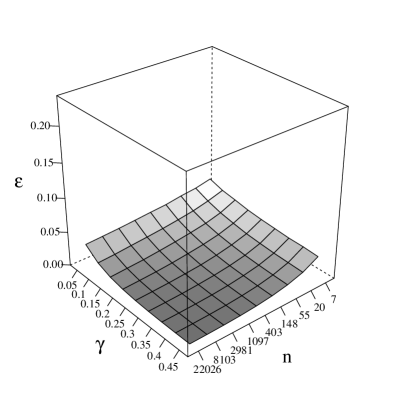
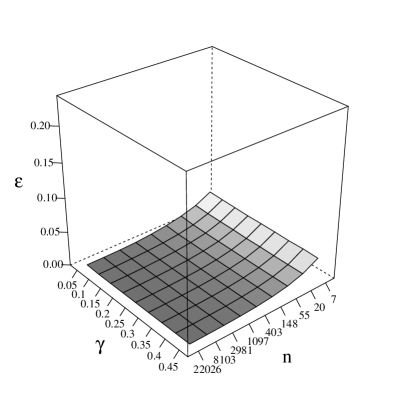
The second goal of our small simulation study is to assess the sensitivity of the convergence of with respect to condition (I) of Theorem 1, i.e., the probability mass concentration around . For that purpose, we consider the -variate elliptical distribution , , with density given by , and
cf. (2). The factor scales the corresponding -variate density to 1. If , the norm has, for any , the density
The densities and are well defined for any . A smaller value of corresponds to a stronger singularity at the origin, and constitutes the limit case, in which the densities are not integrable. Furthermore, if , we have . Thus, using the mean as location estimator, Theorem 1 grants strong consistency for .
In the simulations we consider and several sample sizes ranging from 10 to 20000. Figures 3 illustrates the consistency of the SSCM depending on for and : the absolute error of an off-diagonal element of the SSCM is plotted against and with the mean (left) and the spatial median (right) as location estimator. Each grid point is the average of 10,000 repetitions. The smaller errors for (bottom row) are due to the fact that we examine one singly entry of the SSCM, the magnitude of which is of order as increases.
For the mean, we observe a decline of the absolute error with increasing for all considered, but the convergence is very slow for small values of . Also here, the SSCM with the spatial median behaves qualitatively different: the decay of the absolute error appears to be equally fast for all . This is a plausible observation. For the univariate median, the asymptotic efficiency is proportional to the squared density at the true median, and the boundedness of the density at the median is necessary to prove asymptotic normality. In case of a singularity, the univariate sample median is known to converge faster than at the usual rate. The situation is similar for the spatial median: the efficiency increases with higher probability mass concentration at the true spatial median , and the boundedness of the density is also a standard assumption for the asymptotic normality of the sample spatial median (see e.g. Möttönen et al., 2010; Magyar and Tyler, 2011). The sensitivity of the SSCM to a singularity at , due to discontinuity of the spatial sign, and the increased efficiency of the spatial median in such a situation are opposing effects that seem to nullify each other. A thorough theoretical investigation of this situation seems to be an open problem.
In conclusion, we note that in all our simulations, the SSCM with the spatial median was non-inferior to the SSCM with the sample mean, with clear superiority in the case of the distribution and the singularity distribution . The use of the spatial median as location estimator is advisable and clearly preferable to the mean. Besides the conceptual kinship of the SSCM and the spatial median and their common good robustness properties, the spatial median is also advantageous in the case of high mass concentration at the center.
Appendix A Proofs
In the following proofs, we let, without loss of generality, , and throughout write short for , for and for . The assumption is part of all three theorems, which implies . Thus, we restrict our attention to the case for all , but note that, with some notational effort, we can generalize the results to distributions having an atom at the origin. We use to denote the Frobenius norm of a real matrix, i.e., for any . Letting denote the -vector obtained by stacking the columns of from left to right underneath each other, we have .
Proof of Theorem 1.
First we treat weak consistency. We show for . Associated with the random vector is the following random partition of the space ,
and the random partition , of the index set . Letting and , , we have
Call the first sum on the right-hand side and the second sum . We show convergence to zero in probability for the random variables and separately, starting with . For and we have and
and consequently
which, for , is bounded from above by . Hence
If , the first factor in brackets converges in probability to zero by assumption (II) of Theorem 1, and the second factor converges almost surely to by Kolmogorov’s strong law of large numbers. If , then the first factor is bounded in probability and the second factor converges to zero almost surely by Marcinkiewicz’s strong law of large numbers (e.g. Loève, 1977, p. 255).
It remains to show . Noting that always , we find that
| (4) |
We prove that the right-hand side converges to zero in probability by showing its convergence. Let . Since , there is a -ball around 0 with , where denotes the distribution of . Further, since , and implies , there is an such that for all . Thus, for every fixed and all , we have
and finally for all . Thus, the right-hand side of (4) converges in , and hence in probability, to zero, and so does . The proof of weak consistency is complete.
As for strong consistency, we treat completely analogously. For , we show, as before, that the right-hand side of (4) converges to zero, but now almost surely. Let, again, be arbitrary. Further, let and , where, as before, denotes the -ball around 0. We chose such that . We use to denote the non-negative part, i.e., for and for . Then
The first summand converges to , which is smaller than . For the second summand, we note that implies for all . Thus, since , we have for almost all that there is an such that for all . Hence converges almost surely to zero, and we have proven strong consistency. ∎
When dealing with the spatial sign covariance matrix thoroughly, the possibility of multiple instances of causes some nuisance. In the proof of Theorem 1, this is covered implicitly, since implies . For Theorems 2 and 3, we state the following lemma.
Proof.
Proof of Theorem 2.
We show for . Due to Lemma 4 we may assume without loss of generality that for all . Let, as before, and . Using the identity
| (5) |
we have
Call the summands , , , and from left to right. We will show convergence in probability to zero for each summand. For and we have
The first factor is bounded in probability by assumption (I), and the second tends to 0 almost surely because of Kolmogorov’s strong law of large numbers and assumption (III). For we have
Marcinkiewicz’s strong law of large numbers guarantees convergence of the second factor to 0 almost surely as long as , which is fullfiled by assumption (II). Since , the same argument applies to . For , we apply again identity (5) and obtain
Thus can be split up into six sums, which we denote by from left to right in the formula above. The matrix is best shown to converge to zero in probability by treating it element-wise. The element of , , can be written as
In each of the summands, the first factor is bounded in probability by assumption (I), and the second converges to zero almost surely, due to assumption (III) and Kolmogorov’s strong law of large numbers. The remaining terms are shown to converge to zero in probability by Marcinkiewicz’s strong law of large numbers. For the matrix norms of , and we find the same upper bound as for above. For , we obtain the upper bound
where the first factor is again bounded in probability and the second converges to zero by Marcinkiewicz’s strong law of large numbers, since by assumption (III), . The same argument applies to , and the proof is complete. ∎
Proof of Theorem 3.
We use the same notation and the same decomposition of as in the proof of Theorem 2, and also assume that for all . Of the altogether ten summand this expression has been split up into, seven, namely , , , , , , (those terms that contain in a multiplicity higher than 1), are as before shown to converge to zero by means of Marcinkiewicz’s strong law of large numbers. We denote these seven terms by and focus on the remaining three, , , and . We have
This has the same asymptotic distribution as
which is a linear function of the random vector . This function is given by with being defined in Theorem 3. Hence, by the continuous mapping theorem, converges in distribution to , and the proof is complete. ∎
Acknowledgment
The authors are very thankful to Roland Fried for many fruitful research discussions and a thorough proofreading of the manuscript. We are also indebted to the referee and the associate editor, whose thoughtful comments helped to improve the revised version of the article. Alexander Dürre and Daniel Vogel were supported in part by the Collaborative Research Grant 823 of the German Research Foundation. David Tyler was supported in part by the NSF Grant DMS-0906773.
References
- Bensmail and Celeux (1996) Bensmail, H., Celeux, G., 1996. Regularized Gaussian discriminant analysis through eigenvalue decomposition. J. Am. Stat. Assoc. 91, 1743–1748.
- Croux et al. (2010) Croux, C., Dehon, C., Yadine, A., 2010. The -step spatial sign covariance matrix. Adv. Data Anal. Classif. 4, 137–150.
- Croux et al. (2002) Croux, C., Ollila, E., Oja, H., 2002. Sign and rank covariance matrices: statistical properties and application to principal components analysis., in: Dodge, Y. (Ed.), Statistical Data Analysis Based on the -Norm and Related Methods (Papers of the 4th international conference on statistical analysis on the -norm and related methods, Neuchâtel, Switzerland, August 4–9, 2002), Basel: Birkhäuser. pp. 257–269.
- Dümbgen (1998) Dümbgen, L., 1998. On Tyler’s -functional of scatter in high dimension. Ann. Inst. Stat. Math. 50, 471–491.
- Dürre et al. (2014) Dürre, A., Vogel, D., Fried, R., 2014. Spatial Sign Correlation. ArXiv e-prints 1403.7635.
- Filzmoser et al. (2011) Filzmoser, P., Fritz, H., Kalcher, K., 2011. pcaPP: Robust PCA by Projection Pursuit. R package version 1.9-44.
- Genz et al. (2014) Genz, A., Bretz, F., Miwa, T., Mi, X., Leisch, F., Scheipl, F., Hothorn, T., 2014. mvtnorm: Multivariate Normal and t Distributions. R package version 0.9-9997.
- Gervini (2008) Gervini, D., 2008. Robust functional estimation using the median and spherical principal components. Biometrika 95, 587–600.
- Gower (1974) Gower, J.C., 1974. The median centre. Applied Statistics 23, 466–470.
- Hampel (1974) Hampel, F.R., 1974. The Influence Curve and its Role in Robust Estimation. Journal of the American Statistical Association 69, 383–393.
- Huber and Ronchetti (2009) Huber, P.J., Ronchetti, E.M., 2009. Robust statistics. Wiley Series in Probability and Statistics. Hoboken, NJ: Wiley. 2nd edition.
- Kemperman (1987) Kemperman, J.H.B., 1987. The median of a finite measure on a Banach space, in: Dodge, Y. (Ed.), Statistical Data Analysis Based on the -Norm and Related Methods, Amsterdam: North-Holland. pp. 217–230.
- Koltchinskii and Dudley (2000) Koltchinskii, V., Dudley, R., 2000. On spatial quantiles., in: Korolyuk, V. et al. (Ed.), Skorokhod’s ideas in probability theory., Kiev: Institute of Mathematics of NAS of Ukraine. Proc. Inst. Math. Natl. Acad. Sci. Ukr., Math. Appl. 32. pp. 195–210.
- Locantore et al. (1999) Locantore, N., Marron, J., Simpson, D., Tripoli, N., Zhang, J., Cohen, K., 1999. Robust principal component analysis for functional data. (With comments). Test 8, 1–73.
- Loève (1977) Loève, M., 1977. Probability Theory I. Graduate Texts in Mathematics, New York: Springer-Verlag. 4th edition.
- Magyar and Tyler (2011) Magyar, A., Tyler, D.E., 2011. The asymptotic efficiency of the spatial median for elliptically symmetric distributions. Sankhya B 73, 165–192.
- Magyar and Tyler (2013) Magyar, A.F., Tyler, D.E., 2013. The asymptotic inadmissibility of the spatial sign covariance matrix for elliptically symmetric distributions. ArXiv e-prints 1309.1915.
- Marden (1999) Marden, J.I., 1999. Some robust estimates of principal components. Stat. Probab. Lett. 43, 349–359.
- Maronna et al. (2006) Maronna, R.A., Martin, D.R., Yohai, V.J., 2006. Robust statistics: Theory and methods. Wiley Series in Probability and Statistics. Chichester: Wiley.
- Milasevic and Ducharme (1987) Milasevic, P., Ducharme, G.R., 1987. Uniqueness of the spatial median. Ann. Stat. 15, 1332–1333.
- Möttönen et al. (2010) Möttönen, J., Nordhausen, K., Oja, H., 2010. Asymptotic theory of the spatial median., in: Antoch, J., Huskova, M., Sen, P.K. (Eds.), Nonparametrics and Robustness in Modern Statistical Inference and Time Series Analysis: A Festschrift in honor of Professor Jana Jureǎcková, IMS Collections, Vol. 7. pp. 182–193.
- Oja (2010) Oja, H., 2010. Multivariate nonparametric methods with R. An approach based on spatial signs and ranks. Lecture Notes in Statistics 199, New York: Springer.
- Oja et al. (2006) Oja, H., Sirkiä, S., Eriksson, J., 2006. Scatter matrices and independent component analysis. Austrian Journal of Statistics 35, 175–189.
- R Development Core Team (2010) R Development Core Team, 2010. R: A Language and Environment for Statistical Computing. R Foundation for Statistical Computing. Vienna, Austria. ISBN 3-900051-07-0.
- Rousseeuw and Croux (1993) Rousseeuw, P.J., Croux, C., 1993. Alternatives to the median absolute deviation. Journal of the American Statistical Association 88, 1273–1283.
- Sirkiä et al. (2007) Sirkiä, S., Taskinen, S., Oja, H., 2007. Symmetrised m-estimators of multivariate scatter. Journal of Multivariate Analysis 98, 1611–1629.
- Sirkiä et al. (2009) Sirkiä, S., Taskinen, S., Oja, H., Tyler, D.E., 2009. Tests and estimates of shape based on spatial signs and ranks. J. Nonparametric Stat. 21, 155–176.
- Tyler (1987) Tyler, D.E., 1987. A distribution-free M-estimator of multivariate scatter. Ann. Stat. 15, 234–251.
- Tyler et al. (2009) Tyler, D.E., Critchley, F., Dümbgen, L., Oja, H., 2009. Invariant co-ordinate selection (with discussion). J. R. Stat. Soc., Ser. B 71, 549–592.
- Vardi and Zhang (2001) Vardi, Y., Zhang, C.H., 2001. A modified weiszfeld algorithm for the Fermat-Weber location problem. Math. Program. Ser. A 90, 559–566.
- Visuri et al. (2000) Visuri, S., Koivunen, V., Oja, H., 2000. Sign and rank covariance matrices. J. Stat. Plann. Inference 91, 557–575.
- Visuri et al. (2001) Visuri, S., Oja, H., Koivunen, V., 2001. Subspace-Based Direction-of-Arrival Estimation Using Nonparamatric Statistics. IEEE Trans. Signal Process. 49, 2060–2073.
- Weiszfeld and Plastria (2009) Weiszfeld, E., Plastria, F., 2009. On the point for which the sum of the distances to given points is minimum. Annals of Operations Research 167, 7–41.
- Zuo (2006) Zuo, Y., 2006. Robust location and scatter estimators in multivariate analysis, in: Fan, J., Koul, H. (Eds.), Frontiers in statistics. Dedicated to Peter John Bickel in honor of his 65th birthday, London: Imperial College Press. pp. 467–490.