Broadband radio circular polarization spectrum of the relativistic jet in PKS B2126–158
Abstract
We present full-Stokes radio polarization observations of the quasar PKS B2126–158 () from 1 to 10 GHz using the Australia Telescope Compact Array. The source has large fractional circular polarization, , detected at high significance across the entire band (from 15 to 90 per 128 MHz sub-band). This allows us to construct the most robust circular polarization (CP) spectrum of an AGN jet to date. We find from 1.5 to 6.5 GHz, with a peak of before the spectrum turns over somewhere between 6.5 and 8 GHz, above which . The fractional linear polarization () varies from to 1% across our frequency range and is strongly anti-correlated with the fractional CP, with a best-fit power law giving . This is the first clear relation between the observed linear and circular polarisations of an AGN jet, revealing the action of Faraday conversion of linear polarization (LP) to CP within the jet. More detailed modelling in conjunction with high-spatial resolution observations are required to determine the true driving force behind the conversion (i.e. magnetic twist or internal Faraday rotation). In particular determining whether the observed Faraday rotation is internal or entirely external to the jet is key to this goal. The simplest interpretation of our observations favours some internal Faraday rotation, implying that Faraday rotation-driven conversion of LP to CP is the dominant CP generation mechanism. In this case, a small amount of vector-ordered magnetic field along the jet axis is required, along with internal Faraday rotation from the low energy end of the relativistic electron energy spectrum in an electron-proton dominated jet.
keywords:
radio continuum: galaxies – galaxies: magnetic fields1 Introduction
Large-scale, ordered magnetic fields are invoked to explain the launching, acceleration and collimation of relativistic jets from the central nuclear region of active galactic nuclei (AGN) (Meier, 2009). These jets of relativistic plasma can be formed by strong magnetic fields centrifugally lifting particles out of the accretion disk (Blandford & Payne, 1982) and/or accelerating a pair plasma cascade near the black-hole horizon (Blandford & Znajek, 1977). However, the three-dimensional jet magnetic field structure and particle composition are still not well constrained observationally. Circular polarization (CP), measured as Stokes , in the radio continuum emission from AGN jets is a powerful diagnostic of the jet magnetic field and particles since, unlike linear polarization, it is expected to remain almost completely unmodified by external screens (although see Macquart & Melrose, 2000, for the special case of scintillation induced CP).
The integrated emission of radio-loud AGN typically show linear polarizations of a few percent of the total intensity (Stokes ), while detections of the degree of CP generally find values ranging from 0.1–0.5% (Saikia & Salter, 1988), with values as large as 1% being uncommon (Aller & Aller, 2012). From a compilation of reliable measurements by Weiler & de Pater (1983) and the monitoring observations of Komesaroff et al. (1984), we know that CP fractions are higher in flat spectrum sources, the CP is more variable than both total intensity and linear polarization (LP) fraction, there is no clear correlation between LP and CP, and there is a preferred handedness in individual sources. Rayner et al. (2000) confirmed these results with much higher accuracies and also found that the CP spectral index between 1.4 and 4.8 GHz was approximately flat (, where the CP spectral index () is defined as , with defining the degree of CP) for a sample of 12 AGN. Substantial progress has also been made through high spatial resolution CP measurements using VLBI (Homan & Wardle, 1999; Homan et al., 2001; Homan & Lister, 2006; Vitrishchak et al., 2008). It was found that local levels of CP could be quite strong on VLBI scales, with detected CP fractions generally ranging from 0.3–1%. Most detections were found coincident with the VLBI core, presumably indicating that the CP generation mechanism is most efficient near the unity optical depth surface. Vitrishchak et al. (2008) quoted CP spectral indices from measurement at 15, 22 & 43 GHz but were not able to use them to find any clear trend pointing to a specific CP generation mechanism.
Our ability to extract physical insights about the nature of jets from CP observations depends on our ability to determine the dominant mechanism for CP production. There are many predictions for the origin of the CP emission in radio-loud AGN. Synchrotron emission itself has an intrinsic level of CP (Legg & Westfold, 1968), however, a separate generation mechanism in which Faraday conversion of LP to CP occurs, can potentially dominate the observed emission (Jones & O’Dell, 1977; Jones, 1988). There are several mechanisms through which this Faraday conversion can occur in the jet: Faraday rotation internal to the jet due to either thermal electrons or the low energy end of the relativistic electron energy spectrum (e.g., Pacholczyk, 1973; Jones & O’Dell, 1977), a change in the orientation of the perpendicular component of the magnetic field along the line of sight (Hodge, 1982; Enßlin, 2003; Gabuzda et al., 2008), or anisotropic turbulence in the jet where the anisotropy is created from a net poloidal magnetic flux (Ruszkowski & Begelman, 2002; Beckert & Falcke, 2002). Homan et al. (2009) studied the full-polarization spectra of the quasar 3C 279 at 6 frequencies between 8 and 22 GHz and used an inhomogeneous conical jet model (Blandford & Königl, 1979) dominated by a vector-ordered poloidal field to estimate the net magnetic flux carried by the jet, as well as the jet particle content and lower cutoff in the relativistic electron energy spectrum. Furthermore, through CP measurements it may be possible to get observational proof of whether the magnetic field structure has its roots in the magnetic field of the supermassive black-hole/accretion-disk system responsible for giving rise to the jets (Enßlin, 2003). For detailed reviews of both theory and observation of CP in AGN, see Macquart (2002) and Macquart & Fender (2004).
The Australia Telescope Compact Array (ATCA), with its recent Compact Array Broadband Backend (CABB) system and centimetre receiver upgrades, allows high precision polarimetry over wide frequency bandwidths, making it uniquely placed to answer fundamental questions about the nature of circular polarized emission from AGN jets. The focus of this paper is on 1 to 10 GHz observations with the ATCA of the GigaHertz-Peaked Spectrum (GPS) quasar, PKS B2126–158 (Stanghellini et al., 1998). PKS B2126–158 (J2129-1538) is one of the brightest quasars known (), with a redshift of (Jauncey et al., 1978; Osmer et al., 1994), allowing detailed optical studies of absorption systems along the line of sight (D’Odorico et al., 1998). In a recent study of its broadband spectral energy distribution, Ghisellini et al. (2010) estimated a very large black hole mass of M⊙. Rayner (2000) found this source to be strongly circularly polarized, with at 4.8 GHz, using the old ATCA backend system (128 MHz instantaneous bandwidth). Hence, we specifically targeted PKS B2126–158 to investigate the frequency dependence and origin of its CP emission.
2 Observations and Data Reduction
PKS B2126–158 was observed with the standard ATCA continuum mode (Wilson et al., 2011) over the frequency ranges 1 to 3 GHz, 4.5 to 6.5 GHz and 8 to 10 GHz in the 6A array configuration over 24 hrs from 2011 April 30 to May 1. Two other target sources were also observed, the results of which will be published elsewhere. The total integration time for PKS B2126-158 in the 1 to 3 GHz band was 215 mins while the source was observed for 130 mins simultaneously at 4.5 to 6.5 GHz and 8 to 10 GHz. Our resolution varies from (1 GHz) to (10 GHz) with the source remaining spatially unresolved on all baselines and at all frequencies.
For the linear feed system on the ATCA, it is mainly the instrumental polarization leakages that cause corruption of Stokes by Stokes , while gain errors lead to leakage of Stokes and into . Therefore, instrumental leakages need to be determined with high precision for the ATCA to obtain accurate circular polarization measurements. A positive/negative value of Stokes corresponds to a right-handed/left-handed circularly polarized wave (IAU Transactions, 1974, XVB). We define the Stokes spectral index, , such that the observed flux density () at frequency follows the relation . Calibration was done using the Miriad data reduction package (Sault et al., 1995) in a similar fashion at all three frequency bands. The bandpass and flux calibration was achieved using the primary calibrator PKS B1934-638 in all cases. The Miriad task Mirflag was used for automated flagging in conjunction with some minor manual flagging. To calibrate the polarization we followed the procedure outlined by Rayner et al. (2000) and Rayner (2000), adjusted for the new wide bandwidth system as described below.
From 1 to 3 GHz, we used PKS B2326-477 as the leakage calibrator with seven several-minute cuts spread over the observation period, which provided of parallactic angle coverage. To obtain complete calibration solutions for all polarization leakage terms requires not only large parallactic angle for the leakage calibrator but also needs it to be strongly polarized (). PKS B2326-477 remains polarized at 5% across the entire 1 to 3 GHz band making it an excellent leakage calibrator for this band. The main difference from Rayner et al. (2000) is that the instantaneous bandwidth of the ATCA is now 16 times larger. Therefore, we obtained independent calibration solutions for 16 sub-bands of 128 MHz to determine the frequency-dependent leakages, and to correct for the gain-variation and spectral slope effects across the 2 GHz bandwidth. The 1 to 3 GHz band is strongly affected by RFI from 1.1 to 1.4 GHz so we have avoided analysing this frequency range due to the substantial amount of data lost to flagging. The observations from 4.5 to 6.5 GHz and 8 to 10 GHz were conducted simultaneously and the leakage calibrator used for this band was PKS B2005-489. Excellent parallactic angle coverage () was obtained for this calibrator and its percentage linear polarization ranges from 3% to 5.5% between 4.5 and 10 GHz.
After the calibration solutions were copied to the target, PKS B2126–158, we generated Stokes , , , and clean images at 128 MHz intervals, from which we extracted the peak flux. A small region around the position of the source in the clean-residual map was used to provide an estimate of the contributions to the error from both the system noise and any residual calibration artifacts. The linear fractional polarization was constructed as and the linear polarization angle as . The typical error measured in the 128 MHz images for both Stokes () and the linear polarized flux () was approximately 0.1, 0.2, 0.2 mJy beam-1 in the 1 to 3, 4.5 to 6.5 and 8 to 10 GHz bands, respectively (3 times the theoretical rms noise level). The linear polarized flux was corrected for Ricean bias (Wardle & Kronberg, 1974). Data points with fractional linear polarisation less than were discarded (this only affected some of the linear polarization data in the 4.5 to 6.5 GHz range).
Similar to flux calibration, the CP zero-level must be determined from a source with known CP (e.g., exactly 0%, or some other value known to within the level of precision required). The zero-point CP has been set assuming that PKS B1934-638 has Stokes , which is the usual approach in Miriad. Rayner et al. (2000), however, claimed that PKS B1934-638 is circularly polarized, albeit at the relatively small level of approximately at both 1.4 and 4.8 GHz. This means that all CP observations are biased by a fractional CP of equal magnitude and opposite sign to that of PKS B1934-638; although since CP is highly variable this value may have changed since. For our present analysis, we are not overly concerned about potential contamination from this small level of CP, although we do include the CP zero-level of PKS B1934-638 as an additional error in the derived values of , where the error in is defined as , where .
3 Results & Discussion
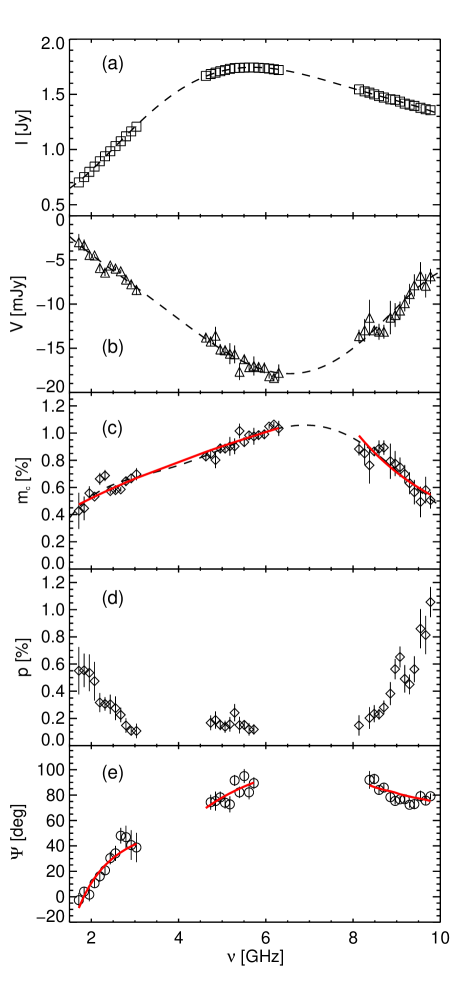
Figure 1 shows the full Stokes properties of PKS B2126–158 from 1.5 to 10 GHz. The total intensity spectrum is shown in Figure 1a, with the dashed line representing a fifth-order polynomial fit to the data. The inverted part of the spectrum from 1 to 3 GHz has a spectral index of (by fitting a power-law to the data in this range). The spectrum turns over at GHz with a peak flux of Jy (measured from a parabolic fit to the 4.5 to 6.5 GHz data only). A power-law fit to the steep part of the spectrum at the high frequency band of 8 to 10 GHz found . The observed levels of Stokes display a smooth variation across the entire band, with a peak value of mJy () at 6.5 GHz and turning over somewhere between 6.5 and 8 GHz (Figure 1b). Even the lowest detected level of CP flux of mJy is at high significance (). The sign of Stokes corresponds to left-circularly polarized emission and does not change across the band. For GHz, we fit a power-law to the percentage CP (), finding a CP spectral index . For GHz, we find . Both fits are represented by the solid lines on Figure 1c. We consider these fits as the most robust measurements of the CP spectrum of an extragalactic source to date. The high fractional CP of 0.5 to 1% seen here is uncommon in AGN, with values approaching 1% and greater being very rare (Macquart et al., 2000; Homan & Wardle, 2004; Vitrishchak et al., 2008). Previous measurements of large CP from the intra-day variable source PKS B1519-273 (Macquart et al., 2000), determined a CP spectral index from observations at 1.4, 2.3, 4.8 and 8.4 GHz. Since this is consistent with our observed CP spectrum, below the turnover, it potentially indicates a common generation mechanism in both these sources.
As a check of the reliability of our results we also show the derived spectrum for the Compact, Steep-Spectrum (CSS) source PKS B0252-712 (Tzioumis et al., 2002). This source was observed contemporaneously and exactly the same calibration solutions were applied as for PKS B2126–158 in each band. As is clearly seen in Figure 2, no significant levels of CP are detected. This is not unexpected given that its emission is dominated by a compact, double-lobed structure (Tzioumis et al., 2002, fig. 5). It is also worth noting that, considering the relatively low fractional LP levels of PKS B2126–158, it is not conceivable that the measured Stokes is leakage from Stokes and . This gives us full confidence in the reliability of our CP measurements for PKS B2126–158 as well as its broadband frequency dependence. We note that the classification of this source as a GPS quasar (Stanghellini et al., 1998) has the potential for confusion with GPS galaxies, from which such high CP would be very surprising given that Doppler boosting is not expected to play a significant role. GPS galaxies are an homogenous class of sources consisting mainly of compact symmetric objects in which the integrated emission is dominated by their extended regions (Stanghellini, 2003). GPS quasars, on the other hand, can be considered to be intrinsically similar to flat-spectrum radio quasars (FSRQs) that show a core-jet type morphology on milliarcsecond scales. In this case, a small number of components, close to the base of the jet, dominate the radio emission and lead to a turnover in the integrated spectrum due to either synchrotron self-absorption (Mutel et al., 1985) or free-free absorption (Bicknell et al., 1997).

3.1 Spatial location of the emission
PKS B2126–158 has been observed at high angular resolution (5 mas) with VLBI (Fomalont et al., 2000; Scott et al., 2004; Charlot et al., 2010), showing that the total flux is almost completely dominated by the core with only a small extension of emission to the south. This indicates a potentially very small angle to the line of sight for this source and hence, strong Doppler boosting of the approaching jet emission. Rayner (2000) found an integrated flux of 1.2 Jy at 4.8 GHz with the ATCA in Oct 1995, while monitoring of this source by Tingay et al. (2003) with the ATCA between 1996 and 2000 found approximately the same flux, with the source exhibiting no significant variability during this time. Fomalont et al. (2000) also found a total flux of 1.2 Jy from model-fitting 2-D Gaussian components to VLBA observations at 5 GHz in June 1996. From this we can conclude that there is no significant flux on intermediate angular scales for this source and practically all the emission we observe with the ATCA is coming from the compact inner jet regions (i.e. within 5 mas, which corresponds to a projected linear size of pc). Therefore, for this particular source, both the Stokes and Stokes emission we detect is most likely coming from the bright, unresolved VLBI core. This is consistent with the vast majority of VLBI CP observations (Homan & Lister, 2006; Vitrishchak et al., 2008) and, importantly, gives us confidence that our CP spectral indices would be the same as those derived if the observations were conducted with the high spatial resolution of VLBI. It is important to note that this source appears to have flared around 2009111http://www.narrabri.atnf.csiro.au/calibrators/ with its 5 GHz Stokes flux increasing to its current level of 1.7 Jy. However, the amount of Stokes appears to have changed very little, since the decrease in from 1.4% (Rayner, 2000) to 0.9% at 4.8 GHz can be explained almost purely by the increase in the Stokes flux alone.

3.2 Consideration of the Linearly Polarized Emission
Figure 1d,e shows the frequency dependence of the linear polarized emission over the same range as the total intensity and circular polarization. We note the low degree of linear polarization () from 4.5 to 6.5 GHz and the surprisingly steep rise toward at both ends of the band, as well the non-monotonic distribution of linear polarization angles () with frequency. Assuming that the linear polarized emission we detect is coming from the same region of the jet as the CP, then the ratio of to also reaches surprisingly large values, ranging from 0.5 to 10 across our full frequency coverage.
The inverted spectrum of the Stokes emission from 1.5 to 6.5 GHz (Figure 1a) indicates that the observed emission in these frequency bands originates from a large range of optical depths in the jet. If we consider the most commonly used jet model of Blandford & Königl (1979), then the position of the unity optical depth surface is frequency dependent (i.e. ). Hence, any analysis of the polarized emission from 1.5 to 6.5 GHz is complicated by the fact that the observed emission at different frequencies is likely coming from different regions in the jet. Numerical radiative transfer modelling is required to properly analyse the polarised emission from these regions and we defer such detailed analysis to future work. For the remainder of this paper we conduct a more qualitative analysis, where we will refer to the “optically thick” regime as corresponding to emission at GHz and the “optically thin” regime, where the spatial location of the emission does not change with frequency, corresponding to GHz.
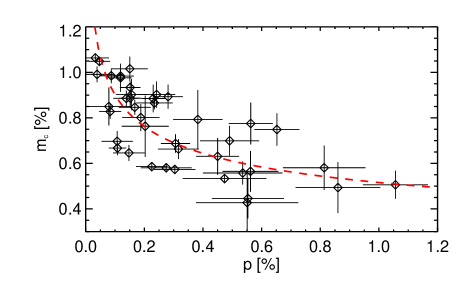
In Figure 1c,d the percentage linear polarization () appears anti-correlated with the percentage CP (), so in Figure 3, we plot versus for each frequency measurement. A Spearman rank correlation coefficient of quantifies the strong anti-correlation between these two variables, where a correlation coefficient of occurs in the case of a perfect anti-correlation. This is the first time such a relation between the LP and CP of an AGN jet has been observed, and strongly supports the action of Faraday conversion of LP to CP. Fitting a power-law dependence to the data gives a best-fit relation (Fig. 3). Such a dependence has not been predicted in previous theoretical work. However, the degree of LP can also be strongly affected by the frequency dependent effects of Faraday depolarisation as well as optical depth effects, which makes this relation non-trivial to analyse. Separate power-law fits to the versus data in the optically-thick and optically-thin regimes gives and , respectively. This may lead one to naively suggest that conversion is more efficient in the optically-thin regime; however, it is more likely that different linear polarisation characteristics due to optical depth effects are responsible. In any case, the scatter in the data is large and it is premature to draw any definite conclusions about differences between conversion efficiency in the optically thick/thin regimes.
For both the intrinsic CP and Faraday conversion of LP to CP mechanisms, the large CP excess (ratio of CP to LP), noted at the beginning of this section, is not generally expected (e.g. Jones & O’Dell, 1977; Valtaoja, 1984). The low observed levels of fractional linear polarization are most likely explained by either strong depolarization from internal Faraday rotation and/or large rotation measure gradients in an inhomogeneous external screen. In general, the distribution of Faraday rotating material in the immediate vicinity of AGN jets is not very well constrained. Most studies conclude that the majority of rotating material is contained in a sheath of slower moving, thermal material surrounding the jet (e.g. O’Sullivan & Gabuzda, 2009; Broderick & Loeb, 2009; Porth et al., 2011, and references therein). Although a significant contribution from unrelated ionized gas clouds, that clearly exist in some sources (Walker et al., 2000), cannot be discounted. Large amounts of Faraday rotation from thermal plasma within jets is generally considered unlikely on energetic grounds (Celotti et al., 1998), and we also consider it unlikely for this particular source (see Section 3.3 for details).
Recent work by Farnsworth et al. (2011) and O’Sullivan et al. (2012) shows that fitting various Faraday rotation models simultaneously to the and data provides the most robust estimation of RM. However, this implicitly assumes a negligible contribution from conversion of LP to CP. Since the frequency dependence of our Stokes and data is clearly contaminated by the large amount of Stokes in this source, we revert to the traditional way of finding the RM, by fitting a line to the variation in the linear polarization angle with wavelength squared (), where the change in the linear polarization angle, . No single RM can fit all the data from 1 to 10 GHz. Instead we determine an RM for each the observing bands individually, finding RMs of rad m-2, rad m-2 and rad m-2 from 1.5 to 3 GHz, 4.5 to 6.5 GHz and 8 to 10 GHz, respectively (fits shown in Figure 4 and also represented in Figure 1e). The 8 to 10 GHz data is not very well described by a linear -law and further observations at shorter wavelengths are required to test the presence of any complex behaviour. The change in sign of the fitted RM in the 8 to 10 GHz band is not too difficult to explain since the sign simply depends on whether the dominant line-of-sight component of the magnetic field is pointing towards or away from the observer, which could potentially change as we sample the full radiation depth of the jet and/or as we probe further upstream in the jet at these higher frequencies. Considering just the magnitude of the RM it is clear that it increases systematically towards higher frequencies and can be fit by a power-law, with .
Frequency-dependent RMs have previously been measured in jets whose observed polarization is dominated by emission from the spatially-unresolved VLBI core at the base of the jet (Jorstad et al., 2005; O’Sullivan & Gabuzda, 2009; Algaba et al., 2011) and through synthetic observations in jet simulations of such regions by Porth et al. (2011). Such an effect is expected (Wardle & Homan, 2003) when the electron number density and magnetic field scale in such a way along (or outside) the jet as to cause a constant rotation of the linear polarization angle (in this case ). To illustrate this effect, we consider power-law scalings of the magnetic field () and electron number density () with distance () from the base of the jet. In a conical jet, we expect and , hence, we get . As noted already, the observed jet emission is dominated by emission from the unity optical depth surface in a conical jet, where . Therefore, we expect the RM to scale as and , as observed. This has important implications for our analysis as it means that the particles and magnetic fields dominating the observed Faraday rotation are most likely internal to the jet. However, we cannot rule out that a boundary layer surrounding the jet scales in a similar fashion as is expected within the jet. We note that the source is located at a relatively high Galactic latitude () where the Galactic RM contribution can be ignored (estimated at rad m-2 using Taylor et al. (2009) in this region of the sky).
3.3 Circular polarization generation mechanism
Through our measurements, there are several fundamental aspects relating to the CP generation mechanism on which we can comment. Firstly, we can conclusively rule out intrinsic CP from a homogeneous source region as the dominant source of CP, since the spectrum does not follow the expected frequency dependence of in the optically-thin regime (Legg & Westfold, 1968) and Stokes does not change sign near the Stokes turnover frequency (Melrose, 1972). For conversion of LP to CP in a homogeneous source, Kennett & Melrose (1998) predict for a co-spatial relativistic and cold plasma or for purely relativistic plasmas. In the optically thin regime (i.e. GHz), we find . This strongly supports conversion of LP to CP by the relativistic particles and magnetic field within the jet as the dominant CP generation mechanism in this source (and rules out any significant contribution from thermal plasma within the jet). However, we cannot determine the exact jet composition from this model, since such a dependence of can occur in a normal plasma (relativistic electrons and protons) or in a pure pair-plasma (relativistic electrons and postitrons).222AGN jets are considered to be effectively charge-neutral, with roughly equal numbers of relativistic electrons and protons (or positrons) flowing outwards (Begelman et al., 1984).
The frequency dependence of below the turnover (from 1.5 to 6.5 GHz) is more difficult to analyse than the dependence above the turnover, because of the need for polarized radiative transfer simulations to accurately model the physical properties of the jet. Such simulations were done by Jones & O’Dell (1977) and Jones (1988), predicting that both conversion and synchrotron emission can contribute to the observed CP. In the case of inhomogeneous source regions, they found that conversion was the dominant process, with the CP strongest near the optically thick core at the base of the jet. The fact that our observed peaks near the frequency at which the Stokes emission turns over is a strong indication that conversion is the dominant generation mechanism for this source. Furthermore, we do not observe a LP angle flip, when going from the optically thin to optically thick regime across the turnover.333The naive expectation of a change in the LP angle can be understood qualitatively by resolving the electric field vector into components parallel and perpendicular to the magnetic field. In the optically thin regime, the linear polarization vector is mostly in the plane of gyration of the electrons (perpendicular to the magnetic field). However, in the optically thick regime, the component of the linear polarization perpendicular to the magnetic field has a much higher probability of being absorbed (with respect to the parallel component). Therefore, in the optically thick regime, the observed plane of polarization is parallel to the magnetic field, leading to a change in the observed linear polarization angle when transitioning between the two regimes. This is also consistent with the Jones & O’Dell (1977) results, which show that simple boundary effects can eliminate both the change of the LP position angle and the sign flip for CP. This links both the LP and CP emission regions to the brightest part of the jet near the unity optical depth surface.
In a normal relativistic plasma, conversion is caused by Faraday rotation within the jet, where in this case, the Faraday rotation would be dominated by the contribution from the low energy end of the relativistic electron energy spectrum. This rotation causes an angular offset between the linear polarization emitted at the back of the jet and the front, hence, generating significant levels of CP. In a pure pair-plasma, conversion of LP to CP can also occur, in the absence of internal Faraday rotation, due to a systematic geometrical rotation of the magnetic field along the line of sight through the jet (Hodge, 1982; Enßlin, 2003). One possible realisation of this is a helical magnetic field geometry, as is expected from jet formation models (e.g. McKinney & Blandford, 2009), but any other magnetic field structure which varies systematically in orientation across the jet is possible. We note that the sign of Stokes V for PKS B2126–158 is the same as observed 15 years ago (Rayner, 2000). Although we cannot say that it has not reversed sign an even number of times in the intervening years, a constant CP sign would be consistent with previous observations of other sources which have no evidence for a change in the sign of Stokes over decades (Homan et al., 2011). A preferred handedness of the CP (sign of Stokes ) is a strong indication that there is a significant component of vector-ordered poloidal field along the jet axis. Hence, CP generated from LP in a jet with a helical magnetic field, as described in detail by Gabuzda et al. (2008), is very plausible. In such a model, the CP sign can be used to infer the magnetic polarity of the jet which in turn can indicate the direction of the accretion flow and/or black-hole spin (Enßlin, 2003; Gabuzda et al., 2008).
In order to derive some quantitative numbers, we begin with the work of Kennett & Melrose (1998), who defined the term relativistic rotation measure (RRM) to characterise the relativistic particles and magnetic field within the jet that generates CP through Faraday conversion. Considering a jet in approximate equipartition, they find rad m-3, where is the path length through the jet. In the case of a purely relativistic plasma, of either electron-proton or electron-position composition, we expect in the optically-thin regime (Macquart et al., 2000). Fitting this relation to our data from 8 to 10 GHz, we find rad m-3, which allows us to estimate a jet magnetic field strength 30 mG assuming a jet width of 1 pc. We consider this magnetic field strength reasonably robust since changing the jet width by an order of magnitude only changes the magnetic field estimate by a factor of .
Using standard synchrotron theory and assuming that there is a single jet feature dominating the emission, we can estimate the angular size of the emission region using the equations listed in Marscher (1987). At unity optical depth, the magnetic field strength can be estimated using
| (1) |
where Jy is the measured flux at the turnover frequency of GHz, is the angular size of the emission region in milli-arcseconds, (Marscher, 1983), is the redshift and is the Doppler boosting factor. Using mG and (Ghisellini et al., 2010), we find mas. Importantly, this is consistent with our assumption that the emission is dominated by a single, compact component near the base of the jet. Furthermore, we can predict that observations with the VLBA at 22 GHz and higher should be able to resolve this emission feature. The formulation of Marscher (1983) also allows us to independently compare the energy density in the relativistic electrons () with the energy density in the magnetic field (). We find , showing that the equipartition magnetic field estimated through the RRM formulation is roughly consistent with the well-tested synchrotron theory. Intrinsic CP from synchrotron emission () is likely to contribute a small amount to the total observed CP level for a magnetic field strength of 30 mG. However, it is interesting to note that even if the jet magnetic field was completely uniform, which is highly unlikely given the low observed levels of LP, then the intrinsic CP generation mechanism would still not be able to reproduce the observed CP of 1% at 5.7 GHz (, where is the Lorentz factor of the radiating electrons).
In order to test the Faraday rotation-driven and magnetic-twist conversion models, we use the relevant equations (e.g., Wardle et al., 1998; Ruszkowski & Begelman, 2002; Wardle & Homan, 2003; Homan et al., 2009, and references therein) describing the relationship between the linear and circular polarisations in a partially ordered field. For small optical depths, we have
| (2) |
where is the Faraday rotation depth and is the Faraday conversion depth of the jet, which are described by the equations (ignoring some factors of order unity)
| (3) |
and
| (4) |
where is the lower cutoff in the relativistic particle energy spectrum and is the fraction of uniform magnetic field along the jet axis. To generate from through Faraday conversion requires rad m-2 at unity optical depth (), where we have GHz, mG and . Such a large Faraday depth model is inconsistent with our observations since we find (using the observed RM of rad m-2 in the frequency range from 4.5 to 6.5 GHz). We note that the simple scalings listed above do not hold in all cases, therefore, more detailed simulations are required before discarding such a model. For example, significant levels of CP can occur from anisotropic turbulence in the jet, where the anisotropy is created from a net poloidal magnetic flux, and conversion of LP to CP can occur over very small length scales in the jet due to very large internal Faraday rotation (Ruszkowski & Begelman, 2002; Beckert & Falcke, 2002). In this model, significant depolarisation of the linear polarization can occur, resulting in the CP exceeding the LP in some cases. For example, Ruszkowski & Begelman (2002) were still able to produce a CP excess of 5 in their model for Sgr A∗ with and no addition of cold electrons to the jet.
A second scenario worth considering is where some of the Faraday rotation is external to the jet and variations in the RM () about the mean observed value cause depolarization of the linearly polarized emission. Assuming random fluctuations in the magnetic field and/or electron density external to the jet leads to depolarisation described by (Burn, 1966), where is the intrinsic degree of linear polarization in the jet. Using , which we consider typical of a synchrotron self-absorbed VLBI core (Lister & Homan, 2005), we require rad m-2 to observe at 5.7 GHz. While such a seemingly large dispersion in RM may be surprising, large spatial variations in RM of order of thousands of rad m-2 are not uncommon in the innermost regions of AGN jets (e.g., Attridge et al., 2005; Algaba et al., 2011; Algaba, 2013). We can now obtain more easily from Faraday conversion of the fraction linear polarisation, , within the jet, with and . The Faraday depth of the jet is now approximately a factor of 2 greater than the observed value, however, a small number of reversals of the line-of-sight magnetic field through the jet could bring this in line with the observations. In summary, this model remains consistent with the observations assuming the CP is generated through Faraday rotation-driven conversion by the low energy end of the relativistic electron energy spectrum and some depolarisation of the LP also occurs external to the jet.
The third main case to consider is one in which the internal Faraday rotation is completely suppressed due to the jet being composed of equal numbers of electrons and positrons (Enßlin, 2003). The observed CP must then be generated through conversion from LP due a systematic twist in the jet magnetic field (e.g., a helical magnetic field), with the process being mathematically identical to Faraday rotation-driven conversion at a single frequency (cf Enßlin, 2003). Such a model is difficult to constrain since all the observed Faraday rotation (and frequency-dependent depolarisation of the LP) must be external to the jet. For PKS B2126-158, we found the observed RM scales with frequency in a similar manner to what is expected for Faraday rotation internal to the jet (Section 3.2). Therefore, in this case the external RM would most likely come from a mixing layer/sheath surrounding the jet where the product scales in the same manner with distance from the base of the jet as expected from internal Faraday rotation. Overall, the frequency dependent properties of the CP is one of the main aspects in which this model can differ observationally from the Faraday rotation-driven conversion case. For example, in the case of a helical magnetic field the magnitude of the CP depends only on , and is therefore expected to decrease more slowly with increasing frequency than in the Faraday rotation-driven case, which depends on the product (Enßlin, 2003; Homan et al., 2009).
The observed steep frequency dependence of above the turnover in Stokes (from 8 to 10 GHz) means that there are little or no thermal electrons mixed in with the relativistic plasma in the jet, as already discussed. Additional observational constraints and detailed jet simulations are required to determine the fraction of relativistic electrons to positrons and protons in the jet. Below the turnover (from 1.5 to 6.5 GHz), we attempt a qualitative description of the frequency dependence of using a simple conical jet model (Blandford & Königl, 1979; Wardle & Homan, 2003). Considering conservation of magnetic flux in such a model, the uniform component of the magnetic field along the jet axis () will decay as , while the fluctuating component of the field () will decay as for a conical jet in equipartition (e.g., Ruszkowski & Begelman, 2002). Using Eqn. 3, we see that and for relativistic electrons radiating at a particular frequency, . For a constant or slowly changing along the jet, , while . Therefore, in the optically thick regime, the degree of CP will increase with increasing frequency as observed from 1.5 to 6.5 GHz. Our fitted result of could be obtained for slight variations in these scalings. For example, if the fluctuating component of the magnetic field falls off slightly faster with distance from the base of the jet (e.g., for ).
Recently, Homan et al. (2009) studied the full radio polarization spectra of the quasar 3C 279 () at high spatial resolution with the Very Long Baseline Array (VLBA). They used numerical radiative transfer simulations to test various jet models for production of CP that also remained consistent with the LP and total intensity emission. They found the Stokes core flux of 3C 279 () had an inverted spectrum with from 8 to 24 GHz (similar to PKS B2126–158 from 1 to 3 GHz) while the fractional CP reached 1% at 24 GHz with to 3%. Through an extensive parameter-space search, they found a model consistent with all the observed data that implies the CP is most likely generated from a combination of intrinsic CP and conversion from Faraday rotation internal to the jet. From figure 10 of Homan et al. (2009) we see that the expected CP varies from at 8 GHz to at 24 GHz leading to a CP spectral index of . This is consistent with our measured value of from 1.5 to 6.5 GHz (or 6 to 28 GHz in the rest frame of PKS B2126–158). The application of similar radiative transfer simulations to the jet emission properties of PKS 2126–158 is required to determine if the CP generation mechanism is indeed similar to that of 3C 279. We also need to understand why such large fractional CP is generated in these sources compared to the rest of the radio-loud AGN population, which typically have (Homan & Lister, 2006).
4 Conclusions
From broadband radio spectropolarimetric observations with the Australia Telescope Compact Array (ATCA), we have obtained full-Stokes measurements of the quasar, PKS B2126–158, from 1 to 10 GHz. We find that the Stokes spectrum has a peak flux of Jy at a turnover frequency GHz with an inverted spectral index of below the turnover and a steep spectral index above the turnover. Left-circularly polarized emission is detected at high significance across the entire band. The measured Stokes has a consistent sign and varies smoothly across the band, with a maximum Stokes mJy at 6.5 GHz (), before the spectrum turns over somewhere between 6.5 and 8 GHz. Our detection exhibits the same sign as found 15 years ago by Rayner (2000), who obtained at 4.8 GHz.
From comparison of the integrated flux with high spatial resolution VLBI images, we conclude that there is no significant amount of flux on intermediate angular scales and that effectively all the emission comes from the compact inner jet regions (on scales mas). Hence, our fractional linear polarization () and circular polarization (CP) data should be equivalent to that obtained from VLBI images at the same frequencies. The LP is clearly anti-correlated with the CP, with the degree of CP , where . This is the first time such a relation has been observed and clearly indicates the action of Faraday conversion of LP to CP within the jet.
By fitting a power-law to the frequency variation in the degree of CP above the turnover, we find a very steep CP spectral dependence, , which is consistent with the prediction of for conversion of linear polarization (LP) to CP by purely relativistic particles and magnetic fields within the jet (i.e., no thermal plasma within the jet). Below the turnover we find . The increase of with frequency in the optically thick regime is easily understood considering the frequency-dependent location of the emission in which higher frequency observations probe further upstream in the jet where the uniform component of the magnetic field is stronger and, hence, the amount of due to both Faraday conversion and intrinsic CP is larger.
Overall, our results conclusively favour Faraday conversion of LP to CP
within the jet as the dominant CP generation mechanism in this source.
We are unable to uniquely constrain whether the conversion is achieved
by Faraday rotation within the jet dominated by the low energy end of the
relativistic electron energy spectrum, or by a change in the orientation of the
perpendicular component of a vector-ordered magnetic field through the jet
(e.g. a helical magnetic field).
Three different scenarios are discussed:
1. Very large amounts of internal Faraday
rotation could naturally produce the large CP-to-LP ratios of 0.5 to 10 across our
observed frequency range, but this appears inconsistent with our RM measurements.
2. Considering our measured RM as being composed of some internal and
external components, we can obtain the observed levels of CP at
due to Faraday rotation-driven conversion, with the fraction of uniform magnetic
field along the jet axis and a low energy cut-off in the relativistic
electron energy spectrum of .
3. If all the observed Faraday rotation is external to the jet, then we require
large spatial gradients in the external RM distribution to strongly depolarise
the LP emission. Conversion of LP to CP within the jet is then achieved solely by
a systematic twist in the magnetic field through an electron-positron jet.
The observed low levels of LP and frequency dependence of the magnitude of the RM favour a model in which there is some contribution of internal Faraday rotation. This leads us to suggest that Faraday rotation-driven conversion by the low energy end of the relativistic electron energy spectrum, in a mainly electron-proton jet with 10% uniform magnetic flux along the jet axis, as the most likely explanation for the observed levels of CP in this source. Future work requires detailed numerical, polarized, radiative transfer simulations in conjunction with realistic internal and external Faraday rotation models to consistently explain the full-Stokes emission from PKS B2126–158 and its variation across the entire observed frequency range.
5 Acknowledgements
The Australia Telescope Compact Array is part of the Australia Telescope, which is funded by the Commonwealth of Australia for operation as a National Facility managed by CSIRO. S.O’S and B.M.G. acknowledge the support of the Australian Research Council through grants FS100100033 and FL100100114, respectively. The authors wish to thank J. P. Macquart for useful discussions as well as M. A. Lara-López for help with the figures. We also thank the referee, John Wardle, for helpful comments and discussion which significantly improved this paper. This research has made use of NASA’s Astrophysics Data System Service and the NASA/IPAC Extragalactic Database (NED) which is operated by the Jet Propulsion Laboratory, California Institute of Technology, under contract with the National Aeronautics and Space Administration. This research has also made use of the SIMBAD database, operated at CDS, Strasbourg, France.
References
- Algaba (2013) Algaba J. C., 2013, MNRAS, in press, arXiv:1212.3423
- Algaba et al. (2011) Algaba J. C., Gabuzda D. C., Smith P. S., 2011, MNRAS, 411, 85
- Aller & Aller (2012) Aller H. D., Aller M. F., 2012, BAAS, 220, 335.20
- Attridge et al. (2005) Attridge J. M., Wardle J. F. C., Homan D. C., 2005, ApJ, 633, L85
- Beckert & Falcke (2002) Beckert T., Falcke H., 2002, A&A, 388, 1106
- Begelman et al. (1984) Begelman M. C., Blandford R. D., Rees M. J., 1984, Reviews of Modern Physics, 56, 255
- Bicknell et al. (1997) Bicknell G. V., Dopita M. A., O’Dea C. P. O., 1997, ApJ, 485, 112
- Blandford & Königl (1979) Blandford R. D., Königl A., 1979, ApJ, 232, 34
- Blandford & Payne (1982) Blandford R. D., Payne D. G., 1982, MNRAS, 199, 883
- Blandford & Znajek (1977) Blandford R. D., Znajek R. L., 1977, MNRAS, 179, 433
- Broderick & Loeb (2009) Broderick A. E., Loeb A., 2009, ApJ, 703, L104
- Burn (1966) Burn B. J., 1966, MNRAS, 133, 67
- Celotti et al. (1998) Celotti A., Kuncic Z., Rees M. J., Wardle J. F. C., 1998, MNRAS, 293, 288
- Charlot et al. (2010) Charlot P., Boboltz D. A., Fey A. L., Fomalont E. B., Geldzahler B. J., Gordon D., Jacobs C. S., Lanyi G. E., Ma C., 2010, AJ, 139, 1713
- D’Odorico et al. (1998) D’Odorico V., Cristiani S., D’Odorico S., Fontana A., Giallongo E., 1998, A&AS, 127, 217
- Enßlin (2003) Enßlin T. A., 2003, A&A, 401, 499
- Farnsworth et al. (2011) Farnsworth D., Rudnick L., Brown S., 2011, AJ, 141, 191
- Fomalont et al. (2000) Fomalont E. B., Frey S., Paragi Z., Gurvits L. I., Scott W. K., Taylor A. R., Edwards P. G., Hirabayashi H., 2000, ApJS, 131, 95
- Gabuzda et al. (2008) Gabuzda D. C., Vitrishchak V. M., Mahmud M., O’Sullivan S. P., 2008, MNRAS, 384, 1003
- Ghisellini et al. (2010) Ghisellini G., Della Ceca R., Volonteri M., Ghirlanda G., Tavecchio F., Foschini L., Tagliaferri G., Haardt F., 2010, MNRAS, 405, 387
- Hodge (1982) Hodge P. E., 1982, ApJ, 263, 595
- Homan et al. (2001) Homan D. C., Attridge J. M., Wardle J. F. C., 2001, ApJ, 556, 113
- Homan & Lister (2006) Homan D. C., Lister M. L., 2006, AJ, 131, 1262
- Homan et al. (2009) Homan D. C., Lister M. L., Aller H. D., Aller M. F., Wardle J. F. C., 2009, ApJ, 696, 328
- Homan et al. (2011) Homan D. C., Lister M. L., MOJAVE 2011, BAAS, 43, 310.03
- Homan & Wardle (1999) Homan D. C., Wardle J. F. C., 1999, AJ, 118, 1942
- Homan & Wardle (2004) Homan D. C., Wardle J. F. C., 2004, ApJL, 602, L13
- Jauncey et al. (1978) Jauncey D. L., Wright A. E., Peterson B. A., Condon J. J., 1978, ApJL, 223, L1
- Jones (1988) Jones T. W., 1988, ApJ, 332, 678
- Jones & O’Dell (1977) Jones T. W., O’Dell S. L., 1977, ApJ, 215, 236
- Jorstad et al. (2005) Jorstad S. G., Marscher A. P., Lister M. L., Stirling A. M., Cawthorne T. V., Gear W. K., Gómez J. L., Stevens J. A., Smith P. S., Forster J. R., Robson E. I., 2005, AJ, 130, 1418
- Kennett & Melrose (1998) Kennett M., Melrose D., 1998, PASA, 15, 211
- Komesaroff et al. (1984) Komesaroff M. M., Roberts J. A., Milne D. K., Rayner P. T., Cooke D. J., 1984, MNRAS, 208, 409
- Legg & Westfold (1968) Legg M. P. C., Westfold K. C., 1968, ApJ, 154, 499
- Lister & Homan (2005) Lister M. L., Homan D. C., 2005, AJ, 130, 1389
- Macquart (2002) Macquart J.-P., 2002, PASA, 19, 43
- Macquart & Fender (2004) Macquart J.-P., Fender R. P., eds, 2004, Circular Polarisation from Relativistic Jet Sources. Kluwer Academic Publishers, Dordrecht.
- Macquart et al. (2000) Macquart J.-P., Kedziora-Chudczer L., Rayner D. P., Jauncey D. L., 2000, ApJ, 538, 623
- Macquart & Melrose (2000) Macquart J.-P., Melrose D. B., 2000, ApJ, 545, 798
- Marscher (1983) Marscher A. P., 1983, ApJ, 264, 296
- Marscher (1987) Marscher A. P., 1987, in Zensus J. A., Pearson T. J., eds, Superluminal Radio Sources. Vol. 280. Cambridge Univ. Press
- McKinney & Blandford (2009) McKinney J. C., Blandford R. D., 2009, MNRAS, 394, L126
- Meier (2009) Meier D. L., 2009, in Hagiwara Y., Fomalont E., Tsuboi M., Murata Y., eds, Approaching Micro-Arcsecond Resolution with VSOP-2: Astrophysics and Technology. Vol. 402. ASP Conf. Ser., San Francisco, p. 342
- Melrose (1972) Melrose D. B., 1972, PASA, 2, 140
- Mutel et al. (1985) Mutel R. L., Hodges M. W., Phillips R. B., 1985, ApJ, 290, 86
- Osmer et al. (1994) Osmer P. S., Porter A. C., Green R. F., 1994, ApJ, 436, 678
- O’Sullivan et al. (2012) O’Sullivan S. P., Brown S., Robishaw T., Schnitzeler D. H. F. M., McClure-Griffiths N. M., Feain I. J., Taylor A. R., Gaensler B. M., Landecker T. L., Harvey-Smith L., Carretti E., 2012, MNRAS, 421, 3300
- O’Sullivan & Gabuzda (2009) O’Sullivan S. P., Gabuzda D. C., 2009, MNRAS, 393, 429
- Pacholczyk (1973) Pacholczyk A. G., 1973, MNRAS, 163, 29
- Porth et al. (2011) Porth O., Fendt C., Meliani Z., Vaidya B., 2011, ApJ, 737, 42
- Rayner (2000) Rayner D. P., 2000, PASA, 17, 284
- Rayner et al. (2000) Rayner D. P., Norris R. P., Sault R. J., 2000, MNRAS, 319, 484
- Ruszkowski & Begelman (2002) Ruszkowski M., Begelman M. C., 2002, ApJ, 573, 485
- Saikia & Salter (1988) Saikia D. J., Salter C. J., 1988, ARA&A, 26, 93
- Sault et al. (1995) Sault R. J., Teuben P. J., Wright M. C. H., 1995, in R. A. Shaw, H. E. Payne, & J. J. E. Hayes ed., Astronomical Data Analysis Software and Systems IV Vol. 77 of ASP Conference Series. p. 433
- Scott et al. (2004) Scott W. K., Fomalont E. B., Horiuchi S., Lovell J. E. J., Moellenbrock G. A., Dodson R. G., Edwards P. G., Coldwell G. V., Fodor S., 2004, ApJS, 155, 33
- Stanghellini (2003) Stanghellini C., 2003, PASA, 20, 118
- Stanghellini et al. (1998) Stanghellini C., O’Dea C. P., Dallacasa D., Baum S. A., Fanti R., Fanti C., 1998, A&AS, 131, 303
- Taylor et al. (2009) Taylor A. R., Stil J. M., Sunstrum C., 2009, ApJ, 702, 1230
- Tingay et al. (2003) Tingay S. J., Jauncey D. L., King E. A., Tzioumis A. K., Lovell J. E. J., Edwards P. G., 2003, PASJ, 55, 351
- Tzioumis et al. (2002) Tzioumis A., King E., Morganti R., Dallacasa D., Tadhunter C., Fanti C., Reynolds J., Jauncey D., Preston R., 2002, A&A, 392, 841
- Valtaoja (1984) Valtaoja E., 1984, A&SS, 100, 227
- Vitrishchak et al. (2008) Vitrishchak V. M., Gabuzda D. C., Algaba J. C., Rastorgueva E. A., O’Sullivan S. P., O’Dowd A., 2008, MNRAS, 391, 124
- Walker et al. (2000) Walker R. C., Dhawan V., Romney J. D., Kellermann K. I., Vermeulen R. C., 2000, The Astrophysical Journal, 530, 233
- Wardle & Homan (2003) Wardle J. F. C., Homan D. C., 2003, A&SS, 288, 143
- Wardle et al. (1998) Wardle J. F. C., Homan D. C., Ojha R., Roberts D. H., 1998, Nature, 395, 457
- Wardle & Kronberg (1974) Wardle J. F. C., Kronberg P. P., 1974, ApJ, 194, 249
- Weiler & de Pater (1983) Weiler K. W., de Pater I., 1983, ApJS, 52, 293
- Wilson et al. (2011) Wilson W. E., Ferris R. H., Axtens P., Brown A., Davis E., Hampson G., Leach M., Roberts P., Saunders S., 2011, MNRAS, 416, 832