Devasthal Fast Optical Telescope observations of Wolf-Rayet dwarf galaxy Mrk 996
Abstract
The Devasthal Fast Optical Telescope (DFOT) is a 1.3 meter aperture optical telescope, recently installed at Devasthal, Nainital. We present here the first results using an H filter with this telescope on a Wolf-Rayet dwarf galaxy Mrk 996. The instrumental response and the H sensitivity obtained with the telescope are and respectively. The H flux and the equivalent width for Mrk 996 are estimated as and 96 respectively. The star formation rate is estimated as yr-1. Mrk 996 deviates from the radio-FIR correlation known for normal star forming galaxies with a deficiency in its radio continuum. The ionized gas as traced by H emission is found in a disk shape which is misaligned with respect to the old stellar disk. This misalignment is indicative of a recent tidal interaction in the galaxy. We believe that galaxy-galaxy tidal interaction is the main cause of the WR phase in Mrk 996.
keywords:
galaxies : dwarf – galaxies : individual (Mrk 996) – galaxies : ISM – galaxies : starburst – galaxies : star formation rate – ISM : H1 Introduction
Wolf-Rayet (WR) galaxies are a special type of star-burst galaxies where an episode of massive star formation is only a few Myr old (Schaerer et al. 1999). These galaxies are a subset of H ii galaxies, whose integrated spectra show broad emission lines (mainly He ii 4686 and C iv 5808; also N and O) attributed to a presence of WR stars (Conti 1991). The strengths of these emission lines indicate a substantial population ( - ) of WR stars. The most massive O-type stars () go through the WR phase a few Myr after their birth, spending only a short time ( Myr) in this phase until they explode as supernovae (Meynet & Maeder 2005). Therefore, WR galaxies offer an opportunity to study phenomena associated with the very early phases as well as the triggering mechanisms of massive star-formation in galaxies. WR galaxies are quite rare in nearby universe essentially because of the short life-time of WR stars. The most extensive catalog to date of WR galaxies, containing 570 galaxies was compiled by Brinchmann et al. (2008) based on a search through the SDSS (Sloan Digital Sky Survey) data release 6. These authors find that WR phase is found in almost all the morphological types ranging from low-mass, blue compact low-metallicity dwarf galaxies to massive spirals, luminous mergers, IRAS galaxies and Seyfert galaxies.
In this paper, H observations of Mrk 996 are presented using the newly installed 1.3m Devasthal Fast Optical Telescope (DFOT) near Nainital in India. Mrk 996 ( km s-1) belongs to a relatively rare class of nE BCDs (Blue Compact Dwarfs). The nE BCDs have a clearly defined nucleus (n) within an elliptical (E) halo. The BCDs are galaxies fainter than mag (), with size less than 1 kpc, and having strong emission lines superposed on a blue continuum (Thuan & Martin 1981). Mrk 996 has a disk structure with a small scale length (0.4 kpc) and spiral arms confined in the inner 160 pc. The faint diffuse envelope of this galaxy shows a distinct asymmetry, being more extended to the northeast side than to the southwest side. There is also an asymmetry in the spatial distribution of globular clusters around Mrk 996, where majority of them are found to the south of the galaxy. It has been considered as an indication of a tidal interaction or a past merger event (Thuan et al. 1996; hereafter Th96). The metallicity of Mrk 996 from its Oxygen abundance measurement has been estimated as solar ( (O/H)=8.0) by Th96. Mrk 996 has significantly larger N/O ratio than that in other BCDs having similar Oxygen abundances. This enhanced Nitrogen is explained by Pustilnik et al. (2004) as a result of some recent merger which caused the WR phase in the galaxy.
The nebular H emission from H ii regions is one of the fundamental indicators of the current( Myr) star-formation activity in galaxies (Kennicutt 1998; hereafter K98). Since the H luminosity is proportional to the number of ionizing photons produced by hot and massive stars which is in turn proportional to their birth rate, the star formation rate (SFR) can be derived from the H luminosity. As only young (lifetime Myr), massive () stars contribute significantly to the ionizing flux, the H emission traces very recent star formation in galaxies. We note that the scaling between the H flux and the SFR depends on the metallicity and the IMF of the stellar population. The calibration provided in K98 is for a Salpeter IMF and solar metallicity. The nebular H line being amongst the strongest emission lines in a galaxy, makes it as the preferred tracer for star formation in all types of galaxies at optical wavelengths. Narrow band H photometric imaging is the best method to get an accurate estimate of the total H flux. Slit spectroscopy on the other hand can not provide total H flux as it normally samples a galaxy only over a small region. However, spectroscopic observations can provide vital information on line ratios which are essential to estimate extinction and temperature in the ionized regions. The H flux in all cases needs to be corrected for Galactic and internal extinction, stellar continuum and other emission line contaminations in the passbands. These corrections are model based and require spectroscopic data.
2 Observations and Results
The observations were carried out in the H narrow-band ( = 6570 , FWHM ) and the SDSS r-band ( = 6250 , FWHM ) using the 1.3 meter DFOT at Devasthal (longitude E, latitude N, altitude 2420 m above the mean sea level), near Nainital in the central Himalayan region in India. The main advantages of the Devasthal site are its dark sky, reasonably good average seeing and low extinction (Sagar et al. 2010). A brief discussion on the telescope is presented in Sagar et al. 2011. The telescope is equipped with low noise and fast readout Charge- Coupled Devices (CCD) detectors and high transmission optical filters. This telescope uses the Ritchey-Chretien optical configuration with an f/4 Cassegrain focus providing a plate scale of mm-1. The telescope mount is of the fork-equatorial type, which requires rotation on only one axis while tracking celestial sources. The telescope can be pointed to a celestial object with an accuracy of rms. The mechanical system provides a tracking accuracy of nearly over 10-min for zenith angle 0 to 40 degree without an external guider. The data on Mrk 996 were recorded on a CCD camera having pixels, 13.5 micron pixel size, back-illuminated, and thermoelectrically cooled to -80∘ C. The CCD covers a field of view on the sky. The CCD chip has QE of 90% between nm and falls off to 50% at 400 and 900 nm. The CCD read noise is measured as 6.9 rms at 1 MHz read out rate with a gain of 2 .
The observations were carried out on the dark (new moon) night of November 25, 2011. These observations were made in the middle of servicing the telescope and therefore the optical system was not perfectly aligned. It might also be possible that many thermal sources inside the building were not minimized and hence image quality is not expected to be the best. Three H frames of 600 sec each, five SDSS r-band frames of 300 sec each of the galaxy Mrk 996 and four frames (at different airmasses) of the standard spectrophometric star Feige 34 (Oke 1990) were recorded. The standard star is used to obtain the photometric calibration and also the atmospheric extinction parameters.
CCD data reduction was performed using the package CCDRED in the Image Reduction and Analysis facility (IRAF) software developed by National Optical Astronomy Observatory. The dark current in the CCD detector at ∘ C is negligible () compared to the sky background and hence dark frames were not recorded. After removing the cosmic ray events, all the aligned frames for each color filter were added to get the final image. The images were registered in the J2000 epoch equatorial coordinate system using the Two Micron All Sky Survey (2MASS) images. The underlying stellar continuum in the H filter is subtracted using the standard procedure given by Waller (1990) and Spector et al. (2012). The Wide to Narrow Continuum Ratio (WNCR) is determined using non-saturated, non-variable field stars in the CCD image. The average WNCR is determined as . The WNCR value is used to scale down the r-band image such that counts per second of field stars in the r-band and in the H-band are almost identical. Since both the H and the r-band images were taken on the same night and in almost same seeing conditions, there was no need for any deconvolution. The continuum subtracted H image is obtained by subtracting the scaled r-band image from the H -band image. The aperture photometry of the star forming region in the continuum subtracted H image was performed using the DAOPHOT package in IRAF.
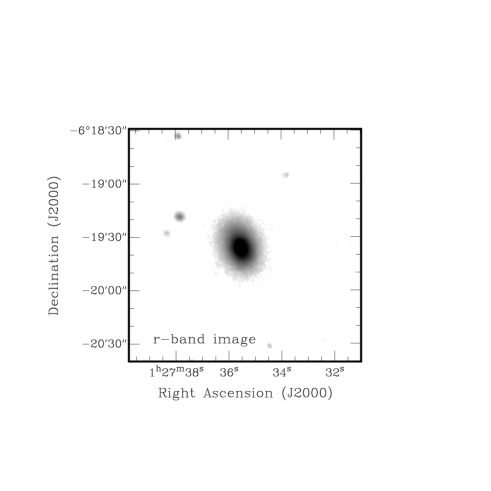
The underlying stellar continuum emission mapped by the r-band image and the ionized Hydrogen gas (star forming region) mapped by the continuum subtracted H image are shown in Fig. 1. It can be seen that flux from majority of stars has been completely removed in the H image. Residual flux can be seen around a few stars, which are confirmed as variable stars in the present analysis. The FWHM on star images was found to be nearly . This FWHM is not a true representative of the atmospheric seeing as these observations were made in sub-optimal conditions in the observatory. The atmospheric extinction is determined as 0.15 mag airmass-1 in the r-band. The sky brightness as determined from the SDSS r-band image is found to be 20.2 mag arcsec-2.
Using the calibrated spectrum of the standard spectrophotometric star, the mean instrumental response is estimated as . This also includes the effect of the atmospheric extinction during the observations, and hence this value may vary slightly from night to night. The H surface brightness sensitivity () in 30 minutes of observations is obtained as . This sensitivity is equivalent to an emission measure of 38.
The calibrated H flux is corrected for the narrowband filter transmission at the wavelength of H emission from the galaxy. The H line emission from Mrk 996 () will be at 6598.5 . Furthermore, for a telescope with a focal ratio number , the central wavelength of a narrowband filter will be shifted towards the lower wavelength side by an amount , where is the central wavelength and is the effective refractive index of the interference filter. Therefore, for this telescope with a f-number 4 and taking the effective refractive index of the narrowband H filter as 1.7, the shift in the central wavelength of the H filter at 6570 is found to be 9. The H flux is therefore divided by i.e. 0.56, where is the narrowband filter transmission at the H emission wavelength from Mrk 996. This operation corrects the line flux from the decreased filter transmission at the H wavelength corresponding to the redshift of the galaxy and the telescope focal ratio. The above correction is valid under the condition that the H filter transmission curve is a Gaussian and the H line emission from galaxy is narrow compared to the bandwidth of the filter. Both of these conditions are met in the present case. The raw H flux from Mrk 996 is estimated as . This flux is in good agreement with that estimated by Gil de Paz et al. (2008), where H flux was found as . Our estimate of the H flux is further corrected for line contaminations, Milky-way extinction, internal extinction, stellar continuum and the underlying stellar absorption. These corrections are described in the next section.
The H equivalent width, defined as the ratio of H flux and specific continuum flux at the wavelength of H emission, is obtained following the standard procedure given by Spector et al. (2012). The specific continuum flux is total continuum flux minus H line contribution within the H filter divided by its area (). The flux within the H filter is derived from the aperture photometry of the H band image using the same circular aperture as that used to get the H line flux. Here, the underlying galaxy background in the narrowband image is estimated immediately next to that circular aperture. The H equivalent width obtained using this method has been corrected for underlying stellar absorption by adding an expected value of H stellar absorption equivalent width following McCall et al. (1985). The H equivalent width for Mrk 996 is estimated to be , in good agreement with the previous estimate of 109 by Gil de paz et al. (2008).
3 Corrections to H flux
3.1 Line contamination in filter passbands
The narrowband (Hα) filter contains significant flux from [NII] 6584 line. The wideband (r) filter, in addition, will contain significant flux from HeII 6678, [SII] 6717 and [SII] 6731 emission lines apart from the H 6563 line. It should be noted that the H line itself is a contaminating line in the SDSS r-band for estimating continuum flux. The H line flux can be corrected for these line contaminations using the following relations over two steps:
| (1) |
| (2) |
where the flux ratios for each emission line in the wide-band filter are taken from the spectroscopic analysis of Mrk 996 by Th96. These ratios are provided in Table 1. Here, and are the transmissions in the narrowband (H) and the wideband (SDSS-r) filters respectively at the wavelength of emission line . The eqs. 1 and 2 take care of line contaminations in H and SDSS r-band filters respectively. The index superscript in flux values (F) is indicative of each step of correction applied to the H flux.
| Line | |||
|---|---|---|---|
| [N ii] 6584 | 0.0567 | 0.1 | 0.92 |
| He i 6678 | 0.0142 | 0.001 | 0.92 |
| [S ii] 6717 | 0.0197 | 0.0003 | 0.92 |
| [S ii] 6731 | 0.0195 | 0.0003 | 0.92 |
The estimate of the H flux is modified to 47, corrected for contaminating emission lines in the H and SDSS-r passbands. Coincidentally, the modified value of flux is not too different from the un-corrected flux because (H + other lines) contamination in the broadband filter is roughly similar to the line contamination in the H filter.
3.2 Extinction correction
The H flux is decreased by extinction caused by the Milky-way. The extinction value is mag in the direction of Mrk 996 in the SDSS r-band taken from the NASA/IPAC Extragalactic Database (NED) based on Schlafly & Finkbeiner (2011) recalibration of the Schlegel, Finkbeiner & Davis (1998) extinction map. The H flux is modified to 51 after this correction.
The H flux also suffers from intrinsic extinction because of dust within the host galaxy. The H flux can be corrected for the intrinsic extinction using the relation given by Lopez-Sanchez & Esteban (2008) assuming Cardelli et al. (1989) extinction law with . In the present case, the internal extinction coefficient is using the Balmer line ratios taken from Th96. After applying this correction, the H flux becomes 120 . It should be noted that the central region of Mrk 996 is highly obscured as evident from the value.
3.3 Continuum slope correction
The continuum spectrum of Mrk 996 (c.f. Th96) is not flat within the bandwidths of SDSS-r and H filters. The slope of the galaxy spectrum is such that the continuum emission within the r-band will be marginally greater than that in the H band.
It implies that in the continuum subtraction () process, higher value of galaxy continuum has been removed from the H band image, resulting in an underestimation of H flux. If (; being the continuum flux at a particular wavelength) is the fractional decrease in continuum per unit wavelength increment, is the central peak wavelength of wideband filter and is red-shifted H wavelength for the galaxy, then the corrected H flux can be approximated by:
| (3) |
The value of for Mrk 996 is found as 2 . This correction brings the H flux to a value of 128 .
3.4 Underlying stellar absorption correction
The massive stellar content (O, B, and A stars) in starburst galaxies dominate the continuum emission. These stars have strong Hydrogen Balmer absorption lines in their spectrum (Walborn & Fitzpatrick 1990). The equivalent width of stellar Balmer absorption line is smaller than that of nebular emission line at the same wavelength, therefore absorption features are completely masked in the optical spectra of galaxies (Gonzalez-Delgado et al. 1999). However, as the H emission from ionized gas is superimposed on the stellar absorption line at the same wavelength, it makes the H flux being underestimated. The H flux can be corrected for the underlying stellar absorption using the following relationship (Hopkins et al. 2003):
| (4) |
where the H underlying stellar absorption equivalent width () for HII galaxies is assumed as 3 (Gonzalez-Delgado et al. 1999) and the H emission line equivalent width () is taken from this paper. This correction makes the final H flux as 132 .
3.5 Errors in estimates
It is difficult to make an estimate of error in above corrections as uncertainties in flux corrections are largely unknown and model dependent. The instrumental (random) error makes the H flux estimates to be accurate within nearly 18%. Assuming that typical systematic error in each of the above corrections is of the order of 10%, the error in the corrected estimates are nearly 22%. If both types of errors are added in quadrature, the final error can be taken as nearly 28%. We therefore quote the final corrected H flux estimate for Mrk 996 from these observations and analyses as . At a distance of ( Mpc with km s-1 Mpc-1) to the galaxy, the luminosity is .
4 Discussions
4.1 Star Formation Rate in Mrk 996
The SFR can be calculated from H flux using the relation provided by K98:
| (5) |
This relation holds good for a Salpeter IMF with mass limits of 0.1 and 100 , and a stellar population with solar metallicity. Higher number of Lyman photons will be produced per unit stellar mass in low metallicity stars. Therefore, it is expected that K98 relation deviates in low metallicity systems such as dwarf galaxies, where SFR estimates based on K98 relation alone will be overestimated. Leitherer (2008) has estimated corrections to SFR in context of rotating and low metallicity massive stars. Based on these corrections, the star formation rate in Mrk 996 is predicted as yr-1. It should be noted that IMF has strong dependence on metallicity (cf. Zhang et al. 2007) in WR galaxies in the sense that higher number of massive stars are formed in low metallicity galaxies compared to that predicted from the Salpeter IMF. Therefore, overall SFR estimates using may require further corrections.
The above estimates of SFR can be compared against other indicators of SFR such as the radio continuum luminosity at GHz frequencies. Mrk 996 is detected at 1.4 GHz in the Faint Images of Radio Sky at Twenty-centimeter (FIRST) survey images with a flux density of mJy. The radio emission is seen primarily from the center of galaxy. This radio flux is far lower than the non-thermal radio emission expected (5 mJy) using Condon (1992) SFR-radio relationship for a normal star forming galaxy. We believe that the detected radio continuum in Mrk 996 is mainly thermal. This assumption is likely to be valid as supernova events have not taken place as evident from the presence of a large number of WR stars in the galaxy. Following the relation for Lyman continuum photons/SFR and thermal (free-free emission) radio flux (c.f. Caplan & Deharveng 1986, Condon 1992, Hunt et al. 2004), the star formation rate is predicted to be nearly yr-1, in good agreement with the overall SFR predicted from emission. It should be noted that compact and dense regions of star formation as in Mrk 996 may not be completely optically thin at 1.4 GHz and therefore SFR from radio continuum may be slightly underestimated.
4.2 Radio-FIR correlation
It is worthwhile to examine for Mrk 996 the radio-far infrared (FIR) correlation, known for normal star forming galaxies (Condon et al. 1991). Based on IRAS (Infra-Red Astronomical Satellite) detections at 60m and 100m with flux densities as 0.42 Jy and Jy respectively, and the flux estimate at 1.4 GHz from the FIRST image (Sect 4.1), the ratio of FIR luminosity to radio luminosity, the parameter (cf. Yun et al. 2001) is 3 for Mrk 996. The average value of for normal galaxies is . It implies that Mrk 996 deviates from the radio-FIR correlation and is significantly radio deficient. As discussed in the previous section, much of the radio continuum in Mrk 996 seems to be of thermal origin while that in normal star forming galaxies is mostly of the synchrotron origin, therefore the value once calculated for a synchrotron fraction alone would come out much higher for Mrk 996. Not many galaxies (10) with (i.e. with the highest radio deficiencies) are known (Roussel et al. 2003, Omar & Dwarakanath 2005). It is believed that high-q galaxies are seen at the very early phase of starburst following a long period of quiescence (Roussel et al. 2003). As Mrk 996 is a WR galaxy, the lack of supernova as discussed in the previous section is a plausible explanation for the deviation from the radio-FIR correlation. However, as the central region in Mrk 996 is highly obscured and ionized, the free-free absorption at 1.4 GHz may be significant. In absence of any radio spectral measurement available to us, it is not possible to examine this aspect any further in this paper. A more detailed analysis of radio-FIR correlation using multi-frequency radio and infrared data at different bands (such as Spitzer data) will be very useful and interesting.
4.3 Distribution of Ionized gas : evidence of minor merger
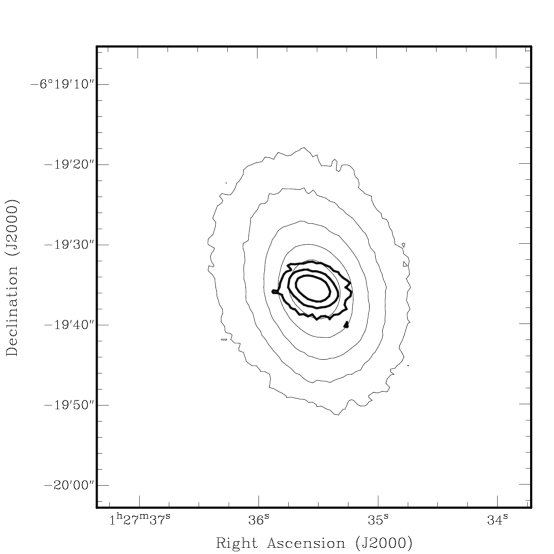
The H iso-intensity contours are overlaid on r-band contours in Fig. 2. It can be seen that H emission is smoothly distributed without any significant clumps or knots. It is also evident from Fig. 2 that the H disk is mis-aligned with the continuum stellar disk. This misalignment has not been reported earlier. The misalignment of the two disks is nearly . It is known that Mrk 996 has various asymmetries in its stellar continuum and globular cluster distribution, indicating a recent tidal interaction in the galaxy (Th96). It is quite possible that H and stellar continuum disk misalignment is a result of tidal interaction where a fresh supply of gas from outer regions has fallen towards the center thereby causing a starburst. It has been seen in simulations (e.g., Hernquist & Mihos 1995) that tidal interactions and minor mergers between galaxies can cause gas in the outer region to loose angular momentum and fall towards the centre of galaxy. This fresh supply of gas can be effectively converted to stars causing nuclear starburst (Mihos & Hernquist 1994). As the new gas can come with different angular momentum, it is not necessary that orbits of fresh gas are aligned with that of the old stellar disk (Eliche-Moral et al. 2011, Haynes et al. 2000). Therefore, we believe that the current phase of star-burst in Mrk 996 has resulted from a recent tidal encounter, most likely a minor merger with a low-mass companion.
5 Conclusions
H observations of a WR galaxy Mrk 996 have been reported here using the recently completed 1.3 meter telescope at Devasthal. The instrumental response with H filter is estimated as at atmospheric extinction of 0.15 mag/airmass. The ratio of SDSS r-band to H filter response is estimated as . The H image presented here reach surface brightness sensitivity () of , equivalent to an emission measure of 38 at in nearly 30 minutes of observation. The main conclusions on the WR galaxy Mrk 996 from these observations are the following —
-
•
The H flux from Mrk 996 is estimated as , corrected for extinction, line contaminations in the passbands and underlying stellar absorption.
-
•
The SFR from H flux corrected for the sub-solar metallicity of Mrk 996 is estimated as yr-1. This estimate is in good agreement with that indicated from the 1.4 GHz radio continuum emission, which is assumed to be entirely thermal.
-
•
Mrk 996 deviates from the radio-FIR correlation known for normal star forming galaxies. It is a radio deficient galaxy with a ’q’ value of 3.
-
•
The H emission is seen in a disk shape, misaligned by nearly from its old stellar disk. It implies fresh supply of gas to center is most likely due to a recent tidal interaction event. This tidal interaction is likely to be responsible for the WR phase in the galaxy.
Acknowledgments
SJ thanks Chrisphin Karthick for helps in the CCD data analysis. We thank Kuntal Misra for a careful reading of the manuscript and providing useful suggestions. We thank the referees for useful and constructive comments. This research has made use of the NASA/IPAC Extragalactic Database (NED) which is operated by the Jet Propulsion Laboratory, California Institute of Technology, under contract with the National Aeronautics and Space Administration. This research has made use of NASA’s Astrophysics Data System. We thank the staff of ARIES, whose dedicated efforts made these observations possible. DFOT is run by Aryabhatta Research Institute of Observational Sciences with support from the Department of Science and Technology, Govt. of India.
References
- [1] Brinchmann J., Kunth D., Durret F., 2008, A&A, 485, 657
- [2] Caplan J., Deharveng L., 1986, A&A, 155, 297
- [3] Cardelli J. A., Clayton G. C., Mathis J. S., 1989, ApJ, 345, 245
- [4] Condon J. J., Anderson M. L., Helou G., 1991, ApJ, 376, 95
- [5] Condon J. J., 1992, ARA&A, 30, 575
- [6] Conti P. S., 1991, ApJ, 377, 115
- [7] Eliche-Moral M. C., González-García A. C., Balcells M., Aguerri J. A. L., Gallego J., Zamorano J., Prieto M., 2011, A&A, 533, A104
- [8] Gil de Paz A., Madore B. F., Pevunova O., 2003, ApJS, 147, 29
- [9] González Delgado R. M., Leitherer C., Heckman T. M., 1999, ApJS, 125, 489
- [10] Haynes M. P., Jore K. P., Barrett E. A., Broeils A. H., Murray B. M., 2000, AJ, 120, 703
- [11] Hernquist L., Mihos J. C., 1995, ApJ, 448, 41
- [12] Hopkins A. M., et al., 2003, ApJ, 599, 971
- [13] Hunt L. K., Dyer K. K., Thuan T. X., Ulvestad J. S., 2004, ApJ, 606, 853
- [14] Kennicutt R. C., Jr., 1998, ARA&A, 36, 189
- [15] Leitherer C., 2008, IAUS, 255, 305
- [16] López-Sánchez Á. R., Esteban C., 2008, A&A, 491, 131
- [17] McCall M. L., Rybski P. M., Shields G. A., 1985, ApJS, 57, 1
- [18] Meynet G., Maeder A., 2005, A&A, 429, 581
- [19] Mihos J. C., Hernquist L., 1994, ApJ, 425, L13
- [20] Oke J. B., 1990, AJ, 99, 1621
- [21] Omar A., Dwarakanath K. S., 2005, JApA, 26, 89
- [22] Pustilnik S., Kniazev A., Pramskij A., Izotov Y., Foltz C., Brosch N., Martin J.-M., Ugryumov A., 2004, A&A, 419, 469
- [23] Roussel H., Helou G., Beck R., Condon J. J., Bosma A., Matthews K., Jarrett T. H., 2003, ApJ, 593, 733
- [24] Sagar R., Kumar B., Omar A., Pandey A. K., 2010, ASInC, 1, 203
- [25] Sagar R., Omar A., Kumar B., Gopinathan M., Pandey S. B., Bangia T., Pant J. S., Shukla V., Yadava S., 2011, Current Science, 101, 1020
- [26] Schaerer D., Contini T., Pindao M., 1999, A&AS, 136, 35
- [27] Schlafly E. F., Finkbeiner D. P., 2011, ApJ, 737, 103
- [28] Schlegel D. J., Finkbeiner D. P., Davis M., 1998, ApJ, 500, 525
- [29] Spector O., Finkelman I., Brosch N., 2012, MNRAS, 419, 2156
- [30] Thuan T. X., Izotov Y. I., Lipovetsky V. A., 1996, ApJ, 463, 120
- [31] Thuan T. X., Martin G. E., 1981, ApJ, 247, 823
- [32] Walborn N. R., Fitzpatrick E. L., 1990, PASP, 102, 379
- [33] Waller W. H., 1990, PASP, 102, 1217
- [34] Yun M. S., Reddy N. A., Condon J. J., 2001, ApJ, 554, 803
- [35] Zhang, W., Kong X., Cheng, L., Zhou, H-Y, Cheng, F-Z, 2007, ApJ, 655, 851