-titleFuture Direcrions in UHECR Physics 2012 11institutetext: INFN, National Gran Sasso Laboratory, I-67010, Assergi (AQ) Italy
UHECR: Signatures and Models
Abstract
The signatures of Ultra High Energy ( EeV) proton propagation through CMB radiation are pair-production dip and GZK cutoff. The visible characteristics of these two spectral features are ankle, which is intrinsic part of the dip, beginning of GZK cutoff in the differential spectrum and in integral spectrum. Measured by HiRes and Telescope Array (TA) these characteristics agree with theoretical predictions. However, directly measured mass composition remains a puzzle. While HiRes and TA detectors observe the proton-dominated mass composition, the data of Auger detector strongly evidence for nuclei mass composition becoming progressively heavier at energy higher than 4 EeV and reaching Iron at energy about 35 EeV. The models based on the Auger and HiRes/TA data are considered independently and classified using the transition from galactic to extragalactic cosmic rays. The ankle cannot provide this transition. since data of all three detectors at energy (1 - 3) EeV agree with pure proton composition (or at least not heavier than Helium). If produced in Galaxy these particles result in too high anisotropy. This argument excludes or strongly disfavours all ankle models with ankle energy EeV. The calculation of elongation curves, , for different ankle models strengthens further this conclusion. Status of other models, the dip, mixed composition and Auger based models are discussed.
1 Introduction
The observed energy spectrum of Cosmic Rays (CR) has an approximately power-law behavior for orders of magnitude in energy with several features that can be linked with particles propagation and acceleration. This power-law behavior is most probably indicative of a power-law acceleration spectra, while spectral features may be assigned to changes in the origin of particles, their propagation and acceleration.
The most prominent feature is the knee in all-particle spectrum at energy 3-4 PeV, discovered first at the MSU (Moscow State University) array in 1958 MSU-knee . At the knee the spectrum steepens from to . This knee is provided by the light elements, protons and Helium, and is explained in the framework of the Standard Model (SM) for Galactic Cosmic Rays (GCR) by the maximum energy of acceleration in the Galactic Sources (Supernovae Remnants, SNRs). In the case of the rigidity-dependent acceleration , where is charge number of a nuclei, the maximum acceleration energy is reached by Iron nuclei and the Iron knee is predicted to be located at energy by factor 26 times higher than for proton knee, i.e. at energy EeV. Recently, the Iron knee was found indeed at energy 0.8 EeV in KASCADE-Grande experiment kascadeFe in a good agreement with rigidity acceleration prediction.
Above the knee, at energy EeV, there is a faint feature in the spectrum second-knee called the second knee. It is seen in many experiments (for a review see 2knee-ankle-rev ). This feature is often interpreted as the place of transition from galactic to extragalactic CRs.
However, for the last forty years the standard place for transition from galactic to extragalactic CRs is considered at ankle, a very prominent spectral feature, observed first in 1960s at Volcano Ranch detector, and immediately interpreted by J. Linsley linsley as transition between these two components of CRs. At present beginning of ankle is determined as EeV according to HiRes observations ankle-hires , and EeV according to Auger (PAO) observations ankle-PAO ; Kampert .
The highest energy feature, the steepening (’cutoff’) of the spectrum is found in all three largest detectors, HiRes GZK-hires , Telescope Array (TA) GZK-TA and PAO GZK-PAO , though the nature of this cutoff is still questionable.
The spectral features expected theoretically are much different for UHE protons and nuclei.
If primary particles are protons, their spectrum must show a steepening which begins at EeV. This is the famous Greisen greisen , Zatsepin and Kuzmin ZK cutoff, referred to as GZK, caused by pion photo-production energy loss in collisions of protons with the CMB photons:
| (1) |
Most probably this cutoff is already observed in the HiRes GZK-hires and TA GZK-TA data, while the spectrum steepening observed by the PAO GZK-PAO does not agree well, according to our calculations, with the predicted GZK shape and position.
There is another feature in the spectrum of UHE extragalactic protons, the pair-production dip, which, as in case of GZK cutoff, can be directly linked to the interaction of CRs with the CMB. This dip arises due to electron-positron production energy loss by extragalactic protons interacting with the CMB photons:
| (2) |
This feature has been studied in BG88 ; Stanev2000 ; BGGPL ; BGGprd ; Aletal . The dip was observed with a very good statistical significance, , by the Fly’s Eye, Yakutsk, Akeno-AGASA and HiRes detectors, but it is absent in the Auger (PAO) data (see section 2.4 for a more detailed analysis). A remarkable property of the pair-production dip is an automatic description of the ankle, which appears as a flat intrinsic part of the dip.
The pair-production dip and GZK cutoff are signatures of protons. A confirmation of the shape of these features can be considered as an indirect evidence for a proton-dominated composition of primary CRs. For nuclei as primaries the shapes of the dip and cutoff are much different.
A different explanation of the dip has been proposed by Hill and Schramm HS85 . They interpreted the dip observed in 1980s in terms of a two-component model; the low energy component was either galactic or produced by Local Supercluster. A similar model was later considered in YT . The Hill-Schramm’s interpretation is widely accepted now.
An alternative to the protons as primaries is given by nuclei. Propagating through astrophysical backgrounds, nuclei lose their energy in photo-disintegration and pair production processes, and also due to adiabatic expansion of the universe. The steepening of nuclei spectra due to photo-disintegration in the interactions with the CMB has been shortly mentioned by Greisen greisen and later considered quantitatively in stecker69 ; BZ71 ; BGZ75 ; hillas75 ; stecker75 . The beginning of the steepening in this case (nuclei in the CMB radiation only) corresponds to the intersection of and adiabatic energy losses curves BZ71 ; BGZ75 . The beginning of this steepening is lower than in the case of GZK cutoff and the shape of this feature differs from that of GZK. Nowadays the importance of Extragalactic Background Light (EBL) becomes evident. Interaction with high energy EBL photons results in photo-disintegration of nuclei at low energies, while in pair-production energy losses and photo-disintegration at highest energies, CMB radiation dominates. Moreover, as recent accurate calculations show the PAO spectrum steepening at highest energies may be explained not only by nuclei interactions. It may be also produced as a result of a decreasing acceleration efficiency in the vicinity of the maximum energy that sources can provide (for reviews see GZK-rev ). The HiRes and TA data, in favour of proton composition, and the PAO data, in favour of nuclei composition, are further discussed in sections 2.3 and 2.4.
The GZK cutoff and pair-production dip are signatures of protons as primary particles. However. the direct measurement of mass composition is needed for consistency of the whole picture. The most reliable method to measure the mass composition nowadays is given by determination of the depth in the atmosphere where the extensive air shower (EAS) reaches maximum and the distribution of over average value given by RMS(). The data of HiRes ankle-hires and TA TAicrc11 show the proton-dominant mass composition at energy EeV in accordance with pair-production dip and GZK cutoff, while PAO data show nuclei mass composition with steadily increasing mass number at EeV, which practically reaches Iron at EeV. This discrepancy of observational data makes us to study two different scenarios with (almost) pure proton composition, based on HiRes and TA data, and Auger-based scenario with steadily heavier mass composition at increasing energy. Four phenomenological models will be considered. The distinctive feature which characterizes each of them is energy of transition from Galactic to extragalactic cosmic rays. The main prediction is the mass composition and energy spectrum.
In the ankle models stanev2005 - waxman it is assumed that the transition occurs at the flat part of the observed spectrum in the energy interval EeV. The transition energy is given by the intersection of a flat extragalactic spectrum and a very steep galactic one. In the majority of ankle models the extragalactic component is assumed to be pure proton, while the galactic one should be naturally represented by Iron nuclei at energies above the Iron knee. These models predict a transition from an Iron-dominated composition to a proton-dominated one at the ankle energy.
In the mixed composition model mixed it is assumed that the extragalactic component consists of nuclei of various types. Thus transition here occurs from Iron to lighter nuclei of mixed composition; it can occur at the ankle or nearby it.
In the dip model the transition begins at the second knee and is completed at the beginning of the dip, at EeV. The ankle in this model appears as an intrinsic part of the dip. Like in the ankle model, the transition here also occurs as an intersection of the flat extragalactic component (this flatness is especially prominent in the case of diffusive propagation) with the steep Galactic spectrum. In contrast to the ankle and mixed composition models, the dip model predicts an almost pure proton composition above EeV and a pure Iron composition below this energy.
The Auger-based models are build for explanation of PAO data: energy spectrum auger-spectrum and mass composition auger-mass with proton or Helium dominance at EeV and with nuclei at higher energies with steadily increasing atomic number with energy. Transition from Galactic to extragalactic CRs occurs at the ankle.
We discuss in this presentation the status of these models.
2 Signatures of proton propagation through CMB
Propagating through CMB, UHE protons undergo two interactions: photo-pion production and production . As a result, the proton spectrum is distorted: due to the first interaction it obtains a sharp steepening called GZK cutoff and due to the second one - shallow deepening, called dip. Both features depend not only on interactions but also on model-dependent quantities, e.g. on modes of propagation (diffusion or rectilinear propagation), on cosmological evolution of the sources, on source separation etc. These model-dependent distortions are especially strong for GZK feature.
The main strategy of this presentation as well as of works BGGPL ; BGGprd ; Aletal is to distinguish the interaction signatures from the model-dependent ones.
This is possible to do using the modification factor BG88 , some kind of theoretical spectrum, in which model-dependent features are suppressed or absent. For this aim we use the calculations which involves only one free parameter. One naturally expects that the calculated interaction signature in terms of modification factor cannot have the agreement with observations with good , because the observational data include the model-dependent features described by many parameters, such as cosmological evolution of the sources, source separation etc. One free parameter is not enough to describe 4 - 5 different experiments with about 20 energy bins in each. As the next step we perform the model-dependent calculations which necessarily include many free parameters improving further the agreement. This analysis should be done in terms of usual spectrum, where the model-dependent features are not suppressed.
However, the Nature has been more kind to us than we expected. The dip, in terms of modification factor with one free physical parameter (interaction-signature description) gave very good agreement with observations of four experiments data : Yakutsk, AGASA, HiRes and Telescope Array (see section 2.1). The comparison with PAO data has a different story. Comparison in terms of modification factor with PAO observational data from ICRC 2007 (Merida) had good enough (see TAUP2007 ). However, with increasing statistics the agreement became worse, and comparison of modification factor with PAO data 2010 - 2001 has bad . It could be that for the difference in very small error bars the model-dependent effects are responsible. Indeed, as demonstrated in section 2.2 the 22% shift of PAO energy scale and cosmological evolution make the PAO spectrum in terms of compatible with the pair-production dip with high accuracy. However, this interpretation contradicts the nuclei mass composition measured by PAO in energy region of the dip.
2.1 The dip in terms of modification factor
In this section the dip will be studied as a signature of UHE proton interaction with CMB, using the modification factor as a tool. The modification factor is defined as the ratio of proton spectrum calculated with all energy losses to the so-called unmodified spectrum in which only adiabatic energy losses (red-shift) are included:
| (3) |
Modification factor is an excellent characteristic of interaction signature. As one might see the interactions enter only numerator and thus they are not suppressed in , while most other phenomena enter both numerator and denominator and thus they are suppressed or even cancelled in modification factor. property is especially pronounced for the dip modification factor, which according to our calculations Aletal depends very weakly on generation index and , on propagation mode, source separation within 1 - 50 Mpc, local source overdensity or deficit etc. The dip modification factor is modified strongly by presence of nuclei (). Modification factor for GZK feature is changing stronger.
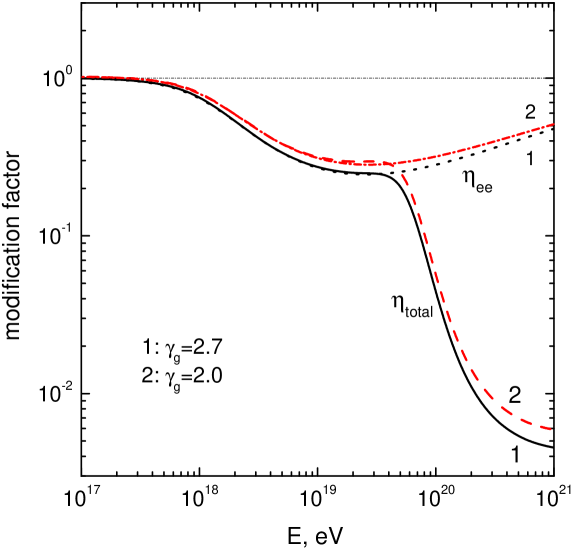
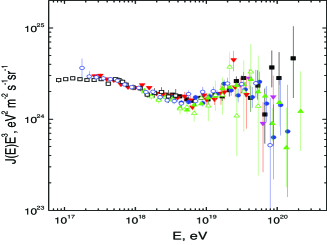
Theoretical modification factors calculated for different source generation indices are presented in Fig. 1. If one includes in the calculation of only adiabatic energy losses, then, according to its definition, (dash-dot line in Fig. 1). When -production is additionally included, one obtains spectrum shown in Fig. 1 by the curves labeled as . With the pion photo-production process being also included, the GZK feature (curves “total”) appears. The observable part of the dip extends from the beginning of the GZK cutoff at EeV down to EeV, where . It has two flattenings: one at energy EeV and the other at EeV. The former automatically produces the ankle (see Fig. 2) and the latter provides an intersection of the flat extragalactic spectrum at EeV with the steeper Galactic one.
We discussed above the theoretical modification factor. The observed modification factor, according to definition, is given by the ratio of the observed flux and unmodified spectrum , defined up to normalization as: . Here is the exponent of the generation spectrum in terms of initial proton energies . Fig. 2 shows that both the pair production dip and the beginning of the GZK cutoff up to EeV are well confirmed by experimental data data of Akeno-AGASA, HiRes, Yakutsk and TA.
![[Uncaptioned image]](/html/1307.4043/assets/x2.png)
![[Uncaptioned image]](/html/1307.4043/assets/x3.png)
![[Uncaptioned image]](/html/1307.4043/assets/x4.png)
![[Uncaptioned image]](/html/1307.4043/assets/x5.png)
The comparison of the theoretical dip with observational data includes only two free parameters: exponent of the power-law generation spectrum (the best fit corresponds to ) and the normalization constant to fit the -production dip to the measured flux. The number of energy bins in the different experiments is . The fit is characterized by for AGASA, HiRes and Yakutsk data. This is a very good fit for signature (see beginning of this section). For this fit we used the modification factor without cosmological evolution of sources. As was explained above, using a model approach with additional three parameters describing the cosmological evolution one can further improve the agreement. In Fig. 2 one can see that at EeV the experimental modification factor, as measured by Akeno and HiRes, exceeds the theoretical modification factor. Since by definition the modification factor must be less than one, this excess signals the appearance of a new component of cosmic rays at EeV, which can be nothing else but the Galactic cosmic rays. This interpretation is confirmed by transition of heavy component to the protons in the upper-left panel of Fig. 5, that with good accuracy occurrs at the same energy. Thus, according to HiRes data the transition from extragalactic to Galactic cosmic rays, occurs at energy EeV and is accomplished at EeV (see upper-left panel in Fig. 5 as example).
2.2 Pair-production dip as energy calibrator
The energy position of pair-production dip is rigidly fixed by interaction with CMB and thus it can serve as energy calibrator for the detectors.
As we already mentioned, it is difficult to expect that in terms of the modification factor the dip described by one free physical parameter can fit the observational data with minimum . One can shift the observed energy bins by the recalibration factor , within the systematic error of observations, to minimize BGGprd . We shall refer to this procedure as ’recalibration of energy scale’.
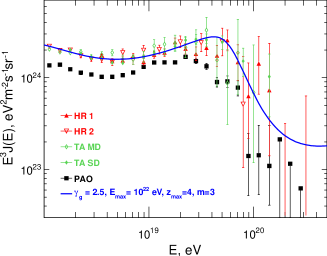
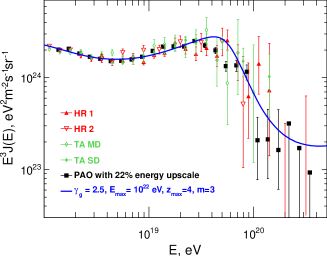
We discuss first the dip in PAO spectrum auger-spectrum presented by the filled boxes in the left panel of Fig. 3. As it was already mentioned, because of very small statistical error bars it has too large in comparison with pair-production dip terms of modification factor. We shall use then the model-dependent method in terms of including the cosmological evolution up to as shown in the left panel of Fig. 3. Using two more free parameters and we can reach better agreement with the modified shape of the dip shown the solid curve in Fig. 3. Now we can shift the PAO energy bins by factor reaching the minimum . For this is needed. As a result we obtain picture shown in the right panel of Fig. 3. We obtained not only the excellent agreement with the shape of the theoretical pair-production dip (solid curve) but also the good agreement with absolute fluxes of HiRes and TA. Note that disagreement with GZK cutoff remains for the three energy bins in energy interval EeV.
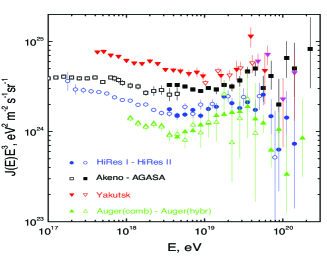
Recalibration with help of pair-production dip for all five detectors (HiRes, Telescope Array, PAO, AGASA and Yakutsk) is shown in Fig. 4. Recalibration factor for HiRes/TA is based on the scale factor which correctly describes the pair-production dip and GZK cutoff in differential and integral () spectra.
2.3 GZK cutoff in HiRes and Telescope Array data
The two largest Extensive Air Shower (EAS) detectors, HiRes GZK-hires and Pierre Auger Observatory GZK-PAO have observed a sharp steepening in the UHECR spectrum at EeV. Both collaborations claimed that the observed steepening is consistent with the GZK cutoff. But as a matter of fact, there is a dramatic conflict between these two results, which still leaves the problem open.
![[Uncaptioned image]](/html/1307.4043/assets/x10.png)
![[Uncaptioned image]](/html/1307.4043/assets/x11.png)
![[Uncaptioned image]](/html/1307.4043/assets/x12.png)
![[Uncaptioned image]](/html/1307.4043/assets/x13.png)
In this subsection we analyze data of the HiRes which provide a strong evidence in favour of the GZK cutoff. These data are supported also by the TA data GZK-TA . The data of PAO will be considered in the next subsection.
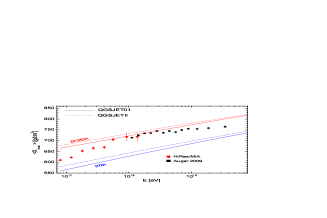
To interpret convincingly the spectrum steepening as the GZK cutoff one must prove that (i) energy scale of the cutoff and its shape correspond to theoretical predictions and (ii) the measured mass composition is strongly dominated by protons. In HiRes the mass composition is determined from , average depth of atmosphere in , where a shower with energy reaches maximum, and RMS(, which is the width of the distribution over . These values measured by the HiRes are displayed in Fig. 5. From the left-upper panel of Fig. 5 one can see that the chemical composition changes from very heavy elements, probably Iron, at EeV, (data of HiRes-MIA hires-mia ) to protons at EeV (data of HiRes ankle-hires ). RMS, a very sensitive tool for mass composition, also provides evidence for a proton-dominated composition at EeV and up to the highest energies (see upper-right panel of Fig. 5). Differential energy spectrum of the GZK feature in the form of modification factor (left-lower panel) is in a reasonably good agreement with the theoretical prediction, though better statistics at higher energies is still needed for a final conclusion.
The integral energy spectrum of UHE protons, , has another specific characteristic of the GZK cutoff, the energy BG88 . It is based on the observation that the calculated integral spectrum below EeV is well approximated by a power-law function: . At high energy this spectrum is steepening due to the GZK effect. The energy where this steep part of the spectrum equals to the half of its power-law extrapolation, , defines the value of . This quantity is found to be practically model-independent; it equals to EeV BG88 . Fig. 5 demonstrates how the HiRes collaboration found from observational data E_1/2hires . The ratio of the measured integral spectrum and the low-energy power-law approximation was plotted as a function of energy. This ratio is practically constant in the energy interval EeV, indicating that the power-law approximation is a good fit, indeed. At higher energy the ratio falls down and intersects the horizontal line at the energy defined as . It results in eV, in an excellent agreement with the predicted value.
Thus, one may conclude that the HiRes data presented in Fig. 5 indicate the proton-dominated chemical composition and the presence of the GZK cutoff in both differential and integral spectra. The conclusion about proton composition is further supported by the recent TA data TAicrc11 .
2.4 PAO data: energy spectrum and mass composition
In subsection 2.2 we demonstrated that the dip shape, as observed by PAO, can agree after recalibration with energy spectra of HiRes/TA and other detectors (see Figs. 3 and 4 ). The coincidence of the PAO and HiRes/TA spectra is related to low energy part of the energy spectrum in the right panel of Fig. 3. At higher energies statistical uncertainties are too large to distinguish between the spectra.
While the HiRes and TA spectra are compatible with the GZK cutoff, the Auger spectrum is not. The steepening in the upscaled PAO spectrum starts at energy EeV, lower than EeV, and in three successive energy bins in the interval EeV the PAO flux is significantly lower than one predicted for the GZK shape as shown in the right panel of Fig. 3. We could not reconcile the PAO cutoff shape with the GZK behavior by including in the calculations different generation indices , evolution regimes, low acceleration maximum energy , local overdensity of sources etc.
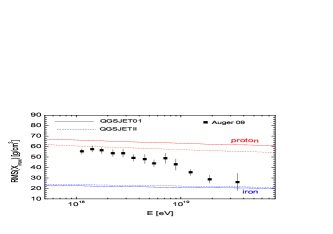
This disagreement is quite natural for the PAO mass composition data which, in contrast to HiRes and TA, show strong dominance of nuclei (see Fig. 6). A steepening in the end of the of the nuclei spectrum, as calculations show, is quite different from that of protons (GZK cutoff). The most reliable data on mass composition is given by elongation curve and especially by RMS(. In the Auger data the latter steadily decreases with energy and approaches the Iron value at EeV. Low RMS, i.e. small fluctuations, is a typical and reliable feature of the heavy nuclei composition. These data are further strengthened by other PAO measurements provided by surface detectors. They allow to extract two other mass-composition dependent quantities: the atmospheric depth , where muon-production rate reaches maximum, and maximum zenith angle determined by the signal rise-time in surface Cerenkov detectors. Measurements of both quantities confirm the heavy mass composition and its dependence on energy obtained with the help of and RMS(), Garcia-GamezICRC and Gazon2012 , respectively. The soon expected data on muon flux from the Auger Muon and Infill Ground Array (AMIGA) AMIGA will further clarify the mass composition.
Our further analysis of the Auger spectrum and mass composition is
based on the following two observations:
(i) According to the HiRes (Fig. 5) and PAO
(Fig. 6) data, the observed primaries at energy
EeV are predominantly protons or nuclei not heavier than
Helium.
These particles cannot be galactic, otherwise, as MC simulations
anisotropy show, galactic anisotropy would be too large.
Then the ankle in the PAO data is not a transition from galactic to
extragalactic cosmic rays, but transition from extragalactic
protons/Helium to extragalactic nuclei. Transition from galactic to
extragalactic CRs occurs thus at lower energies, most probably at the
second knee.
(ii) The particles at higher energies are extragalactic nuclei
with the charge number increasing with energy.
This observation is naturally explained by rigidity dependent
acceleration in the sources ,
since at each energy the contribution of nuclei
with smaller vanishes.
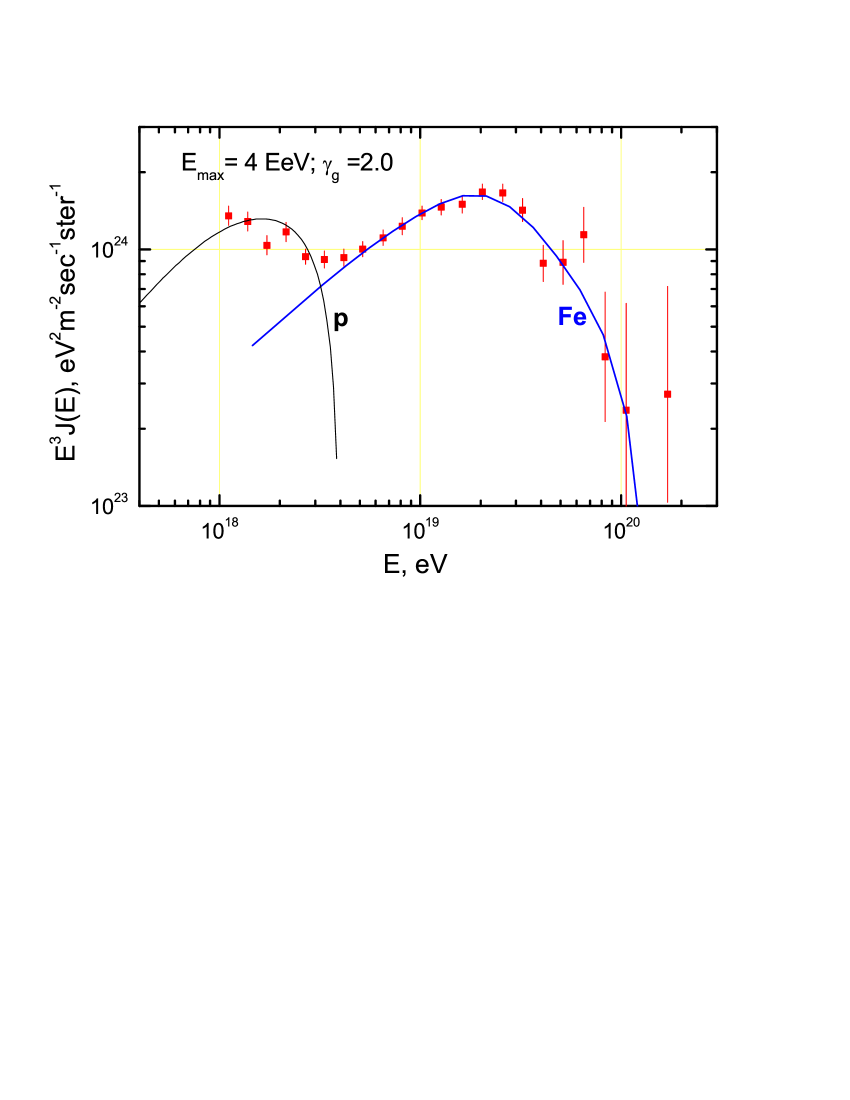
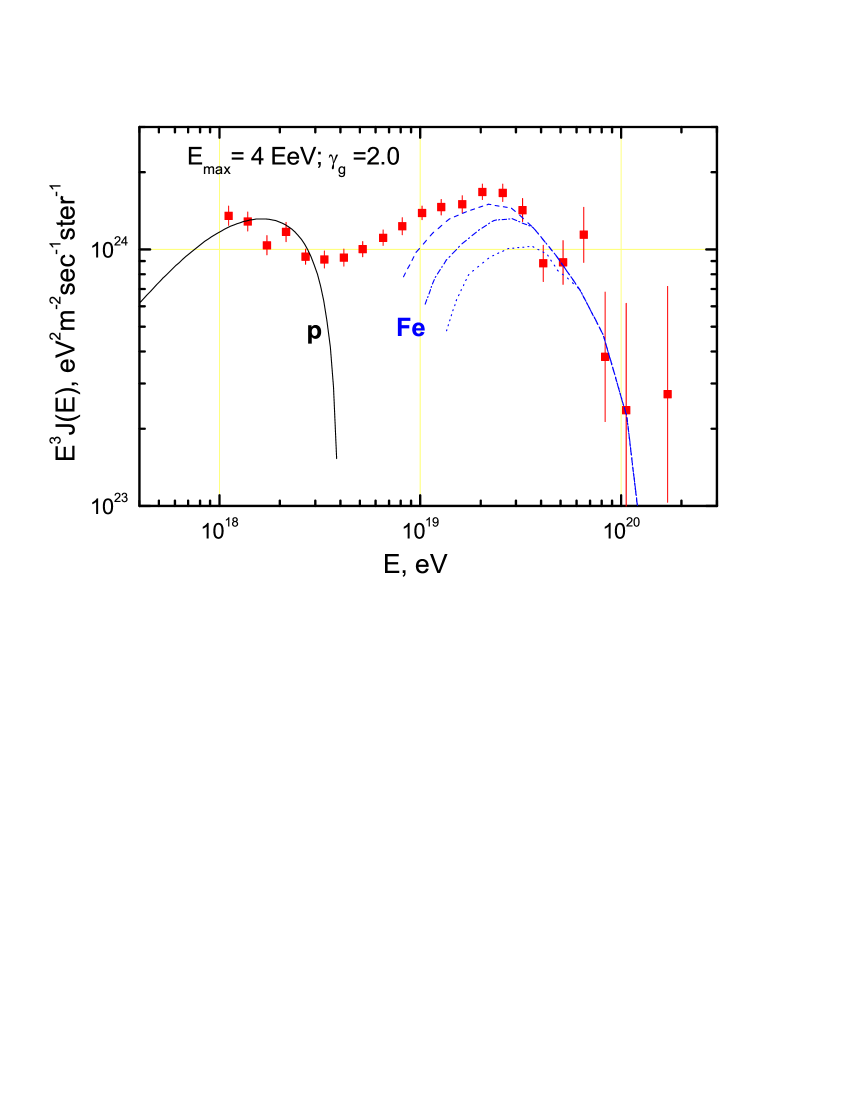
It was demonstrated in disapp that to avoid a proton dominance at the highest energies, one must assume that the maximum energy of the accelerated protons is limited, EeV. This conclusion is valid for a large range of generation indices, , and for a wide range of cosmological evolution parameters. The calculated proton and nuclei energy spectra for , EeV and without cosmological evolution are shown in Fig. 7. In the left panel the two component model (protons and Iron) is presented. In the right panel intermediate primary nuclei are included in the framework of the diffusive propagation through intergalactic magnetic fields (see disapp for details). However, it is a problem to explain simultaneously both the spectrum and the mass composition of the PAO. This model is called ’disappointing’ because of lack of many signatures predicted in proton-dominated models, such as cosmogenic neutrino production and correlation of CR arrival directions with distant sources.
The similar model is considered in Allard2011 (see Fig. 4 there). Like in disapp the proton component with EeV is introduced and rigidity-dependent acceleration is considered. The more detailed calculations including the secondary nuclei are performed for Iron-enriched source spectrum. The calculated spectrum agrees well with that of PAO at EeV.
More detailed calculations are performed in Taylor2011 . For Iron or Silicon as the accelerated nuclei, and very flat generation spectrum with , the energy spectrum and mass composition of the produced nuclei are calculated for rectilinear and diffusive propagation. In some cases the agreement with Auger data is reached for energy spectrum and RMS(E) (agreement with elongation curve is worse). The rigidity-dependent acceleration is not assumed and problem with proton/Helium component at (1 - 3) EeV is not discussed. The presence of nearby sources is emphasized as a general feature.
3 Three transition models
In this section we discuss three models of transition from Galactic to extragalactic CRs: ankle, dip and mixed composition models. One feature is common for all of them: the transition is described as an intersection of a steep Galactic spectrum with a flat extragalactic one. The agreement with the SM for GCR is one more criterion which these models have to respect. According to the Standard Model, the benchmark of the end of GCR is given by the Iron knee at energy PeV and at it has an exponential cutoff.
Motivated by the interpretation of the ankle as the transition to extragalactic CR at EeV, one has to assume hillas2005 ; hillas2006 ; gaisser an additional component of GCR accelerated to energies much beyond the Iron knee.
Observational data which have the power either to confirm or to reject each transition model include energy spectrum, elongation curve , RMS() and anisotropy. Below these models are discussed in the historical succession of appearance: ankle, dip and mixed composition.
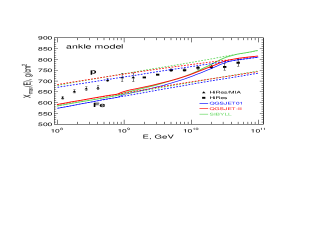
3.1 Ankle model
This is the traditional model based on the interpretation of the ankle as the spectrum feature where transition occurs (see e.g. stanev2005 - waxman ). In fact, this is a very natural model since transition occurs because the extragalactic component is very hard. This component is assumed to have a pure proton composition with a flat generation spectrum valid for non-relativistic shock acceleration. Energy losses modify the spectrum insignificantly at EeV. The beginning of the ankle at EeV corresponds to the energy where fluxes of Galactic and extragalactic CRs get equal. Thus, the Galactic CRs should be presented by an additional component accelerated up to energy by factor times higher than the maximum energy in the Standard Model. In the majority of ankle models, e.g. hillas2005 ; hillas2006 ; WW2005 ; waxman , the large fraction of the observed cosmic rays has a Galactic origin at EeV. To facilitate the acceleration problem one should assume a heavy-nuclei composition of the new component.
Another problem of the ankle model is the contradiction with the measured average depth of EAS maximum, , in the energy range EeV. While all data, including both HiRes and PAO, show proton or light nuclei composition here, the ankle model needs a heavy Galactic component, predicting too small in contradiction with observations (see the right panels of Fig. 8 and right panel of Fig. 4 in ABBO ). This contradiction is found also in anisotropy and mixed .
Another contradiction in the ankle model is given by observed proton/Helium composition at (1 - 3) EeV. Since this energy interval is below the ankle, i.e. has galactic origin, anisotropy there should be too high anisotropy . One may conclude that ankle model is excluded or very strongly disfavoured.
3.2 Dip model
The dip model is based on the assumption that UHECRs at EeV are mostly extragalactic protons. This assumption is confirmed by the HiRes and TA data (mass composition and observation of pair-production dip and GZK cutoff), but contradicts to PAO mass composition data. The transition from galactic to extragalactic component begins at the second dip and finishes at EeV in good agreement with SM of Galactic CRs.
The basic features of the dip model are as follows
BGGPL ; BGGprd ; Aletal :
(i) The sources are AGN BGG-AGN with a neutron
mechanism of particle escape berez77 ; dermerAGN which provides a
pure proton generation spectrum.
(ii) The source generation spectrum has a usual shock-acceleration form
, but generation rate per unit
comoving volume at high energy can be with
due to distribution of the sources over the
maximum energy of acceleration KS .
(iii) The generation index is the main
fitting parameter (see subsection 2.1).
The cosmological evolution
of the sources can be easily included, affecting mostly the low energy
part of the spectrum. Inclusion of additional parameters allows to
improve the fit. In particular, in BGGprd the spectrum
was calculated with an account for cosmological evolution of AGN as it
follows from X-ray observations.
The confirmation of the dip model follows from: (i) agreement
of the dip energy spectrum with observations (see Fig. 2),
(ii) equality of all measured fluxes after the dip-based
energy recalibration (see Fig. 4) and (iii)
agreement of with the bulk of
observations in the left panels of Fig. 8.
At present the dip model is confirmed by the data of HiRes and TA
by strong proton-dominance at EeV, and is in contradiction
with the Auger measurements of
and RMS at EeV.
The key observation to accept or reject the dip model is the chemical
composition of UHECR at EeV. In the case of a substantial
admixture of nuclei in the spectrum () the dip model should be
rejected.
3.3 Mixed composition model
The main concept of the mixed composition model (see Allard et al. mixed ) is based on the argument that any acceleration mechanism operating in gas involves different species of nuclei in acceleration process and thus the primary flux must have a mixed composition.
The basic features of the mixed composition model are as follows mixed : (i) In its basic versions mixed , the source composition of extragalactic CRs is assumed to be almost the same as for Galactic CRs, with protons and Helium being the dominant components. (ii) The source energy spectra are taken as power-law with a generation index , with the maximum acceleration energy assumed to be rigidity dependent, and with cosmological evolution of the sources considered to be in a wide range of regimes. (iii) The sources usually are assumed to be distributed homogeneously in the universe. The propagation is studied using Monte Carlo with nuclei photo-disintegration on the CMB and EBL. (iv) At a first glance one may expect that a large number of free parameters, such as generation index, parameters of cosmological evolution and coefficients of source nuclei composition, can provide a broad variety of observed mass compositions and spectra. However, as it was demonstrated in mixed , the predictions are very much constrained due to photo-disintegration of nuclei on EBL and CMB radiations. (v) The basic physics phenomena and their results are as follows. Generically in the mixed models the mass composition becomes lighter at EeV, because intermediate and heavy nuclei are destroyed by the EBL photons while protons survive. In principle this situation may change only above EeV, when GZK cutoff in the proton spectrum appears, while heavy nuclei, e.g. Iron, are still not photo-disintegrated by the CMB photons and may dominate. In realistic cases the dominant component in mixed models are protons. (vi) Transition from Galactic to extragalactic component in the mixed models depends on the choice of parameters. In most models transition occurs at the ankle, see Allard et al. in mixed . However, in the conceptually important paper by Allard, Olinto, Parizot (2007) from mixed it was emphasized that for strong source evolution and flat generation spectra the intersection of Galactic and extragalactic components occurs between EeV and EeV, i.e. at the second knee, as in the dip model.
The dominance of protons was the reason why the predicted by mixed composition models is in a better agreement with HiRes data than with PAO data. The observations of PAO show that mass composition becomes heavier with increasing energy, and thus the existing calculations in the framework of mixed models agree better with the HiRes data.
However, with the recent proposal parizot the power of the mixed composition model for fitting the PAO data may change due to a possible enhancement of the heavy nuclei production.
4 Conclusions
In this paper we limited our consideration by the models for diffuse fluxes of UHECR. We will touch the problem of the produced neutrinos and detection of sources only shortly in the end of this section. The traditional interest for diffuse fluxes is given by the highest energies, namely by the search for the GZK cutoff. Its unambiguous discovery, however, means only that primaries are protons and exotic solutions are excluded. The low-energy part of extragalactic CRs can give a key information on the existence of pair-production dip, on propagation of CRs in extragalactic magnetic fields and shed more light on the end of Galactic CRs.
Therefore, the experimental studies in the transition region EeV are of paramount importance in this field of research, with the mass composition measured by different methods being probably most important task.
There are four working detectors which cover partially the above-mentioned region: KASCADE-Grande KASCADE-G , Tunka tunka , Yakutsk Yak and IceTop/IceCube IceTop . There are also projects to extend the observations of Telescope Array and PAO to low energies, EeV at TALE TALE and at LE-Auger LE-Auger . The Auger detector has a great potential to explore the low-energy region of the UHECR spectrum. At present there are already two new detectors at PAO collecting data at this energy; High Elevation Auger Telescope (HEAT) HEAT , detecting the fluorescent light at higher elevation angles; and Auger Muons and Infill Ground Array (AMIGA) AMIGA , for the detection of the EAS muon component. These detectors, together with TALE, Tunka, Yakutsk and IceCube/IceTop will provide information on all radiations from EAS, including fluorescent and Cherenkov light, muons and radio radiation. One may expect that in this way the present controversy between the mass compositions in the HiRes and Auger detectors will be unambiguously solved. The recent measurement Garcia-GamezICRC ; Gazon2012 of the muon-production depth and maximum zenith angle by on-ground Auger detectors is an important step in this direction.
At the low-energy end of the UHECR the energy spectra are measured with an unprecedented accuracy for cosmic ray physics. However, in fact even in experiments with the same technique, like HiRes and Auger, the energy scales are different due to systematic errors. However, there is a physical ’standard candle’ for the detector energy calibration, given by the fixed energy position of the pair-production dip. The recalibration factor can be found by the spectrum shift to the energy at which agreement between observed and predicted dips is the best (see BGGprd ; Aletal and Blümer at al. in GZK-rev ).
There are three models of transition: ankle, dip and mixed composition one. The ankle model is excluded or severely disfavoured by proton or Helium composition at energy EeV, i.e. below the ankle, where the particles have Galactic origin. The mass composition at these energies will be reliably measured by future low-energy detectors. However, the argument against the ankle model obtained from Fig. 8 remains to be valid independently from mass composition at EeV, unless it is very heavy.
A search for UHE neutrinos UHECR sources is outside the scope of this review. However, a few remarks may be useful here.
In some particular dip models (see subsection 3.2) with proton-dominated mass composition the cosmogenic neutrinos can be detectable. The flux of cosmogenic neutrinos are severely constrained by the electro-magnetic cascade upper limit BeSm and only in extreme cases BGKO ; Ahlers it can be detectable, e.g. by JEM-EUSO jem-euso . Another case of flux detectable by Ice-Cube at smaller energies eV is given by cosmogenic neutrinos produced at ’bright phase’BeBl . UHE neutrinos can in principle indicate directions to the sources.
Even in the case when heavy nuclei dominate in the source radiation, the protons are accelerated there too, and even small produced flux can be detected from a nearby source. However, such possibility not always exists. For example in the disappointing model disapp for interpretation of Auger results the maximum energy of protons EeV is too small to reach rectilinearly detector from a source.
Note added
Recently the KASCADE-Grande collaboration discovered (prd 87, 081101, 2013) the light component at eV with a hard spectrum . It consists of protons and Helium apparently of extragalactic origin. The transition from galactic, more steep, component occurs at eV and it becomes dominant at eV. The galactic origin of this component is disfavored by absence of observed anisotropy at eV. This observation favors the dip model and further disfavors ankle as transition from galactic to extragalactic cosmic rays.
5 Acknowledgment
This paper is based on the joint works and many discussions with my co-authors Roberto Aloisio, Askhat Gazizov and Svetlana Grigorieva. I am mostly grateful to them for efficient and pleasant collaboration. I also learned much from many useful discussions with Pasquale Blasi, Michael Kachelrieß, Johannes Knapp and Sergey Ostapchenko. The work was partly supported by Ministry of Science and Education of Russian Federation (agreement 8525).
References
- (1) G. Kulikov, and G. Khristiansen, JETP 35, 635 (1958)
-
(2)
W. D. Apel et al. [KASCADE-Grande Collab.],
arXiv:1107.5885 -
(3)
M. Nagano et al. [Akeno Collab.], J. Phys. G:
Nucl. Part. Phys. 18, 423 (1992);
D. J. Bird et al. [Fly’s Eye Collab.], Phys. Rev. Lett. 71, 3401 (1993);
A. V. Glushkov et al. [Yakutsk Collab.], JETP Lett. 73, 115 (2001) - (4) D. R. Bergman, and J. W. Beltz, J. Phys. G 34, 359 (2007), arXiv:0704.3721
- (5) J. Linsley, Proc. 8th ICRC (Jaipur 1963) 4, 77 (1963)
- (6) P. Sokolsky for HiRes Collaboration, Nucl. Phys. B (Proc. Suppl.) 196, 67 (2009) and P. Sokolsky for HiRes Collaboration “Final Results from the HiRes experiment” ISVHECR, Batavia Il., USA 2010
- (7) The Pierre Auger Collaboration, Phys. Lett. B 685, 239 (2010)
- (8) K-H Kampert for the Pierre Auger Collaboration, arXiv:1207.4823
- (9) R. U. Abbasi et al. Phys. Rev. Lett. 100, 101101 (2008); arXiv:astro-ph/0703099
-
(10)
C. C. H. Jui [Telescope Array Collab.], arXiv:1110.0133;
Y.Tsunesada [Telescope Array Collab.], arXiv:1111.2507 - (11) J. Abraham et al., Phys. Rev. Lett. 101, 06110.1 (2008)
- (12) K. Greisen, Phys. Rev. Lett. 16, 748 (1966)
- (13) G. T. Zatsepin, and V. A. Kuzmin, Pisma Zh. Experim. Theor. Phys. 4, 114 (1966)
- (14) V. S. Berezinsky, and S. I. Grigorieva, Astron. Astrophys. 199, 1 (1988)
- (15) T. Stanev et al, Phys. Rev. D 62, 093005 (2000)
- (16) V. Berezinsky, A. Z. Gazizov, and S. I. Grigorieva, Phys. Lett. B 612, 147 (2005); astro-ph/0502550
- (17) V. Berezinsky, A. Z. Gazizov, and S. I. Grigorieva, Phys. Rev. D 74, 043005 (2006); hep-ph/0204357
- (18) R. Aloisio, V. Berezinsky, P. Blasi, A. Gazizov, S. Grigorieva, and B. Hnatyk, Astropart. Phys. 27, 76 (2007); astro-ph/0608219
- (19) C. T. Hill, and D. N. Schramm, Phys. Rev. D 31, 564 (1985)
- (20) S. Yoshida, and M. Teshima, Progr. Theor. Phys. 89, 833 (1993)
- (21) F. W. Stecker, Phys. Rev. 180, 1264 (1969)
- (22) V. S. Berezinsky, and G. T. Zatsepin, Sov. Journ. Nucl. Phys. 13, 453 (1971)
- (23) V. S. Berezinsky, S. I. Grigorieva, and G. T. Zatsepin, Proc. 14th ICRC (Munich 1975) 2, 711 (1975); Astrophys. Sp. Sci. 36, 17 (1975)
- (24) M. Hillas, Proc. 14th ICRC (Munich 1975) 2, 717 (1975)
- (25) J. L. Puget, and F. W. Stecker, Proc. 14th ICRC (Munich 1975) 2, 734 (1975)
-
(26)
P. Bhattacharjee, and G. Sigl, Phys. Rep. 327, 109 (2000);
M. Nagano, and A. A. Watson, Rev. Mod. Phys. 72, 689 (2000);
A. Letesier-Selvon, and T. Stanev, Rev. Mod. Phys. 83, 907 (2011), arXiv: 1103.0031;
K. Kotera, and A. V. Olinto, Ann. Rev. Astron. Astrophys. 49 (2011), arXiv:1101.4256;
F. Aharonian et al., to be published in: Space Science Reviews, arXiv:1105.0131;
J. Blümer, R. Engel, and J. R. Hörandel, Progress in Part. and Nucl. Phys. 63, 293 (2009);
U. Katz, and Ch. Spiering, arXiv:1111.0507 - (27) Y. Tsunesada for the Telescope Array Collaboration, 32nd ICRC Conference, Beijing 2011, 1111.2507
- (28) D. De Marco, and T. Stanev, Phys. Rev. D 72, 081301 (2005)
- (29) A. M. Hillas, Nucl. Phys. Proc. Suppl. 136, 139 (2004)
- (30) A. M. Hillas, J. Phys. G. Nucl. Part. Phys. 31, R95 (2005)
- (31) A. M. Hillas, arXiv:0607109
- (32) T. Gaisser, Invited talk at XVI Int. Symp. on Very High Energy Cosmic Ray Interactions, 2010, Batavia, USA; arXiv:1010.5996
- (33) P. L. Biermann, and G. A. Medina-Tanko, Nucl. Phys. B (Proc. Suppl.) 122, 86 (2003)
- (34) T. Wibig, and A. W. Wolfendale, J. Phys. G 31, 255 (2005)
- (35) E. Waxman, Nucl. Phys. B (Proc. Suppl.) 87, 345 (2000)
-
(36)
D. Allard et al., Astron. Astrophys. 443, L29 (2005),
astro-ph/0505566;
D. Allard, E. Parizot, and A. V. Olinto, Astropart. Phys. 27, 61 (2007);
D. Allard et al. J. Phys. G 34, 359 (2007), astro-ph/0512345;
D. Allard, A. V. Olinto, and E. Parizot, astro-ph/0703366 (2007);
N. Globus, D. Allard, and E. Parizot, arXiv:0709.1541;
D. Allard et al. JCAP 0810:033, (2008), arXiv:0805.4779;
C. De Donato, and G. A. Medina-Tanko, Astropart. Phys. 32, 253 (2009) - (37) The Pierre Auger Collaboration, 32nd Int. Cosmic Ray Conference, Beijing 2011, arXiv:1107.4809
- (38) The Pierre Auger Collaboration, 32nd Int. Cosmic Ray Conference, Beijing 2011, 1107.4804
-
(39)
R. U. Abbasi et al. [HiRes Collab.], Phys. Rev. Lett. 92, 151101 (2004);
V. P. Egorov et al. [Yakutsk Collab.], Nucl. Phys. B (Proc. Suppl.) 3, 136 (2004);
K. Shinozaki et al. [AGASA Collab.], Nucl. Phys. B (Proc. Suppl.) 3, 151 (2006);
M. Honda et al. [Akeno Collab.], Phys. Rev. D 70, 525 (1993);
D. J. Bird et al. [Fly’s Eye Collab.], Astrophys. J. 424, 491 (1994);
G. B. Thomson [Telescope Array Collab.], arXiv:1010.5528;
C. C. H. Jui [Telescope Array Collab.], arXiv:1110.0133 - (40) V. Berezinsky, Journal of Physics: Conference Series (TAUP 2007, eds. K. Inoue, A. Suzuki, T. Mitsui) 120, 012001 (2008)
- (41) N. N. Kalmykov, and S. S. Ostapchenko, A. I. Pavlov, Bull. Russ. Acad. Sci. Phys. 58, 1966 (1994); Nucl. Phys. Proc. Suppl. 52B, 17 (1997)
- (42) S. Ostapchenko, Phys. Rev. D 83, 014018 (2011); Phys. Rev. D 74, 014026 (2006); Nucl. Phys. Proc. Suppl. 151 B, 143 (2006)
- (43) R. U. Abbasi et al. [HiRes-MIA Collab.], Phys. Lett. B 556, 1 (2003)
- (44) R. U. Abbasi et al. [HiRes Collab.], arXiv:astro-ph/0703099
- (45) D. Garcia-Gamez, for the Pierre Auger Collaboration, arXiv:astro-ph/1107.4804
- (46) L. Gazon, for the Pierre Auger Collaboration, arXiv:astro-ph/1201.6265
- (47) F. Sanchez, for the Pierre Auger Collaboration, arXiv:astro-ph/1107.4807
- (48) G. Giacinti, M. Kachelrieß, D. V. Semikoz, G. Sigl, JCAP 1207, 031 (2012), arXiv:1112.5599
-
(49)
R. Aloisio, V. Berezinsky, A. Gazizov, Astropart. Phys. 34, 620
(2011);
J. Phys. Conf. Ser. 337, 012042 (2012) - (50) D. Allard, Astropart. Phys. 39-40, 33 (2012).
- (51) A. M. Taylor, M. Ahlers, F. A. Aharonian, Phys. Rev. D 84, 105007 (2011), arXiv: 1107.2055
- (52) R. Aloisio, V. Berezinsky, P. Blasi, S. Ostapchenko, Phys. Rev. D 77, 025007 (2008)
- (53) R. S. Fletcher, T. K. Gaisser, P. Lipari, and T. Stanev, Phys. Rev. D 50, 5710 (1994)
- (54) P. Abreu et al. [Pierre Auger Collab.], arXiv:1107.4804
- (55) V. Berezinsky, A. Gazizov, and S. Grigorieva, arXiv:astro-ph/0210095
- (56) V. S. Berezinsky, Invited lecture at 15th ICRC (Plovdiv, Bulgaria) 10, 84 (1977)
- (57) A. Atoyan, and C. D. Dermer, New Astron. Rev. 48, 381 (2004), astro-ph/0402646
- (58) M. Kachelrieß, and D. Semikoz, Phys. Lett. B 634, 143 (2006)
- (59) C. Blaksley, E. Parizot, Astropart. Phys. 35, 342 (2012)
- (60) K.-H. Kampert [KASCADE Grande Collab.], Nucl. Phys. B (Proc. Suppl.) 122 C, 422 (2003)
- (61) B. V. Antokhonov et al. Texas Symp. on Relativistic Astroph., Heidelberg, Germany, POS (Texas 2010) 138
- (62) A. A. Ivanov, S. P. Knurenko, and I. E. Sleptsov, New Journ. Phys. 11, 065008 (2009)
- (63) Ice Cube Collab., Proc. 32nd ICRC Beijing 2011, arXiv:1111.2735v2 [astro-ph.HE]
- (64) D. R. Bergman [TA/TALE Collab.], Proc. of 29th ICRC (Pune) v. 8, 141 (2005); ibid C. C. H. Jui v. 8, 101 (2005)
- (65) M. C. Medina et al, astro-ph/0607115
- (66) T. H. J. Mathes [Pierre Auger Collab.], arXiv:1107.4807
- (67) V. S. Berezinsky and A. Yu. Smirnov, Astrophys. Sp. Sci. 32, 461 (1975)
- (68) V. Berezinsky, A. Gazizov, M. Kachelrieß, S. Ostapchenko, Phys. Lett. B 695, 13 (2011), arXiv:1003.1496
- (69) J. Ahlers et al., Astropart. Phys. 34, 106 (2010), arXiv:1005.2620
- (70) N. Inoue et al. JEM-EUSO collaboration, Nucl. Phys. B, Proc. Suppl. 196, 135 (2009)
- (71) V. Berezinsky and P. Blasi, Phys. Rev. D 85, 123003 (2012)