Evidence for massive bulk Dirac Fermions in Pb1-xSnxSe from Nernst and thermopower experiments
Recently, topological surface states (SS) protected by mirror symmetry were predicted to exist in the rocksalt IV-VI semiconductors. Several groups have observed these SS in (Pb,Sn)Te, (Pb,Sn)Se and SnTe using photoemission. An underlying assumption in the theory is that the SS arise from bulk states describable as massive Dirac states, but this assumption is untested. Here we show that the thermoelectric response of the bulk states display features specific to the Dirac spectrum. By relating the carrier density to the peaks in the quantum oscillations, we show that the Landau Level (LL) is non-degenerate. This finding provides robust evidence that the bulk states are indeed massive Dirac states. In the lowest LL, displays a striking linear increase vs. magnetic field characteristic of massive Dirac fermions. In addition, the Nernst signal displays a sign anomaly in the gap inverted phase at low temperatures.
The rock-salt IV-VI semiconductors have been identified by Fu and collaborators Fu ; Hsieh as a novel class of insulators – the topological crystalline insulators (TCIs) – which display surface states that are protected by crystalline symmetry. The topological surface states in TCIs are to be contrasted with those in the widely investigated Z2 invariant topological insulators (TIs), which are protected by time-reversal invariance HasanKane ; QiZhang . Angle-resolved photoemission spectroscopy (ARPES) experiments have obtained evidence for the surface states in Pb1-xSnxSe Story , SnTe Takahashi and Pb1-xSnxTe Hasan .
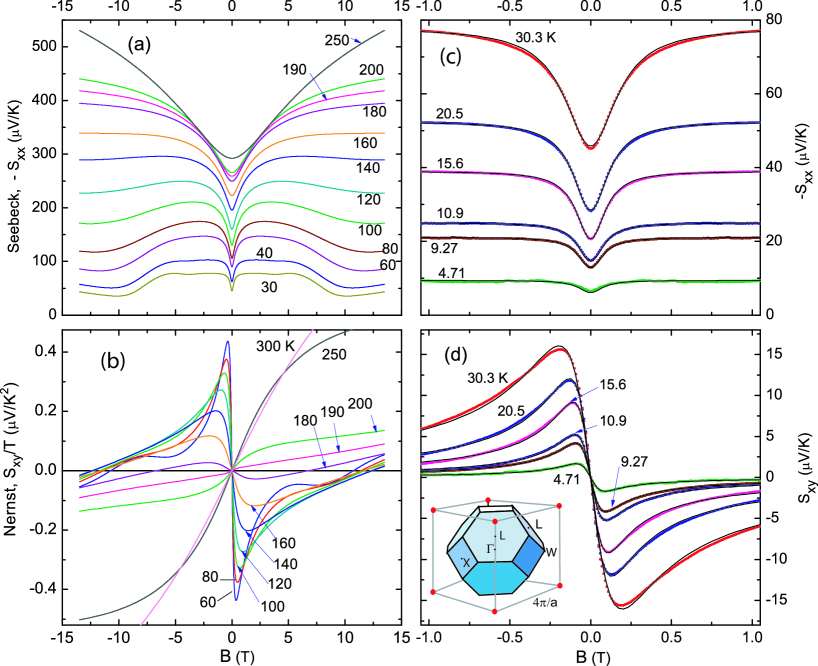
In the alloys Pb1-xSnxTe and Pb1-xSnxSe, the bulk electrons occupy 4 small Fermi Surface (FS) pockets located at the points in space (Inset, Fig. 1). The conduction band is predominantly derived from the cation Pb orbitals whereas the uppermost valence band is predominantly anion (or ) orbitals (ordering similar to the atomic limit) Wallis . As the Sn content increases, the system undergoes gap inversion when exceeds a critical value Dimmock ; Strauss ; Dow ; Daw . In samples with , gap inversion occurs when the temperature is lowered below the gap-inversion temperature . The ARPES experiments Story ; Takahashi ; Hasan confirm that the predicted topological surface states appear in the gap-inverted phase.
The new topological ideas invite a fresh look at the bulk states of the IV-VI semiconductors. To date, the gap-inversion appears to have no discernible effect on transport properties (the resistivity, Hall coefficient and thermopower vary smoothly through ). This is surprising given that transport probes the states at the Fermi level. Moreover, a long-standing prediction Wallis ; Svane is that the bulk electrons occupy states described by the massive Dirac Hamiltonian. This assumption underlies the starting Hamiltonian of Hsieh et al. Hsieh . However, no experimental test distinguishing the massive Dirac from the Schrödinger Hamiltonian has appeared to our knowledge.
We have grown crystals of Pb1-xSnxSe ( = 0.23) in which the -type carriers have high mobilities ( = 114,000 cm2/Vs at 4 K). The low electron density (3.46 cm-3) enables the quantum limit to be reached at 7.7 T (measurements reveal that holes are absent). In addition to resistivity, we have used both thermopower and the Nernst effect to probe the states in fields up to 34 Tesla. Surprisingly, the Nernst signal is observed to change its sign at . To date, this appears to be the only transport or thermodynamic quantity that is strongly affected by gap inversion.
In a thermal gradient , the diffusion of carriers produces an electric field which is expressed as the thermopower signal , and the Nernst signal . In the semiclassical regime, the Mott relation Ziman simplifies and to the form (see Methods)
| (1) | |||||
| (2) |
where . The dependence on appears only in the conductivity matrix elements (for brevity, we write ). The parameters and are independent of the mobility ( is the chemical potential). Equation 1 describes the cross-over in from (at ) to when . Correspondingly, increases linearly from 0 to peak at the value at before falling as when . For -type carriers, both and are negative, and . By Eq. 2, the Nernst signal is positive if (we discuss the sign convention in Methods.) In terms of the exponents and defined by and , we have and .
Even for one-band systems, Eqs. 1 and 2 have not received much experimental attention, possibly because real materials having only a single band of carriers with a low density (and high mobility) are rare. The analysis of is complicated by the extreme anisotropy of the FS pockets in many semi-metals. For recent Nernst measurements on Bi and Bi2Se3, see Ref. Behnia1 ; Behnia2 . For results on in graphene, see Refs. Kim ; Wei ; Checkelsky . The angular variation of the SdH period in Bi is investigated in Refs. LuLi ; Behnia3 .
We show that Pb1-xSnxSe crystals that are hole-free satisfy these 3 constraints. We find that Eqs. 1 and 2 provide a very good fit to and in the semiclassical regime. From the fits, we can identify the sign anomaly of the Nernst signal with the gap-inverted phase.
Strong quantum oscillations are observed in both and . By analyzing the LL oscillations, we show that the LL has only one spin degree of freedom unlike the higher LLs. This provides robust evidence that the carriers are massive bulk Dirac fermions, and confirms a premise underlying the starting Hamiltonian in Ref. Hsieh . In the quantum regime (only LL occupied), we observe an unusual thermoelectric response. The thermopower increases linearly with to our maximum (34 T). We argue that this profile can be accounted for by the massive Dirac dispersion.
Results
Semiclassical regime Figure 1a plots curves of the thermopower vs.
for selected . From 250 to 160 K, the dominant feature is the
rapid increase in weak followed by saturation to
a -independent plateau at large .
As noted, the Nernst signal (shown as in Fig. 1b) changes from positive
to negative as is decreased below 180 K (identified with ).
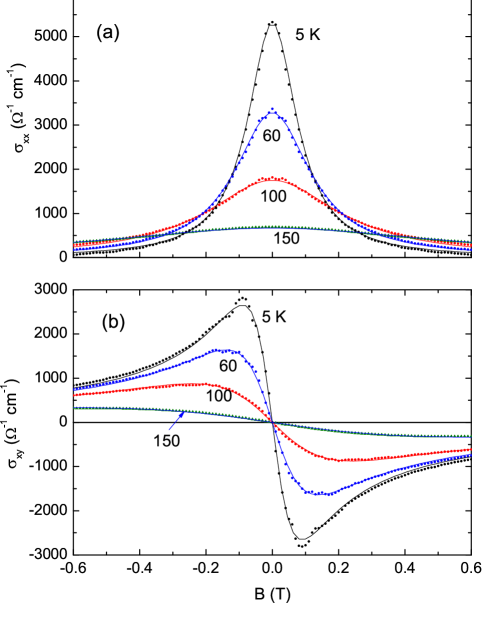
As shown in Fig. 1c, the curves of versus fit very well to Eq. 1 in the semiclassical regime ( 1 T). Likewise, below 100 K, the curves of also fit well to Eq. 2 up to an overall sign (Fig. 1d). Although the fit parameters (, , ) for are independent of those for , we find that they agree with each other (at the level of ) below 60 K (see Methods). At each , the two curves, and , are described by just 3 parameters. This provides a potent self-consistency check of Eqs. 1 and 2. As a further test, we have also fitted the measured conductivity tensor and obtained similar values for below 100 K (Methods). By and large, the close fits to both tensors and demonstrate that we have one band of carriers below 100 K.
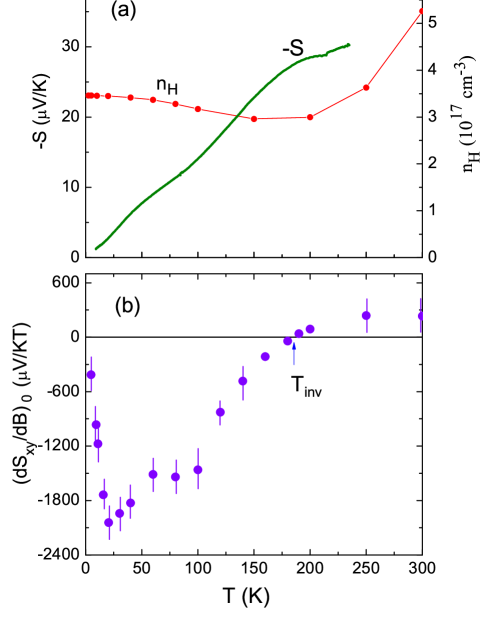
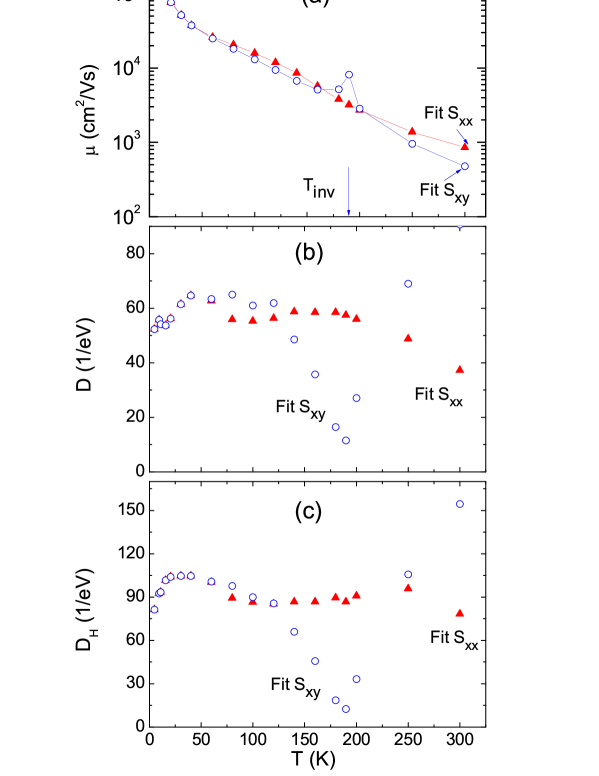
The semiclassical expressions are no longer valid when quantum oscillations appear at higher . In particular, the giant step at 7.7 Tesla in the curves at 30 and 40 K (Fig. 1a) is a relic of the quantum regime that remains resolvable up to 100 K. The step plays a key role in the discussion later. In the opposite extreme above 100 K, the two sets of fit parameters begin to deviate. The disagreement is especially acute near 180 K where changes sign. We reason that the one-band assumption breaks down because of strong thermal activation of holes as the gap closes and re-opens across . The evidence comes from the dependence of the Hall density (solid circles in Fig. 2a). Whereas is nearly -independent below 80 K, in agreement with the one-band model, it deviates upwards above 180 K. Thermal activation of a large population of holes leads to partial cancellation of the Hall -field and a reduction in .
In Fig. 2a, we have also plotted the zero- thermopower to bring out its nominally -linear variation below 100 K (bold curve). The large value of the slope = 1.41 V/K2 implies an unusually small .
As discussed, the Nernst signal changes sign at = 180 K. The dependence of its initial slope () is displayed in Fig. 2b. From the fits to Eqs. 1 and 2, we may address the interesting question whether the sign anomaly occurs in the gap-inverted phase () or in the uninverted phase. On both sides of , the fits of imply (i.e. always increases as goes from 0 to values ). As , we should observe a positive . Hence the sign anomaly occurs in the gap-inverted phase (in Fig. 1d, we multiplied the curves by an overall minus sign). The sign of the Nernst signal below disagrees with that inferred from Eqs. 1 and 2, despite the close fit. Further discussion of the sign anomaly is given below (see Discussion). However, we note that the sign of is independent of the carrier sign. As seen in Fig. 2a, both and vary smoothly through without a sign change.
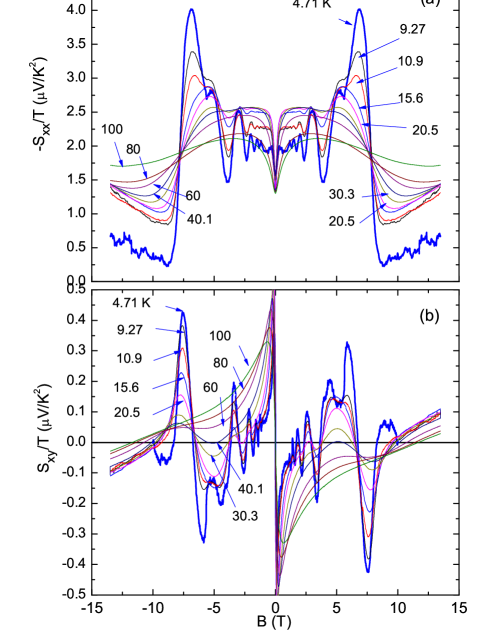
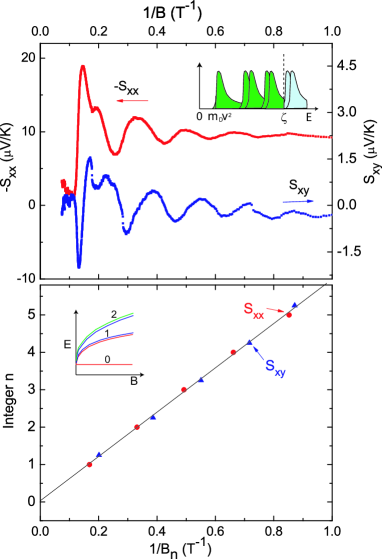
Quantum oscillations As shown in Fig. 3, oscillations in and grow rapidly below 60 K to dominate the weak- semiclassical profile. The most prominent feature in is the large step-decrease at the field = 7.7 T (at which the chemical potential jumps from the LL to the LL). In the Nernst curves, plotted as in Panel (b), the quantum oscillations are more sharply resolved. Because is the off-diagonal term of the tensor , its maxima (or minima) are shifted by period relative to the extrema of the diagonal (analogous to the shift of relative to ). This shift is confirmed in Fig. 4a which plots the traces of and vs. . For the analysis below, we ignore the weak spin-splitting which is resolved in the =1 LL (and barely in ).
Figure 4b shows the index plot of (inferred from the maxima in and ) plotted versus the integers . From the slope of the line, we derive the Fermi Surface section = 5.95 T = 5.67 m-2. Assuming a circular cross-section, we have = 0.0134 Å-1. The electron concentration per FS pocket is then = 8.2 cm-3. As there are 4 pockets, the total carrier density is cm-3, in good agreement with the Hall density at 4 K (3.46 cm-3).
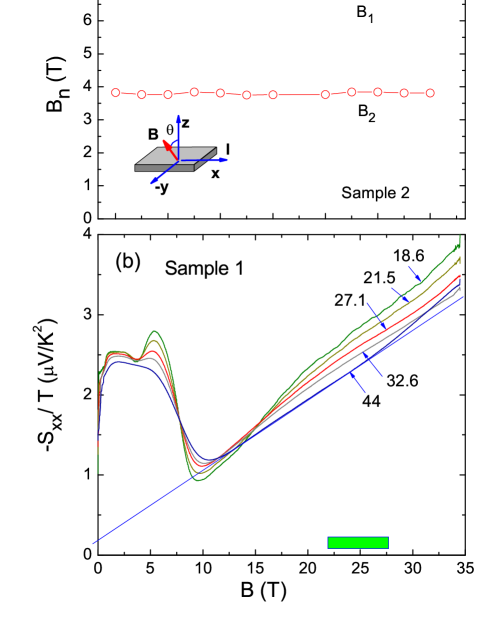
Using sample 2, we have tracked the variation of the SdH period versus the tilt angle of . Figure 5a plots the fields and versus ( is rotated in the - plane). Here, and are the fields at which jumps from and from , respectively. To our resolution, the SdH period is nearly isotropic. The fields and are also independent of tilt angle when is rotated in the - plane. This justifies treating the FS pockets as nominally spherical.
The N=0 Landau Level We next address the question whether the bulk states in the inverted phase are Dirac fermions or Schrödinger electrons. The two cases differ by a distinctive feature in their LL spectrum that is robust against small perturbations. In the quantum limit, the massive Dirac Hamiltonian exhibits an interesting two-fold difference in degeneracy between the and levels. Wolff Wolff considered a 3D massive Dirac Hamiltonian with spin-orbit interaction but no Zeeman energy term. More recently, Serajedh, Wu and Phillips Phillips included the Zeeman energy term as well as a Rashba term in the massive 2D Dirac Hamiltonian. Other 3D massive Dirac cases are discussed by Bernevig Bernevig . All these authors find that the LL is non-degenerate with respect to spin degrees, whereas the LLs with are doubly spin-degenerate. (We discuss in Methods a pedagogical example which shows that this anomaly is related to the conservation of states.) By contrast, for the Schrödinger case, all LLs are doubly degenerate.
In Pb1-xSnxSe, the ability to measure accurately both and the “jump” field provides a crisp confirmation of this prediction.
The energy of the LL is , where is the Dirac mass and the magnetic length Bernevig . At , lies just below the bottom of the LL so that all the electrons are accomodated in the LL. Integrating the density of states (DOS) for one spin polarization in the LL from to , we find (see Methods)
| (3) |
Ignoring the small spin splitting, we equate with 7.7 T. Equation 3 then gives cm-3, which agrees within with the measured (the agreement is improved if we correct for spin splitting). All the electrons are accomodated by an LL that is non-degenerate, in agreement with the prediction for massive Dirac states Wolff ; Phillips ; Bernevig , but disagreeing with the Schrödinger case by a factor of 2. Since the singular spin degeneracy of the LL cannot be converted to a double degeneracy, the experiment uncovers a topological feature of the bulk states that is robust. As predicted in Refs. Wolff ; Phillips ; Bernevig , the LL has only one spin state (0,+); the spin-down partner (0,-) is absent.
To check this further, we extended measurements of to 34 T to search for the transition from the sublevel (0,-) to (0,+) (which should occur if the LL were doubly degenerate). From extrapolation of the spin-split and LLs, we estimate that the transition (0,-)(0,+) should appear in the interval 22-28 T. As shown in Fig. 5b, the measured curves show no evidence for this transition to fields up to 34 T.
Finally, we note an interesting thermopower feature in the quantum limit. At fields above , displays a -linear profile that extends to 34 T (Fig. 5). The -linear behavior is most evident in the curve at 44 K. As is decreased to 18.6 K, we resolve a slight downwards deviation from the linear profile in the field interval 10-20 T. The -linear profile appears to be a characteristic property of massive Dirac fermions in the quantum limit. We discuss below a heuristic, semiclassical approach that reproduces the observed profile.
Discussion
We summarize the electronic parameters inferred from our experiment and relate
them to ARPES measurements.
As noted, the FS section derived from the index plot (Fig. 4b) corresponds to a total electron density cm-3, in good agreement with the Hall density at 4 K (3.46 cm-3).
We may estimate from the slope of the thermopower = 1.41 V/K2. Using the Mott expression , we find for the Fermi energy meV. For the massive Dirac dispersion, we have , which implies that has the minimum value 3 (if the mobility increases with , is larger). Using the lower bound, , gives = 51 meV.
These numbers may be compared with ARPES. We estimate the Fermi velocity from the expression (valid when with the Dirac mass). Using our values of and , we find = 5.74 m/s as the lower bound. Although ARPES cannot resolve in the conduction band, the best ARPES estimate Hasan2 for the hole band velocity is 5.6 m/s, in good agreement with our lower bound. It is likely that the conduction band has a higher velocity (which would then require 3).
One of our findings is that gap inversion changes the sign of the Nernst signal. Because the energies of states involved in gap inversion are very small, the resulting dispersion can be hard to resolve by ARPES Hasan2 . Transport quantities would appear to be more sensitive to these changes. As noted, however, most transport quantities are either unaffected or only mildly perturbed. The Hall effect and thermopower are unchanged in sign across (Fig. 2a). While shows a gradual increase, this is largely attributed to thermal activation of holes across a reduced gap for . Hence, the dramatic sign-change observed in stands out prominently; its qualitative nature may provide a vital clue.
It has long been known Strauss that, in the lead rock-salt IV-VI semiconductors, the energy gap undergoes inversion as the Sn content increases from 0. Moreover, within a narrow range of , gap inversion is also driven by cooling a sample (the critical temperature is dependent within this interval). Strauss Strauss performed early optical transmission measurements of in a series of single-crystal films of Pb1-xSnxSe with ranging from 0 to 0.35. For , he reported that closes at 195 K. A slight interpolation of his data shows that, at our doping , should vanish at 179 K, remarkably close to our = 180 K. The recent ARPES measurements of Dziawa et al. Story is consistent with closing between 100 and 200 K. ARPES measurements by Hasan’s group Hasan2 on a crystal from the same batch as our samples shows that crosses zero between 80 and 150 K. Given the ARPES resolution, these results are all consistent with our inference that our corresponds to the gap inversion temperature. Hence we reason that the Nernst signal changes sign either at, or very close to, the gap inversion temperature. The inverted sign of below 180 K in Figs. 1c,d occurs in the gap inverted phase. (We refrain from making the larger claim that this is also the topological transition because we are unable to resolve the surface states in our experiments.)
The fits of to Eq. 2 (Fig. 1d) shows that the curves below 100 K are well-described by the Boltzmann-Mott expression assuming a single band of carriers, but there is an overall sign disagreement. Despite the sign problem, the analysis singles out the physical factors that fix the sign, and delineates the scope of the problem. For example, reversing the sign of both and inverts the sign of , but also that of . Alternately, one might try reversing the signs of , and simultaneously. This will invert the sign of but leave unchanged. However, is forced to change sign.
The analysis assumes that, in the gap-inverted phase, the FS is simply connected. This may not be valid. Gap inverion may lead to the existence of a small pocket surrounded by a larger FS sheet (topologically similar to the FS of the “giant Rashba” material BiTeI BTE ). As the small pocket dominates the thermoelectric response, the Nernst effect may be detecting this novel situation. These issues will be left for future experiments.
We may attempt to understand the striking -linear profile of in Fig. 5 using a semiclassical approach. In the LL, the long-lived quasiparticles complete a large number of cyclotron orbits between scattering events (e.g. from 220, we estimate this number is 35 at 20 T). The scattering results in the drift of the orbit centers in a direction transverse to the applied . Ignoring the fast cyclotron motion, we may apply the Boltzmann equation to . The thermopower is then given by the high- limit of Eq. 1, , where is now measured from the bottom of the LL, and differs from the weak-field . In this picture, the dependence of arises solely from how changes with .
For , only the LL is occupied. From Eq. 14 (Methods), we have the relation between and , viz.
| (4) |
In the limit , we obtain the relation . This immediately implies that increases linearly with as observed. Setting , we derive from Eq. 4 the rate of increase
| (5) |
Repeating this calculation for the Schrödinger case, we get instead .
From Fig. 5, the thermopower slope = 8.71 V/K2T. Using the above values of and in Eq. 5, we find V/K2T. The value of is not known. Comparison of the calculated slope with experiment suggests 1.5. Hence this back-of-the-envelop estimate can account for the rate at which increases with .
Methods
Semiclassical fits to and
In the presence of a magnetic field , an electric field and a temperature gradient (in an infinite medium),
the total current density is given by Ziman
.
Here is the conductivity tensor and is the thermoelectric tensor.
Setting = 0 (for a finite sample), and solving for , we have
, with
the resistivity tensor.
In the geometry with and , the components of the -field (for an isotropic system) are
| (6) | |||||
| (7) |
The thermoelectric tensor is given by ( for hole carriers and if when ).
The Mott relation Ziman ,
| (8) |
( is Boltzmann’s constant, is the elemental charge and the chemical potential) has been shown to hold under general conditions, e.g. in the Quantum Hall Effect (QHE) Girvin ; Jonson . Using Eq. 8, Eqs. 6 and 7 reduce to Eqs. 1 and 2, respectively.
The fits of to these equations displayed in Fig. 1d were carried out using the one-band, Boltzmann-Drude expressions for the conductivity tensor, viz.
| (9) | |||||
| (10) |
where the total carrier density is 4 ( is the density in each of the Fermi Surface pocket at the L points).
In the geometry with and , we define the sign of the Nernst signal to be that of the -component of the E-field . More generally, if is the E-field produced by the Nernst effect, the sign of the Nersnt signal is that of the triple product . This agrees with the old convention based on “Amperean current” Bridgman and with the one adopted for vortex flow in superconductors Yayu06 .
At each , we have fitted the measured curves of and vs. to Eqs. 1 and 2 using Eqs. 9 and 10 for the conductivity tensor. The separate fits of and yield two sets of the parameters , and which are displayed in Fig. 6 (solid triangles and open circles, respectively). The 3-parameter fit places strong constraints on the curves of and . Disagreement between the 2 sets signals that the one-band model is inadequate.
Below 100 K, the two sets agree well, whereas closer to they begin to deviate. The reason is that Eq. 2 cannot account for the change of sign in the Nernst signal given the relative magnitudes of and fixed by the curves of . Above 200 K, the 2 sets are inconsistent because thermal excitations of holes across the small band-gap is important at elevated , and the one-band assumption becomes inadequate. This is evident in the onset above 200 K of significant dependence in the Hall density (see Fig. 2a).
[We remark that is directly obtained from the observed voltage difference and the temperature difference between longitudinal electrical contacts (their spatial separation is immaterial). However, for the Nernst signal, we have , where is the spatial separation between the transverse contacts. Hence the aspect ratio is needed to convert the observed Nernst voltage to . The ratio is measured to be 40.4. The fits are improved significantly if this value is refined to 4.20, which we adopt for the curves at all .]
Fits to Eqs. 9 and 10 of the conductivity tensor measured in the same sample are shown in Fig. 7 for weak at selected from 5 to 150 K. The fits yield values of the mobility similar to those shown in Fig. 6a. The inferred carrier density is also similar to the measured Hall density .
Indexing the Quantum oscillations For 3D systems, one identifies the index field as the field at which the DOS displays a sharp maximum (diverging as in the absence of disorder). From the quantization rule for areas in -space, is related to the FS cross-section as
| (11) |
where and (the Onsager phase) is for Schödinger electrons. The plot in Fig. 3b follows Eq. 11. From its slope, we obtain . The intercept is close to zero in Fig. 3b. We will discuss elsewhere.
(We note that, in 2D systems in the QHE regime, the index field is the field at which the chemical potential falls between adjacent LLs, where the DOS vanishes, and the Hall conductance displays a plateau. The difference between 2D and 3D systems arises because the integer counts the number of edge states in the QHE case, whereas indexes the DOS peaks in the 3D case. One needs to keep this in mind in interpreting .)
We have verified that the slope in Fig. 4b is insensitive to the tilt angle of relative to the crystalline axes. As shown in Fig. 5a, the SdH period is virtually independent of within the experimental uncertainties, consistent with negligible anisotropy in the small FS pockets. The good agreement between and (Hall density) at 5 K is also evidence for a negligible anisotropy.
Spin degeneracy in =0 LL Knowledge of the field (the transition from to the LL) and the electron density per valley suffices to determine the spin degeneracy of the LL.
For the 3D Dirac case Bernevig , the energy in the LL is
| (12) |
with the Dirac mass, the component of along , and the magnetic length.
For the LL, we solve for
| (13) |
where .
Let us assume that only the LL is occupied. To obtain the relation linking and , we integrate the 3D density of states , with the spin degeneracy and the 2D LL degeneracy per spin. Using Eq. 13, we have
| (14) |
This equation is valid until is reduced to the jump field , whereafter electrons enter the LL. At the jump field, lies just below the bottom of the LL, i.e. . Using this in Eq. 14, we have
| (15) |
In relation to Eq. 3, we showed that Eq. 15 gives a value equal (within 10) to the total electron density per valley if , i.e. when , all the electrons can be accomodated by the LL with only one spin polarization. This is direct evidence for the non-degeneracy of the LL.
Interestingly, Eq. 15 is identical for the isotropic Schrödinger case, for which
| (16) |
where and is the mass. However, for the LL of the Schrödinger spectrum, we must have , so it can be excluded.
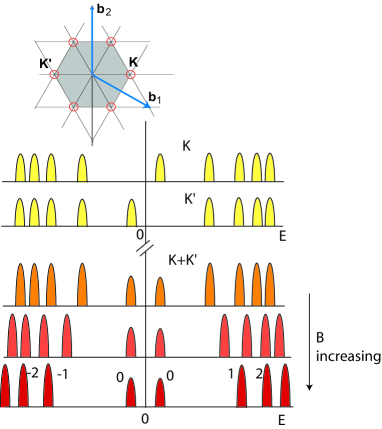
A simple example of massive Dirac spectrum An example illustrating the non-degeneracy of the LL is the spinless fermion on the 2D hexagonal lattice (valley degeneracy replaces spin degeneracy in this example). The sublattices A and B have distinct on-site energies and as in BN. The Dirac cones remain centered at the inequivalent “valleys” K and K’ in space (inset, Fig. 8). Both valleys acquire a mass gap.
For states close to the valley at K, the 2D massive Dirac Hamiltonian is
| (19) |
in the basis (pseudospin up) and (pseudospin down), where k is measured from and represents the gap parameter proportional to (we set the velocity to 1). In a field , we replace by with the vector gauge . Introducing the operators
| (20) |
with , and eigenstates satisfying
| (21) |
we diagonalize the Hamiltonian to get eigenenergies given by
| (22) |
(for brevity, we will write for ).
For positive , the (unrenormalized) 2-spinor eigenstates are (for )
| (25) |
For the negative energy states, the corresponding eigenvectors are ()
| (28) |
Setting in Eq. 25, we find that the positive-energy state (pseudospin up). For , however, the lower entry in Eq. 28 is non-determinate (0/0). This implies that the state does not exist for . Thus, for the valley at K, there is only one LL with . It has positive energy ; the corresponding LL at is absent (we sketch the spectrum as the uppermost curve K in Fig. 8).
Repeating the calculation for K’, we find the opposite situation (the Hamiltonian is the conjugate of Eq. 19). Now the LL has energy , but the LL is absent in the positive spectrum (curve K’ in Fig. 8).
A transport experiment detects the sum of the two spectra (K+K’ in Fig. 8). In the total spectrum, the two LLs are non-degenerate whereas all LLs with have a valley degeneracy of 2. The difference simply reflects the conservation of states. In the limit , we recover the spectrum of graphene. If, at finite , each of the LLs had a valley degeneracy of 2, we would end up with an LL in graphene with 4-fold valley degeneracy.
The authors in Refs. Wolff ; Phillips ; Bernevig and others have shown that the non-degeneracy of the =0 LL also holds in massive Dirac systems even when a Rashba term and a Zeeman energy term are included.
References
- (1) Liang Fu, Topological Crystalline Insulators, Phys. Rev. Lett. 106, 106802 (2011).
- (2) Timothy H. Hsieh, H. Lin, J. Liu, W. Duan, A. Bansil and L. Fu, Topological crystalline insulators in the SnTe material class, Nature Commun. 3, 982 (2012).
- (3) Hasan, M. Z. & Kane, C. L. Colloquium: Topological insulators. Rev. Mod. Phys. 82, 3045-3067 (2010).
- (4) Qi, X-L. & Zhang, S-C. Topological insulators and superconductors. Rev. Mod. Phys. 83, 1057-1110 (2011).
- (5) P. Dziawa, B. J. Kowalski, K. Dybko, R. Buczko, A. Szczerbakow, M. Szot, E. Lusakowska, T. Balasubramanian, B. M. Wojek, M. H. Bernstsen, O. Tjernberg, and T. Story, Topological crystalline insulator states in Pb1-xSnxSe Nature Mater. 11, 1023 (2012).
- (6) Y. Tanaka, Z. Ren, T. Sato, K. Nakayama, S. Souma, T. Takahashi, K. Segawa and Y. Ando, Experimental realization of a topological crystalline insulator in SnTe, Nature Phys. 8, 800 (2012).
- (7) Su-Yang Xu, Chang Liu, N. Alidoust, M. Neupane, et al., Observation of a topological crystalline insulator phase and topological phase transition in Pb1-xSnxTe, Nature Commun. 3, 1192 (2012).
- (8) Mitchell, D. L. and Wallis, R. F., Theoretical energy-band parameters for the lead salts. Phys. Rev. 151, 581595 (1966).
- (9) Dimmock, J.O., Melngailis, I., & Strauss, A. J., Band structure and laser action in PbxSn1-xTe. Phys. Rev. Lett. 26, 1193 (1966).
- (10) A. J. Strauss, Inversion of Conduction and Valence Bands in Pb1-xSnxSe Alloys, Phys. Rev. 157, 608 (1967).
- (11) Lee, S.B. & Dow, J. D., Electronic structure of PbxSn1-xTe semiconductor alloys. Phys. Rev. B 36, 5968 (1987).
- (12) Xing Gao and Murray S. Daw, Investigation of band inversion in (Pb,Sn)Te alloys using ab initio calculations, Phys. Rev. B 77, 033103 (2008).
- (13) A. Svane, N. E. Christensen, M. Cardona, A. N. Chantis, M. van Schilfgaarde, and T. Kotani, Quasiparticle self-consistent GW calculations for PbS, PbSe, and PbTe: Band structure and pressure coefficients, Phys. Rev. B 81, 245120 (2010).
- (14) Kamran Behnia, Marie-Aude Méasson, and Yakov Kopelevich, Oscillating Nernst-Ettingshausen Effect in Bismuth across the Quantum Limit Phys. Rev. Lett. 98, 166602 (2007).
- (15) Benoît Fauqué1, Nicholas P. Butch, Paul Syers, Johnpierre Paglione, Steffen Wiedmann, Aurélie Collaudin, Benjamin Grena, Uli Zeitler, and Kamran Behnia, Magnetothermoelectric properties of Bi2Se3, Phys. Rev. B 87, 035133 (2013).
- (16) Yuri M. Zuev, Willy Chang, and Philip Kim, Thermoelectric and Magnetothermoelectric Transport Measurements of Graphene, Phys. Rev. Lett. 102, 096807 (2009).
- (17) Peng Wei, Wenzhong Bao, Yong Pu, Chun Ning Lau, and Jing Shi, Anomalous Thermoelectric Transport of Dirac Particles in Graphene, Phys. Rev. Lett. 102, 166808 (2009).
- (18) Joseph G. Checkelsky and N. P. Ong, Thermopower and Nernst effect in graphene in a magnetic field, Phys. Rev. B 80, 081413 (2009).
- (19) Lu Li, J. G. Checkelsky, Y. S. Hor, C. Uher, A. F. Hebard, R. J. Cava, N. P. Ong, Phase transitions of Dirac electrons in bismuth, Science 321, 547 (2008).
- (20) Zengwei Zhu, Benoît Fauqué, Yuki Fuseya, and Kamran Behnia, Angle-resolved Landau spectrum of electrons and holes in bismuth, Phys. Rev. B 84, 115137 (2011).
- (21) See Electrons and Phonons, J. M. Ziman (Oxford Clarendon Press, 1960), p. 500.
- (22) P. A. Wolff, Matrix elements and selection rules for the two-band model of bismuth, J. Phys. Chem. Solids, 25, 1057 (1964).
- (23) B. Seradjeh, J. Wu and P. Phillips, Signatures of surface states in bismuth at high magnetic fields, Phys. Rev. Lett., 103, 136803 (2009).
- (24) Topological Insulators and Topological Superconductors, B. Andrei Bernevig and Taylor L. Hughes (Princeton Univ. Press, 2013).
- (25) P. W. Bridgman, The connnections between the four transverse galvanomagnetic and thermomagnetic phenomena, Phys. Rev. 24, 644 (1924).
- (26) Yayu Wang, Lu Li, and N. P. Ong, Nernst effect in high-Tc superconductors, Phys. Rev. B 73, 024510 (2006).
- (27) S. M. Girvin and M. Jonson, Inversion layer thermopower in high magnetic field, J. Phys. C: Solid State Phys. 15, L1147 (1984).
- (28) M. Jonson and S. M. Girvin, Thermoelectric effect in a weakly disordered inversion layer subject to a quantizing magnetic field, Phys. Rev. B 29, 1939 (1984).
- (29) M. Z. Hasan, private communication.
- (30) K. Ishizaka, M. S. Bahramy, H. Murakawa, M. Sakano, T. Shimojima, T. Sonobe, K. Koizumi, S. Shin, H. Miyahara, A. Kimura, K. Miyamoto, T. Okuda, H. Namatame, M. Taniguchi, R. Arita, N. Nagaosa, K. Kobayashi, Y. Murakami, R. Kumai, Y. Kaneko, Y. Onose and Y. Tokura, Giant Rashba-type spin splitting in bulk BiTeI, Nature Materials 10, 521 (2011).
Acknowledgements
We acknowledge helpful discussions with B. A. Bernevig, F. D. M. Haldane and M.Z. Hasan.
The research is supported by the Army Research Office (ARO W911NF-11-
1-0379) and the US National Science Foundation (Grant No. DMR
0819860). T.L acknowledges scholarship support from the Japan Student Services Organization.
High-field measurements were performed at the National High Magnetic Field Laboratory
which is supported by NSF (Award DMR-084173), by the State of Florida, and
by the Department of Energy.
Author contributions
T.L., Q.G., R.J.C. and N.P.O. planned and carried out the experiment. T.L. and N.P.O. analysed the data
and wrote the manuscript. J.X., M.H. and S.P.K. assisted with the measurements and analyses. Q.G. and R.J.C. grew the crystals.
All authors contributed to editing the manuscript.
Additional information
Supplementary information is available in accompanying article.
Correspondence and requests for materials should be addressed to T.L., Q.G., R.J.C. and N.P.O.
Competing financial interests
The authors declare no competing interests.