Methyl Cyanide Observations Toward Massive Protostars
Abstract
We report the results of a survey in the CH3CN J = 12 11 transition toward a sample of massive proto-stellar candidates. The observations were carried out with the m Submillimeter telescope on Mount Graham, AZ. We detected this molecular line in 9 out of 21 observed sources. In six cases this is the first detection of this transition. We also obtained full beam sampled cross-scans for five sources which show that the lower components can be extended on the arcminute angular scale. The higher components however are always found to be compact with respect to our beam. A Boltzmann population diagram analysis of the central spectra indicates CH3CN column densities of about cm-2, and rotational temperatures above K, which confirms these sources as hot molecular cores. Independent fits to line velocity and width for the individual components resulted in the detection of an increasing blue shift with increasing line excitation for four sources. Comparison with mid-infrared images from the SPITZER GLIMPSE/IRAC archive for six sources show that the CH3CN emission is generally coincident with a bright mid-IR source. Our data clearly show that the CH3CN J = 12 11 transition is a good probe of the hot molecular gas near massive protostars, and provide the basis for future interferometric studies.
Subject headings:
ISM: molecules – stars: formation1. Introduction
Despite the central role of massive stars in almost all areas of astronomy, the physical processes involved in the formation of stars with masses M⊙ are at present poorly understood (e.g., Zinnecker & Yorke (2007)). Theoretical and observational studies favor the idea that massive stars, similar to their lower mass counterparts, form from a collapsing cloud core. However, whether the subsequent formation of a protostar and further mass accretion occurs from an isolated massive molecular core (e.g., McKee & Tan (2003), Keto (2007)), or under the influence of a cluster environment (e.g., Bonnell et al. (2004)) remains a persistent question.
| Source | R.A. | Dec. | VLSR | d | L | rms | CH3CN | Ref.aaReferences for distance and luminosity values. |
|---|---|---|---|---|---|---|---|---|
| (J2000) | (J2000) | (km s-1) | (kpc) | ( L⊙) | (mK) | Detection | ||
| IRAS 18151 | 18:17:58.2 | :07:26 | 33.0 | 3.0 | 2 | 20 | n | (1) |
| G16.59 | 18:21:09.0 | :31:49 | 60.0 | 4.5 | 2bbSource has a distance ambiguity. Reported luminosity corresponds to the near distance. | 6 | y | (1)(2) |
| IRDC 18223 | 18:25:08.3 | :45:27 | 45.0 | 3.7 | 0.018 | 20 | n | (1)(3) |
| IRAS 18264 | 18:29:14.4 | :50:24 | 45.0 | 3.5 | 1bbSource has a distance ambiguity. Reported luminosity corresponds to the near distance. | 6 | y | (1) |
| G23.01 | 18:34:40.4 | :00:40 | 80.0 | 4.6 | 20 | 6 | y | (4)(5)(6) |
| G23.71 | 18:35:12.4 | :17:39 | 79.2 | 11.0 | 24ccSource has a distance ambiguity. Reported luminosity corresponds to the far distance. | 20 | n | (7)(8) |
| G25.83 | 18:39:03.6 | :24:11 | 91.0 | 5.6 | 8 | y | (9) | |
| G28.87+0.07 | 18:43:46.0 | :35:30 | 105.0 | 7.4 | 19 | 7 | y | (2) |
| G34.26+0.15 | 18:53:18.5 | 01:14:58 | 58.8 | 3.7 | 47 | 20 | y | (10)(11) |
| IRAS 18566+0408 | 18:59:10.0 | 04:12:16 | 85.5 | 6.7 | 6.3 | 7 | y | (1) |
| IRAS 20126+4104 | 20:14:26.0 | 41:13:32 | 1.7 | 4 | 6 | y | (12)(13) | |
| IRAS 21307+5049 | 21:32:30.6 | 51:02:17 | 3.6 | 0.4 | 14 | n | (13) (14) | |
| IRAS 21519+5613 | 21:53:38.8 | 56:27:49 | 7.3 | 1.9 | 20 | n | (15) | |
| IRAS 22172+5549 | 22:19:08.6 | 56:05:02 | 2.4 | 0.2 | 20 | n | (14) | |
| IRAS 22506+5944 | 22:52:38.7 | 60:00:56 | 5.7 | 2.2 | 20 | n | (15) | |
| IRAS 23033+5951 | 23:05:24.8 | 60:08:14 | 3.5 | 1 | 20 | n | (1) | |
| NGC 7538 S | 23:13:45.0 | 61:26:49 | 2.8 | 1.6 | 6 | y | (16)(17) | |
| NGC 7538 IRS 9 | 23:14:01.7 | 61:27:20 | 2.8 | 2 | 20 | n | (16)(17)(18) | |
| IRAS 23139+5939 | 23:16:10.3 | 59:55:28 | 4.8 | 2.5 | 20 | n | (1) | |
| IRAS 23151+5912 | 23:17:21.0 | 59:28:49 | 5.7 | 10 | 20 | n | (1) | |
| IRAS 23385+6053 | 23:40:54.5 | 61:10:28 | 4.9 | 1.6 | 20 | n | (14) |
Note. — Units of right ascension are hours, minutes, and seconds, and units of declination are degrees, arcminutes, and arcseconds.
References. (1) Sridharan et al. (2002); (2) Codella et al. (1997); (3) Beuther & Steinacker (2007); (4) Brunthaler et al. (2009); (5) Araya et al. (2008); (6) Pestalozzi et al. (2005); (7) Sewilo et al. (2004); (8) Araya et al. (2006); (9) Purcell et al. (2006); (10) Churchwell et al. (1990); (11) Watt & Mundy (1999); (12) Shepherd et al. (2000); (13) Truch et al. (2008); (14) Molinari et al. (2002); (15) Su et al. (2004); (16) Werner et al. (1979); (17) Sandell & Sievers (2004); (18) Thronson & Harper (1979)
One of the earliest observational manifestations of massive proto-stars are so-called hot molecular cores (hereafter HMCs). Named after the prototype object in the Orion KL region, they have been surveyed throughout the Galaxy in an effort to identify candidates for massive proto-stars (e.g., Sridharan et al. (2002)). Common search criteria were high FIR luminosity, high molecular column densities and temperature, and the absence of strong radio continuum emission — the latter to ensure an earlier evolutionary phase than ultra-compact (UC) or hyper-compact (HC) HII regions.
A particularly useful tracer of HMCs is the methyl cyanide (CH3CN) molecule. Due to the centrifugal deformation of this symmetric top molecule, its rotational spectrum consists of a series of closely spaced components tracing rapidly increasing excitation energies. The ladders are connected only through collisions so that excitation temperatures can in principle be measured from the ratios of components, thus avoiding the usual calibration uncertainties that occur when comparing rotational transitions observed in different frequency bands. An extensive discussion of the microwave spectroscopy of methyl cyanide is given in Boucher et al. (1980). Because of these spectroscopic properties, the CH3CN molecule is frequently used to determine temperatures in the dense molecular cores where massive stars form, using both statistical equilibrium calculations (e.g., Loren & Mundy (1984)), or the simpler rotation diagram technique (e.g., Goldsmith & Langer (1999)).
Another factor that favors the use of CH3CN as a tracer of HMCs is its enhanced abundance in warm (TK), dense (cm-3) environments (e.g., Blake et al. (1987)). This is generally thought to be caused by grain surface chemistry, either by primary reactions on the grain surface with subsequent release into the gas phase when the grain mantle evaporates, or, alternatively, by secondary reactions in the gas phase (e.g., Charnley et al. (1992), Bisschop et al. (2008)). Recently, Codella et al. (2009) reported detection of CH3CN in the outflow lobes of the low-mass protostar L1157-B1, and attributed the enhanced CH3CN abundance to shock chemistry. From these studies it is well-established that CH3CN traces an energetic environment similar to that expected in the immediate vicinity of massive proto-stars.
To investigate the HMC phase of massive star formation, several single dish CH3CN surveys have been made (e.g., Olmi et al. (1993), Araya et al. (2005), Pankonin et al. (2001)), and a small number of sources have also been studied with mm-interferometers (e.g., Cesaroni et al. (1994), Hofner et al. (1996), Furuya et al. (2008)). Several of the interferometric studies resulted in images of CH3CN structures that are elongated perpendicular to the direction of molecular outflows, with velocity gradients along the elongated structures; this is usually explained as rotational motion of a circumstellar disk or torus (e.g., Beltrán et al. (2011)). The CH3CN molecule is thus a good choice to trace accretion disks around massive proto-stars, whose existence (if confirmed), and properties will be important input for current models of massive star formation.
From the above discussion it is clear that observations of CH3CN with high sensitivity and angular resolution are well-suited to study accretion disks around massive stars. Such observations have recently become more accessible using instruments such as the Submillimeter Array (SMA) and ALMA. To facilitate such observations in the CH3CN J = 12 11 line, the present study adds to the existing database of single dish studies of methyl cyanide.
2. Observations and Data Reduction
We observed 21 sources in 2008 from May 26 to 31 in the 1.3 mm CH3CN J = 12 11 transition with the 10 m Heinrich Hertz Submillimeter Telescope (SMT)111Operated by the Arizona Radio Observatory (ARO) at the University of Arizona on Mt. Graham, AZ. The telescope beam width at mm is approximately 36, and the pointing accuracy during our observing run was better than 7. The pointing positions and LSR velocities for the observed sources are given in Table 1. Most of our target sources are prominent HMC candidates with large IRAS luminosities. They all show the typical observational indicators of massive star formation in the HMC stage, namely massive molecular cores, H2O and CH3OH maser emission, warm molecular gas, weak (or absent) radio continuum emission, and the presence of jets and molecular flows. An exception is IRDC 18223-3, which is a massive infrared dark cloud with an embedded protostar, which may be in an earlier evolutionary state (Beuther & Steinacker, 2007).
The observations were conducted in double sideband mode using the 1.3 mm J–T ALMA sideband separating receiver222 http://aro.as.arizona.edu/smt_docs/receivers/1.3mm_ALMA/Manual.pdf, which simultaneously recorded two linear orthogonal polarizations. The CH3CN J = 12 11 transition ( = GHz, Boucher et al. 1980) was tuned to the center of the lower sideband. We used all six available backends; four low spectral resolution and two high spectral resolution. The low spectral resolution backends were the acoustic-optic spectrometers (AOSs) AOS-A and AOS-B with bandwidths and spectral resolutions of MHz (km s-1) and kHz (km s-1), and two filterbanks which have bandwidths and spectral resolutions of 1.024 GHz (km s-1) and MHz (km s-1), respectively. Most of the data used for the analysis in this paper were taken with the AOS-C and the Chirp Transform Spectrometers (CTS-A), which have bandwidths and channel widths of MHz (km s-1) and kHz (km s-1) and MHz (km s-1) and kHz (km s-1), respectively.
The AOS-C bandwidth does not cover all components of the CH3CN J = 12 11 transition, hence we centered this backend on the component. This setup allowed us to observe the components simultaneously. The AOS-A and AOS-B and the filterbanks offer bandwidths between and MHz so in principle the higher components could be detected. In practice, however, the lower line strengths of the higher components prevented us from detecting them in all but the strongest source, G34.26+0.15. Furthermore, the 13CO J = 2 1 transition blends with the component of the CH3CN J = 12 11 transition, thus limiting the usefulness of this component.
The 12CO J = 2 1 transition located in the upper sideband (USB) contaminated the lower sideband data approximately 50 MHz away from the CH3CN J = 12 11 line. With the exception of G28.87+0.07, this contamination had little effect on the quality of our data. The USB rejection was approximately dB over the course of our observations. Given the relatively weak appearance of the 12CO J = 2 1 line (normally a very strong line) in our spectra, we do not believe that there is significant contamination from other spectral lines located in the USB.
Our observations were conducted using double beam switching with a switch rate of Hz and a beamthrow of 2′ with a total on/off cycle of approximately 6 minutes per scan. System temperatures ranged from 350 K to just under 200 K with an average temperature of 212 K. Focus corrections were obtained from observations of Jupiter. Whenever possible we also derived pointing corrections from cross scans of Jupiter. When Jupiter was not available or was located at a large angular distance from the target source, pointing corrections were made by observing asymptotic giant branch stars in the CO J = 2 1 transition falling in the USB. In the case of IRAS 20126+4104 we could line point using the 13CO J = 1 0 emission from the source.
At the beginning of each night of observations, we observed the strong source G34.26+0.15 for at least one scan to check for day-to-day consistency of our observations and to obtain a template source to identify contaminating spectral lines. Subsequently, all sources were observed for 12–18 minutes to determine the intensity of the components of the CH3CN J = 12 11 transition. Promising sources were then re-observed for at least 2 hr. Additionally, we obtained full beam spaced cross scans for five sources, typically with hr spent at each offset position.
The data were reduced in CLASS, which is part of the GILDAS333http://www.iram.fr/IRAMFR/GILDAS software package. All spectra were first inspected to check for bad channels or any obvious artifacts; bad scans were discarded. Subsequently, we subtracted baselines using low order polynomials, and initially averaged the spectra for each spectrometer and each day separately. After further inspection, all data taken on different days were averaged to form a final data set for each source. After Hanning smoothing and resampling to the same spectral resolution, we averaged the AOS-C and CTS-A spectrometer data. We will refer to the latter data set as ‘high resolution’ spectra. The data were calibrated using the chopper-wheel method and the antenna temperature was converted to main-beam brightness temperature by dividing the antenna temperature by the main-beam efficiency of the telescope ()444http://aro.as.arizona.edu/smt_docs/smt_efficiency.pdf.
Using the daily spectra of the strong source G34.26+0.15, we checked our data for amplitude stability, which maximum deviation from the average was found to be smaller than . Measured line widths had maximum deviations of , and the repeatability of measured frequencies, as well as the linearity of the spectrometers, was better than .
We have three common sources with Pankonin et al. (2001), who observed the same CH3CN transition with the SMT, albeit with a different receiver. These three sources are G34.26+0.15, IRAS 23139+5939 and IRAS 23385+6053, the latter two being non-detections by us as well. The results of our line fitting of G34.26+0.15 agree very well with the spectrum of the same source shown in Pankonin et al. (2001).
3. Results
3.1. Line Contamination
As mentioned above, we obtained spectra of the strong source G34.26+0.15 to study possible line contamination of the CH3CN J = 12 11 transition. In Figure 1 we show the full GHz bandpass for this source. In addition to the components of the CH3CN J = 12 11 transition many other molecular lines were detected. We used the JPL Molecular Spectroscopy Catalog (Pickett et al., 1998) in conjunction with the Cologne Database for molecular spectroscopy (CDMS, Müller et al. (2001)) to identify the detected lines.

In some cases there was a high level of ambiguity in the identities of the spectral lines. In these cases, molecules that were unambiguously detected elsewhere in the bandpass were preferentially chosen. Lines that we were unable to identify are labeled as “U” for unknown lines and are numbered according to their order of appearance. Over 60 lines were identified across the full bandpass and we have detections in the CH3CN J = 12 11 transition up to . The same transitions in the isotopologue CHCN were also detected, possibly out to . In the case of this isotopologue the and 3 components and the and higher components are blended with other lines. Absorption features are observed around the 13CO J = 2 1 line; these features are possible artifacts arising from 13CO emission in the off-beam, and the line identifications in this area of the spectrum are tentative at best.
From inspection of Figure 1, we conclude that the CH3CN J = 12 11 – 4 , 7, 8, and 10 suffer no significant contamination but the , 6 components suffer some blending with lines from other molecular species. The component is rendered useless by overlap with the 13CO line. In the analysis that follows we use the , 6 components only when we are confident that we can reasonably separate them from the other lines; the component we do not use at all.
3.2. CH3CN Line Detection and Analysis
We detected emission in the CH3CN J = 12 11 transition towards 9 of the 21 sources of the sample (see Table 1). In Figure 2 we show our high resolution spectra at the center position. components were detected up to for several sources. The upper excitation energy of the component is about K (Boucher et al., 1980), thus indicating the presence of hot molecular gas.

We have performed simultaneous Gaussian fits for all components of the CH3CN J = 12 11 transition. The FWHM of all lines was kept constant at the value measured for the unblended component, and the relative position of all lines was fixed at the theoretical values. For the main isotopologue the line was fit with 3 Gaussians when blending with CH313CN and was suspected. The line was fit taking into account that its high-frequency wing is blended with the component of CH313CN.
The magnitude of the hyperfine splitting (hfs) of the CH3CN molecule reported in Boucher et al. (1980) for the CH3CN J = 12 11 transition is MHz. Due to the large FWHM ( MHz), and the relatively low signal-to-noise detections of the higher components, we omitted the hfs in the line fitting. In Table 3 we list the line parameters from the Gaussian fits.
In Figure 3 we show the full beam spaced cross scans that we obtained toward five sources. Inspection of the figure shows that the methyl cyanide emission peaks strongly at the central position. Occasionally the lower components () were detected away from the center position (IRAS20126+4104, NGC 7538 S), indicating that for these sources the warm gas giving rise to the emission is extended on arc-minute scales, but the higher components () are always found to be compact with respect to our beam.
 |
 |
 |
 |
 |
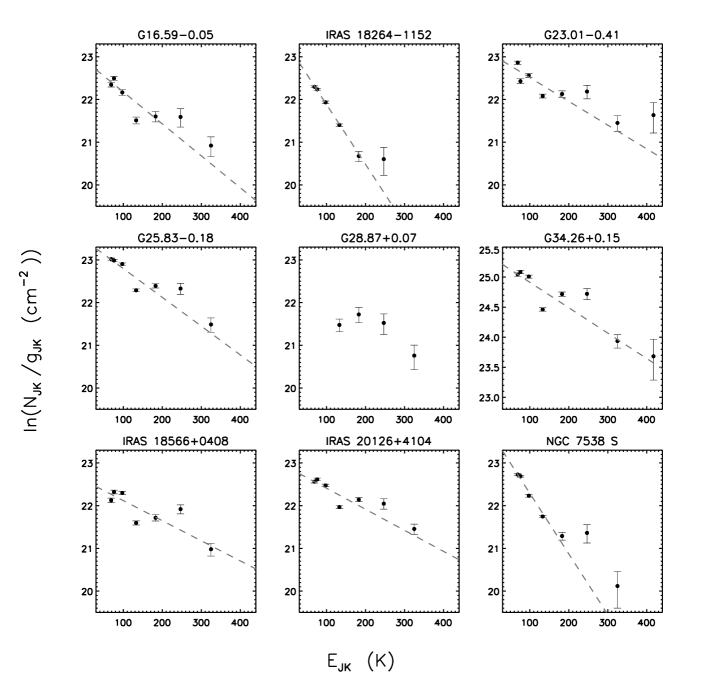
We used the population diagram technique to derive the rotation temperature and column density for our targets.
This analysis assumes optically thin lines and level populations described by a Boltzmann distribution
(e.g., Goldsmith & Langer (1999)) and furthermore that all lines trace the same volume of gas.
The data are characterized by a linear fit where the
negative reciprocal of the slope is Trot and the y-intercept is used to infer the column density (N)
(see Araya et al. (2005) for a detailed description).
When calculating the CH3CN column density we adopted a gaussian source size of FWHM of .
Figure 4 shows Boltzmann plots for all detected sources. NJK, gJK and EJK are the column density, statistical weight and upper state energy for the (J,K) state, respectively. The linear fit was made using only the CH3CN main isotopologue data. The results of our population diagram analysis are presented in Table 3.
| Source | N | Trot |
|---|---|---|
| (1014 cm-2) | (K) | |
| G16.59 | 0.6(0.2) | 134(12) |
| IRAS 18264 | 0.30(0.04) | 71(2) |
| G23.01 | 1.1(0.3) | 180(14) |
| G25.83 | 1.2(0.2) | 148(8) |
| G28.870.07aaNo reliable fit was possible. | ||
| G34.260.15 | 18.0(3) | 236(14) |
| IRAS 185660408 | 0.9(0.2) | 212(19) |
| IRAS 201264104 | 1.2(0.2) | 203(13) |
| NGC 7538 S | 0.46(0.06) | 70(2) |
Note. — A Gaussian source with FWHM of has been adopted.
With the low signal-to-noise (S/N) ratio of our spectra, detection of the CH313CN isotopologue would indicate optically thick lines. However, only for G34.26+0.15 we detected the first three components of CH313CN above a level. The optical depth of the main line (which is less blended) estimated from the ratio of the line intensities is , assuming 12C/13C. The ratio was calculated based on the abundance variation with galacto-centric distance (Wilson & Rood, 1994).
For the other targets, no reliable detection of isotopologue lines was made, therefore a detailed analysis correcting for optical depth effects was not feasible. If the assumption of optically thin conditions is incorrect, the derived temperature values are overestimated, and the column density underestimated. However, optical depths effects will not affect our principal result that relatively hot molecular gas is present in our targets.
3.3. Kinematics
The above analysis of the physical parameters assumed uniform conditions in the emitting gas. This is clearly a simplification, as in most cases one would expect gradients in the density and temperature. Allowing for non-uniformity in these parameters is not possible with the present low angular resolution data, however we consider here whether kinematic features can be detected in the CH3CN lines.
Our data in principle allow us to check for gradients in line velocity and/or line width. For most of our sources the assumption of central heating, and hence increasing temperature toward the center of the core is reasonable. Thus, any change of line kinematic parameters for the different components which have rapidly increasing excitation energies, would imply radial gradients toward the core center.
To search for radial gradients we have thus obtained independent fits for each line, where each component was fit with a Gaussian function independent of the other components. Therefore, the FWHM, line position, and intensity of the lines are free parameters in the fit. For the main isotopologue the line was fit with three Gaussians when blending with CH313CN and was suspected. The line was fit taking into account that its high-frequency wing is blended with the component of CH313CN and a vibrational line of CH3CH2OH. The results of these alternative fits are shown in Table 4.
Figures 5 and 6 show plots of velocity and line-width as a function of the upper level energy. From Figure 5 there appears to be a trend in velocity for G16.590.05, G34.26+0.15, IRAS 18566+0408, and IRAS 20126+4104. In all cases the putative velocity gradient is towards lower velocity with increasing upper state energy. The situation for the line-widths (Figure 6) is less clear. Weak evidence for increasing line width towards higher energies is present in IRAS 182641152, and G23.010.41, whereas the opposite trend is seen in IRAS 201264104. We comment further on these findings in the next section.


4. Discussion
We have used the 10 m SMT to search for CH3CN emission toward 21 regions of massive star formation. All of the regions (except for G34.260.15) are clearly in an evolutionary phase prior to that of UC or HC HII regions. We detected nine sources in the CH3CN J = 12 11 transition. For six of these sources this is the first detection in this transition. The low detection rate is likely due to the limited sensitivity of a single dish telescope with the relatively small aperture of m.
Our cross scans for 5 sources show that the are occasionally detected outside the central beam, but the higher components are always compact with respect to our angular resolution. This is consistent with a warm (TK), extended envelope which surrounds a much smaller and hotter (TK) region near the massive star. This finding is consistent with observations of other molecular transitions of lower excitation and critical density (e.g., NH3(1,1)) which probe the more extended envelope.
Our data thus indicate the presence of gradients in temperature and density. Hence, to obtain precise physical parameters interferometric observations are necessary. The single dish beam will receive emission from regions of different physical characteristics, and performing the simple technique of rotation diagram technique corresponds to obtaining average physical properties of the emitting gas. Taking also into account a number of additional uncertainties intrinsic to single dish data analyzed with the rotation diagram method (e.g., Pankonin et al. (2001)) it is difficult to compare our results with the of Olmi et al. (1993) and Araya et al. (2005). Nonetheless we note that our results for the column densities ( cm-2) are quite similar to what was obtained in these studies. However, our derived temperatures appear to be higher compared to the values of Olmi et al. (1993) and Araya et al. (2005). This might be related to the different evolutionary state of the target samples. Olmi et al. (1993) observed many known UCHII regions and the Araya et al. (2005) sample was selected from IRAS colors typical of UCHII regions, whereas our sample should represent a pre-UCHII region evolutionary phase. Higher S/N ratio data, which can put more stringent constraints on the optical depth in the lines will be required to verify this speculation.
We conclude that all detected regions contain molecular gas with TK and methyl cyanide column densities of approximately cm-2. Assuming a strongly enhanced CH3CN abundance of the hydrogen column density in these regions on a scale of , is then approximately cm-2. These numbers are consistent with the HMC nature of the detected sources.
If the core is heated from the center, then lower component emission arises predominantly from outer, and hence cooler regions and higher components will dominate in the inner, hotter regions. Consequently, velocity gradients in the ladder components can trace radial dynamics and possible kinematic scenarios may be either collapse, outflows, expansion or rotation (e.g, Cesaroni et al. (1997), Beltrán et al. (2004)). We have searched our high resolution spectra for evidence of systematic variation in velocity or line-width as a function of excitation energies.
A small number of kinematic analyses in CH3CN has been done but often no conclusive results have been found due to spectral resolution or S/N limitations. For instance, Olmi et al. (1993) did not find any reliable trend in their results. On the other hand, Cesaroni et al. (1999) observed IRAS 201264104 using the IRAM Plateau de Bure interferometer. These authors reported an increase in the velocity and line-width toward the center of the core. They suggested that this behavior may be due to rotation of a Keplerian disk surrounding an embedded massive protostar. Our results for this same region show a decrease in the velocity and the line-width toward the center, contrary to the results obtained by Cesaroni et al. (1999). A possible explanation for this discrepancy is the much larger beam of the SMT which will include more extended gas than the observations of Cesaroni et al. (1999).
We detected an increasing blue-shift, i.e., toward lower velocities with higher component for four sources. This trend could be explained by expansion or outflow motion as seen in an optically thick line. Another explanation for this behavior could be self absorption of an infalling molecular core which causes a blue asymmetry in an optically thick line. However with the given S/N ratio of our spectra we cannot clearly distinguish these scenarios. A further complication that we can not address is the multiple core scenario. In this case, the cores have some dispersion of radial velocities that may be unresolved in the beam. Therefore, to correctly interpret the detected velocity trends, further observations with higher S/N and angular resolution are needed.
 |
 |
 |
 |
 |
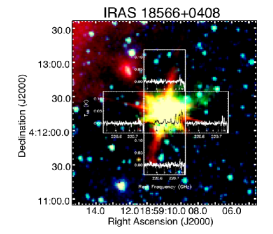 |
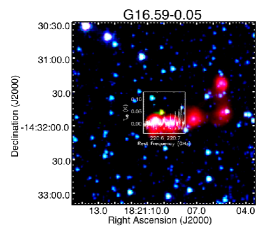
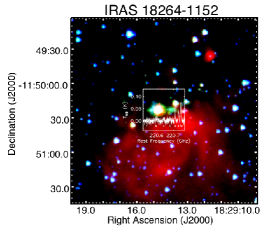
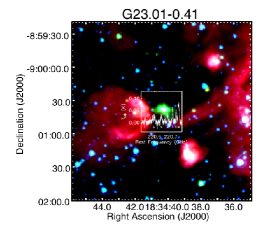
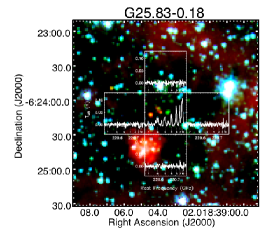
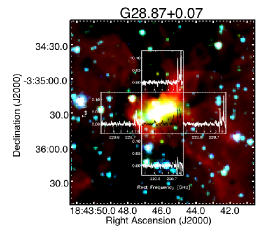
Most of the HMCs observed in this paper are associated with bright IRAS sources, indicating that a massive object has already heated the surrounding matter. In Figure 7 we show mid-infrared images of six sources for which SPITZER GLIMPSE/IRAC data are available. For five out of these six sources there is evidence for extended m excess emission (e.g., Cyganowski et al. (2008)). The presence of an extended m excess is generally thought to be caused by emission of high excitation lines from the H2 molecule, and is hence an indicator of shocked gas. Also, five out of the six sources shown in Figure 7 have strong mid-IR sources, which clearly shows that at least these HMCs have already formed massive stars which cause substantial heating of the molecular cores. One source, G25.830.18, shows only a dark cloud at the suspected position of the massive protostar. This source also harbors one of the few 6 cm H2CO masers known (Araya et al., 2008). We note that this source shows quite strong CH3CN emission, and since this molecule is thought be effectively formed only with the presence of an energy source, it is likely that a massive protostar is present in this dark cloud also. It is tempting then to speculate that due to the different mid-IR properties G25.830.18 is in an earlier evolutionary state compared to the other sources which have very bright mid-IR emission. However, using the extinction curve of Mathis (1990) we find that hydrogen column densities of cm-2 could render a possible mid-IR source undetectable. Since hydrogen column densities of this order, and larger, are common in massive star forming cores, it is conceivable that the different mid-IR appearance of G25.830.18 is caused by extinction.
5. Summary
We have observed a sample of 21 massive proto-stellar candidates in the CH3CN J = 12 11 transition using the 10 m SMT. We detected methyl cyanide in nine of the sources of the sample.
Rotation temperatures and column densities were estimated using the population diagram technique. Detected sources have temperatures 50 K and column densities of cm-2, hence they are consistent with HMC nature. Higher spectral resolution is needed in order to understand the structure of the kinematics in molecular cores.
References
- Araya et al. (2006) Araya, E., Hofner, P., Goss, W. M., et al. 2006, ApJ, 643, L33
- Araya et al. (2005) Araya, E., Hofner, P., Kurtz, S., Bronfman, L., & DeDeo, S. 2005, ApJS, 157, 279
- Araya et al. (2008) Araya, E. D., Hofner, P., Goss, W. M., et al. 2008, ApJS, 178, 330
- Beltrán et al. (2011) Beltrán, M. T., Cesaroni, R., Neri, R., & Codella, C. 2011, A&A, 525, A151
- Beltrán et al. (2004) Beltrán, M. T., Cesaroni, R., Neri, R., et al. 2004, ApJ, 601, L187
- Beuther & Steinacker (2007) Beuther, H., & Steinacker, J. 2007, ApJ, 656, L85
- Bisschop et al. (2008) Bisschop, S. E., Jørgensen, J. K., Bourke, T. L., Bottinelli, S., & van Dishoeck, E. F. 2008, A&A, 488, 959
- Blake et al. (1987) Blake, G. A., Sutton, E. C., Masson, C. R., & Phillips, T. G. 1987, ApJ, 315, 621
- Bonnell et al. (2004) Bonnell, I. A., Vine, S. G., & Bate, M. R. 2004, MNRAS, 349, 735
- Boucher et al. (1980) Boucher, D., Burie, J., Bauer, A., Dubrulle, A., & Demaison, J. 1980, Journal of Physical and Chemical Reference Data, 9, 659
- Brunthaler et al. (2009) Brunthaler, A., Reid, M. J., Menten, K. M., et al. 2009, ApJ, 693, 424
- Cesaroni et al. (1999) Cesaroni, R., Felli, M., Jenness, T., et al. 1999, A&A, 345, 949
- Cesaroni et al. (1997) Cesaroni, R., Felli, M., Testi, L., Walmsley, C. M., & Olmi, L. 1997, A&A, 325, 725
- Cesaroni et al. (1994) Cesaroni, R., Olmi, L., Walmsley, C. M., Churchwell, E., & Hofner, P. 1994, ApJ, 435, L137
- Charnley et al. (1992) Charnley, S. B., Tielens, A. G. G. M., & Millar, T. J. 1992, ApJ, 399, L71
- Churchwell et al. (1990) Churchwell, E., Walmsley, C. M., & Cesaroni, R. 1990, A&AS, 83, 119
- Codella et al. (1997) Codella, C., Testi, L., & Cesaroni, R. 1997, A&A, 325, 282
- Codella et al. (2009) Codella, C., Benedettini, M., Beltrán, M. T., et al. 2009, A&A, 507, L25
- Cyganowski et al. (2008) Cyganowski, C. J., Whitney, B. A., Holden, E., et al. 2008, AJ, 136, 2391
- Furuya et al. (2008) Furuya, R. S., Cesaroni, R., Takahashi, S., et al. 2008, ApJ, 673, 363
- Goldsmith & Langer (1999) Goldsmith, P. F., & Langer, W. D. 1999, ApJ, 517, 209
- Hofner et al. (1996) Hofner, P., Kurtz, S., Churchwell, E., Walmsley, C. M., & Cesaroni, R. 1996, ApJ, 460, 359
- Keto (2007) Keto, E. 2007, ApJ, 666, 976
- Loren & Mundy (1984) Loren, R. B., & Mundy, L. G. 1984, ApJ, 286, 232
- Mathis (1990) Mathis, J. S. 1990, ARA&A, 28, 37
- McKee & Tan (2003) McKee, C. F., & Tan, J. C. 2003, ApJ, 585, 850
- Molinari et al. (2002) Molinari, S., Testi, L., Rodríguez, L. F., & Zhang, Q. 2002, ApJ, 570, 758
- Müller et al. (2001) Müller, H. S. P., Thorwirth, S., Roth, D. A., & Winnewisser, G. 2001, A&A, 370, L49
- Olmi et al. (1993) Olmi, L., Cesaroni, R., & Walmsley, C. M. 1993, A&A, 276, 489
- Pankonin et al. (2001) Pankonin, V., Churchwell, E., Watson, C., & Bieging, J. H. 2001, ApJ, 558, 194
- Pestalozzi et al. (2005) Pestalozzi, M. R., Minier, V., & Booth, R. S. 2005, A&A, 432, 737
- Pickett et al. (1998) Pickett, H. M., Poynter, R. L., Cohen, E. A., et al. 1998, J. Quant. Spec. Radiat. Transf., 60, 883
- Purcell et al. (2006) Purcell, C. R., Balasubramanyam, R., Burton, M. G., et al. 2006, MNRAS, 367, 553
- Sandell & Sievers (2004) Sandell, G., & Sievers, A. 2004, ApJ, 600, 269
- Sewilo et al. (2004) Sewilo, M., Watson, C., Araya, E., et al. 2004, ApJS, 154, 553
- Shepherd et al. (2000) Shepherd, D. S., Yu, K. C., Bally, J., & Testi, L. 2000, ApJ, 535, 833
- Sridharan et al. (2002) Sridharan, T. K., Beuther, H., Schilke, P., Menten, K. M., & Wyrowski, F. 2002, ApJ, 566, 931
- Su et al. (2004) Su, Y.-N., Zhang, Q., & Lim, J. 2004, ApJ, 604, 258
- Thronson & Harper (1979) Thronson, Jr., H. A., & Harper, D. A. 1979, ApJ, 230, 133
- Truch et al. (2008) Truch, M. D. P., Ade, P. A. R., Bock, J. J., et al. 2008, ApJ, 681, 415
- Watt & Mundy (1999) Watt, S., & Mundy, L. G. 1999, ApJS, 125, 143
- Werner et al. (1979) Werner, M. W., Becklin, E. E., Gatley, I., et al. 1979, MNRAS, 188, 463
- Wilson & Rood (1994) Wilson, T. L., & Rood, R. 1994, ARA&A, 32, 191
- Zinnecker & Yorke (2007) Zinnecker, H., & Yorke, H. W. 2007, ARA&A, 45, 481
| Source | VLSR | FWHM | T (K km s-1) | |||||||
|---|---|---|---|---|---|---|---|---|---|---|
| (km s-1) | (km s-1) | |||||||||
| G16.59 | 59.8(0.2) | 6.2(0.6) | 0.35(0.02) | 0.41(0.02) | 0.29(0.02) | 0.29(0.02) | 0.15(0.02) | 0.14(0.03) | 0.13(0.03) | |
| IRAS 18264 | 44.17(0.01) | 5.06(0.08) | 0.336(0.007) | 0.314(0.007) | 0.227(0.007) | 0.257(0.007) | 0.059(0.007) | 0.05(0.02) | ||
| G23.01 | 78.5(0.2) | 8.3(0.4) | 0.59(0.02) | 0.38(0.02) | 0.42(0.02) | 0.51(0.02) | 0.25(0.02) | 0.25(0.04) | 0.22(0.04) | 0.11(0.04) |
| G25.83 | 93.8(0.1) | 8.1(0.3) | 0.69(0.02) | 0.66(0.02) | 0.60(0.02) | 0.62(0.02) | 0.33(0.02) | 0.29(0.04) | 0.22(0.04) | 0.12(0.04) |
| G28.870.07 | 103.4(0.4) | 6.3(1.2) | 0.28(0.04) | 0.17(0.03) | 0.13(0.03) | 0.11(0.03) | ||||
| G34.260.15 | 59.0(0.1) | 7.5(0.2) | 5.2(0.1) | 5.4(0.1) | 4.9(0.1) | 5.5(0.2) | 3.4(0.1) | 3.1(0.3) | 2.6(0.3) | 0.9(0.3) |
| IRAS 185660408 | 84.8(0.2) | 8.4(0.4) | 0.28(0.02) | 0.34(0.02) | 0.33(0.01) | 0.31(0.02) | 0.17(0.01) | 0.19(0.02) | 0.14(0.02) | |
| IRAS 201264104 | 3.8(0.1) | 7.8(0.3) | 0.44(0.01) | 0.46(0.01) | 0.39(0.01) | 0.45(0.02) | 0.26(0.01) | 0.22(0.03) | 0.22(0.03) | |
| NGC 7538 S | 55.69(0.08) | 5.5(0.2) | 0.52(0.01) | 0.49(0.01) | 0.31(0.01) | 0.36(0.01) | 0.11(0.01) | 0.11(0.02) | 0.06(0.02) | |
%tablewidth0pt
| Source | # K | TMB | VLSR | FWHM | T |
|---|---|---|---|---|---|
| (K) | (km s-1) | (km s-1) | (K km s-1) | ||
| G16.59 | 0 | 0.067(0.006) | 60.1(0.3) | 5.1(0.6) | 0.37(0.05) |
| 1 | 0.068(0.006) | 60.2(0.3) | 5.1(0.6) | 0.37(0.05) | |
| 2 | 0.049(0.006) | 59.8(0.2) | 5.0(0.4) | 0.26(0.02) | |
| 3 | 0.044(0.006) | 59.8(0.2) | 6.2(0.6) | 0.29(0.02) | |
| 4 | 0.023(0.006) | 59.2(0.4) | 6.2(1.1) | 0.15(0.02) | |
| 5 | 0.018(0.006) | 58.9(1.3) | 8.8(3.6) | 0.17(0.06) | |
| 6 | 0.022(0.006) | 59.0(0.7) | 4.9(1.9) | 0.11(0.03) | |
| IRAS 18264 | 0 | 0.076(0.006) | 44.6(0.1) | 3.9(0.2) | 0.32(0.01) |
| 1 | 0.068(0.006) | 44.2(0.1) | 3.9(0.2) | 0.28(0.01) | |
| 2 | 0.038(0.006) | 43.9(0.1) | 6.2(0.3) | 0.25(0.01) | |
| 3 | 0.048(0.006) | 44.2(0.1) | 5.1(0.2) | 0.26(0.01) | |
| 4 | 0.010(0.006) | 44.6(0.4) | 5.9(0.7) | 0.07(0.01) | |
| 5aaComponents K and K of the isotopologue CH313CN not fitted. | 0.009(0.006) | 44.8(1.5) | 11.4(2.9) | 0.11(0.03) | |
| G23.01 | 0 | 0.061(0.006) | 76.8(1.1) | 7.5(1.3) | 0.49(0.19) |
| 1 | 0.061(0.006) | 77.9(1.2) | 8.1(1.9) | 0.53(0.21) | |
| 2 | 0.047(0.006) | 77.7(0.3) | 8.9(0.8) | 0.45(0.03) | |
| 3 | 0.057(0.006) | 78.5(0.2) | 8.3(0.5) | 0.51(0.02) | |
| 4 | 0.026(0.006) | 78.2(0.5) | 10.2(1.0) | 0.28(0.03) | |
| 5 | 0.023(0.006) | 79.2(2.6) | 11.3(3.8) | 0.28(0.13) | |
| 6 | 0.021(0.006) | 77.3bbVLSR artificially constrained in the fit. | 10.2ccFWHM fixed in the fit. | 0.23(0.05) | |
| 7 | 0.016(0.006) | 77.8(1.2) | 5.9(2.4) | 0.10(0.04) | |
| G25.83 | 0 | 0.096(0.008) | 93.7(0.2) | 6.4(0.3) | 0.66(0.04) |
| 1 | 0.087(0.008) | 94.3(0.2) | 7.3(0.4) | 0.68(0.04) | |
| 2 | 0.076(0.008) | 93.7(0.1) | 6.8(0.3) | 0.55(0.02) | |
| 3 | 0.072(0.008) | 93.6(0.0) | 8.1(0.3) | 0.62(0.02) | |
| 4 | 0.046(0.008) | 93.2(0.2) | 5.9(0.3) | 0.29(0.02) | |
| 5 | 0.031(0.008) | 92.2(0.7) | 5.1(1.7) | 0.17(0.05) | |
| 6ddMolecule tCH3CH2OH not included in fit. | 0.025(0.008) | 93.6(0.9) | 7.6(3.3) | 0.21(0.06) | |
| 7 | 0.019(0.008) | 94.7(0.9) | 5.7(1.9) | 0.12(0.04) | |
| G28.870.07 | 0eeUSB emission is affecting the lines. | ||||
| 1eeUSB emission is affecting the lines. | |||||
| 2eeUSB emission is affecting the lines. | |||||
| 3 | 0.041(0.007) | 103.4(0.3) | 6.3(0.8) | 0.28(0.03) | |
| 4 | 0.024(0.007) | 103.6(0.5) | 6.9(1.1) | 0.18(0.02) | |
| 5aaComponents K and K of the isotopologue CH313CN not fitted. | 0.017(0.007) | 103.1(0.8) | 8.7(1.9) | 0.15(0.03) | |
| 6ddMolecule tCH3CH2OH not included in fit. | 0.017(0.007) | 102.9(0.8) | 6.82ccFWHM fixed in the fit. | 0.13(0.02) | |
| G34.260.15 | 0 | 0.81(0.02) | 59.5(0.4) | 7.5(0.6) | 6.4(0.8) |
| 1 | 0.65(0.02) | 59.9(0.4) | 6.0(0.6) | 4.2(0.8) | |
| 2 | 0.64(0.02) | 59.0(0.1) | 7.0(0.2) | 4.8(0.1) | |
| 3 | 0.69(0.02) | 58.9(0.1) | 7.5(0.2) | 5.5(0.2) | |
| 4 | 0.44(0.02) | 58.6(0.2) | 6.9(0.3) | 3.2(0.1) | |
| 5 | 0.35(0.02) | 58.3(0.0) | 8.4(1.6) | 3.1(0.5) | |
| 6 | 0.35(0.02) | 58.5(0.3) | 6.1(1.4) | 2.3(0.3) | |
| 7 | 0.14(0.02) | 58.1(1.0) | 5.5(2.3) | 0.8(0.2) | |
| IRAS 185660408 | 0 | 0.041(0.007) | 85.9(0.2) | 9.2(0.2) | 0.399(0.003) |
| 1 | 0.029(0.007) | 85.6(0.2) | 7.1(0.2) | 0.217(0.003) | |
| 2 | 0.038(0.007) | 83.5(0.2) | 8.1(0.2) | 0.332(0.003) | |
| 3 | 0.034(0.007) | 84.8(0.2) | 8.5(0.2) | 0.313(0.003) | |
| 4 | 0.019(0.007) | 84.1(0.2) | 7.8(0.2) | 0.162(0.003) | |
| 5 | 0.020(0.007) | 82.3(0.6) | 7.2(1.5) | 0.16(0.03) | |
| 6ddMolecule tCH3CH2OH not included in fit. | 0.011(0.007) | 83.0bbVLSR artificially constrained in the fit. | 9.5ccFWHM fixed in the fit. | 0.11(0.02) | |
| IRAS 201264104 | 0 | 0.052(0.006) | 3.7(0.3) | 9.4(0.8) | 0.53(0.06) |
| 1 | 0.046(0.006) | 2.9(0.3) | 9.1(0.9) | 0.44(0.06) | |
| 2 | 0.049(0.006) | 3.3(0.1) | 7.1(0.3) | 0.37(0.02) | |
| 3 | 0.054(0.006) | 3.8(0.1) | 7.8(0.3) | 0.45(0.02) | |
| 4 | 0.033(0.006) | 4.1(0.2) | 6.8(0.4) | 0.24(0.01) | |
| 5 | 0.024(0.006) | 5.8(0.7) | 6.4(1.6) | 0.16(0.04) | |
| 6ddMolecule tCH3CH2OH not included in fit. | 0.025(0.006) | -3.3bbVLSR artificially constrained in the fit. | 7.9ccFWHM fixed in the fit. | 0.21(0.03) | |
| NGC 7538 S | 0 | 0.108(0.006) | 55.00(0.06) | 4.9(0.2) | 0.57(0.02) |
| 1 | 0.097(0.006) | 55.07(0.06) | 3.7(0.1) | 0.39(0.02) | |
| 2 | 0.055(0.006) | 55.45(0.07) | 4.9(0.2) | 0.29(0.01) | |
| 3 | 0.062(0.006) | 55.70(0.09) | 5.5(0.2) | 0.36(0.01) | |
| 4 | 0.019(0.006) | 55.3(0.2) | 4.9(0.5) | 0.11(0.01) | |
| 5 | 0.026(0.006) | 60.0(0.7) | 7.7(2.0) | 0.21(0.04) | |
| 6ddMolecule tCH3CH2OH not included in fit. | 0.011(0.006) | 56.3(1.2) | 5.3(2.2) | 0.06(0.03) |