Inflection point as a characteristic of the QCD critical point
Abstract
The appearance of the inflection point in the equation of state (EoS) is associated with the second order phase transition. The high cumulants of conserved quantities near the critical point are corresponding to the high derivatives of the EoS near the inflection point. The critical behavior of high cumulants of conserved charge near the QCD critical point, in particular, the sign change, is closely related to the appearance of inflection point. We show in general how the times of sign change of high cumulants relate to the order of derivative. We also demonstrate that the character of inflection point of EoS is as visible as the sign change of high cumulants in 3 systems, i.e., van der Waals equation of fluid, magnetization of spin models and the baryon number density of QCD matter. Therefore, we propose that the EoS, or the mean of baryon number density, should be measured and studied together with its higher cumulants in exploring QCD critical point in heavy ion collisions.
1 Introduction
The theory of strong interaction—quantum chromodynamics (QCD)—has a complicated phase structure. Mapping the QCD phase diagram in the temperature () and baryon chemical potential () plane is currently one of the main goals of high energy nuclear physics. Lattice QCD calculations indicate that the chiral and deconfinement phase transitions are a smooth crossover at zero baryon chemical potential [1], while several QCD-based models predict a first order phase transition at high density [2, 3, 4, 5, 6]. The existence of the QCD critical point (CP), which terminates the first order phase transition line in the QCD phase diagram, is expected and being searched for in the ongoing heavy ion experiments [7].
Locating the QCD critical point is a challenge for both the theorists and the experimentalists. Due to that the precise position of the critical point is not well known from the theoretical side, a measurement from the experimental side is highly needed. By varying the center-of-mass energy of the nucleus-nucleus collisions, we can scan large regions of the phase diagram. The chemical freeze-out at different happens at different positions along the freeze-out curve [8] and therefore the trajectories of the reaction systems in the - plane have to cross different areas of the phase diagram and might even hit the critical area. When the trajectories of the reaction systems in the - plane get close to the critical point, large fluctuations appear. Assuming freeze-out happens near the CP, the large fluctuations can survive and should be observed. A non-monotonic behavior of the fluctuations from low energy to high energy is expected [9]. Several event-by-event fluctuation observables, e.g. mean transverse momentum fluctuations and the multiplicity fluctuations (here the fluctuation measures relate to the variances of the event-variable distributions, or the second order cumulants), have been analyzed at the SPS energies with GeV [10] and at the RHIC energies with GeV [11]. NA49 at SPS finds peaks in the system size dependence of the mean transverse momentum fluctuation and the multiplicity fluctuation, which agrees with predictions for the CP. However, the energy dependences of the two measures do not show any signatures for CP. The evidences for a critical point are inconclusive so far [12].
The critical point means the divergent correlation length in the thermodynamic limit. While in a realistic heavy ion collision the correlation length gets at most - fm because of the finite system size and the limited evolution time [13]. Since higher cumulants are proportional to a higher power of , higher cumulants of conserved charges are more sensitive to the critical point and were proposed as a promising observable for the search of the QCD critical point [14, 15, 16]. The cumulants are calculated from corresponding probability distributions in experiments. Theoretically, according to the grand canonical formulation of thermodynamics, the cumulants for charge X are proportional to generalized susceptibilities, which are derivatives of the pressure with respect to the corresponding Lagrange multiplier , i.e.
| (1) |
where and . Since the baryon number density is , the th order cumulant is related to the th order derivative of with respect to , i.e.
| (2) |
Besides the cumulants of charges, the cumulants of the energy are also proposed as probes of the QCD phase transition [17, 18]. At , the cumulants of the energy measure the derivatives of the EoS [18], i.e.
| (3) |
Mostly the signals are characterized by the sign or the change of the sign of various cumulants. For example, based on a general analysis and the NJL model calculations, the sign changes of the third order cumulants are proposed as signals of passing across the phase boundary [17]. Based on an universal analysis and the non-linear sigma model calculations, the fourth order cumulants (kurtosis) should be negative when the critical point is approached on the crossover side [19] and will change signs in the critical region. The possible change in the sign of the kurtosis in the critical region is also pointed out basing on a lattice calculation [20]. The oscillating behavior of the sixth order cumulants (or correspondingly the ratio of cumulants ) and the eighth order cumulants (or ) show up in the crossover region, according to the analysis of the universal scaling functions, the PQM models [21, 22] and the lattice calculations [16, 23]. However, due to the difficulties of the lattice calculations and the model estimations, the high cumulants of the net baryon number are still not final. The experimental measurements of high cumulants have various difficulties either, e.g. the centrality bin width effect [24], the lack of statistics especially at low energies, etc. Further analysis methods are being developed.
Since the cumulants of conserved charges are related to the derivatives of the equation of state, as shown in equations (2) and (3), oscillating high moments mean oscillating high derivatives. As the oscillation behavior or the sign change behavior is referred to in many papers, we have to ask: which feature of the primary function (EoS) does the oscillation of high derivatives reflect? How the critical point manifests itself in the equation of state?
In this respect, we notice that all of the observables mentioned above are related to the divergent characteristic quantities in a second order phase transition. For example, the cumulants of the energy are related to the heat capacity at fixed volume as
| (4) |
with the internal energy . If we call primary function (it can be regarded as the EoS), the second order cumulant in (3) is proportional to and higher cumulants are related to the derivatives of . The divergent peak of will result in the sign change of the next order derivative. Since , a pair of conjugate variables, and , are involved. Besides, the divergent compression coefficient
| (5) |
involves another pair of conjugate variables, and . The divergent susceptibility
| (6) |
in the ferromagnetic transition involves conjugate variables and . The divergent generalized susceptibility in equation (2) involves conjugate variables and . All of these divergent quantities (, , and ) are the derivatives of an extensive variable (, , and ) with respect to the conjugate intensive variable (, , and ). If we call (or ), , and as the equations of state, which feature will result in the sign change or oscillation in their high derivatives?
In this paper, we use a simple curve with an inflection point as an example and obtain oscillating high order derivatives, which is shown in Section 2. The law about how the number of times of sign change in the neighborhood of the inflection point relates to the order of derivatives is also summarized. In Section 3 by analyzing the inflection point of van der Waals equation of fluid, magnetization of spin models and the baryon number density of QCD matter, we demonstrate that the character of inflection point of EoS is as visible as the sign change of high cumulants. In Section 4 we propose to measure the EoS, or the mean of the baryon number density together with its higher cumulants in exploring QCD critical point in heavy ion collisions.
2 Inflection point and the oscillations of the higher derivatives
An inflection point is defined as a point on a curve at which the sign of the concavity changes. Since the concavity can be reflected by the sign of the second derivative, an inflection point also means a point on a curve at which the second derivative changes sign. So the second derivative is helpful to judge an inflection point. A necessary condition for to be an inflection point is the second derivative, , is equal to zero if it exists. A sufficient condition requires and to have opposite signs in the neighborhood of .
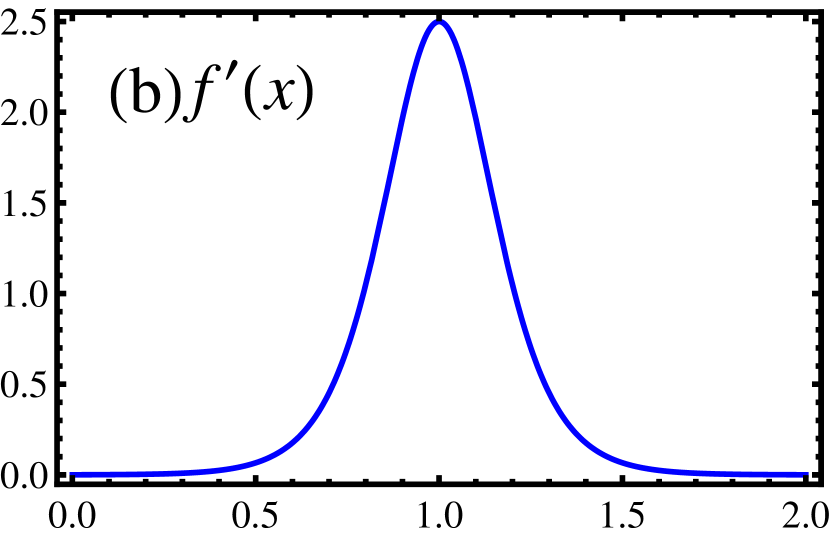
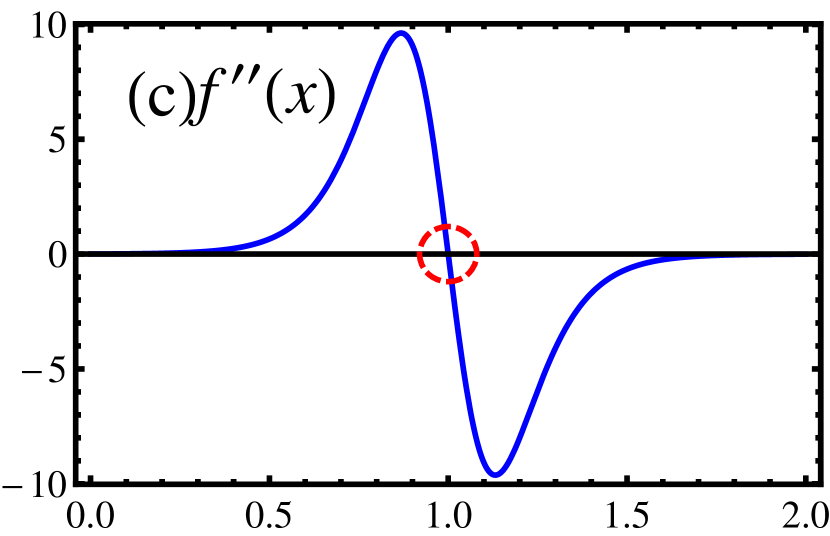
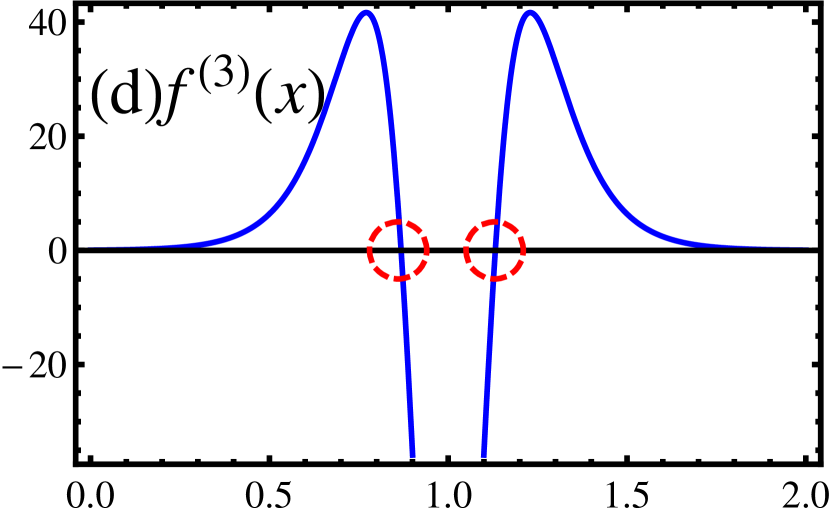
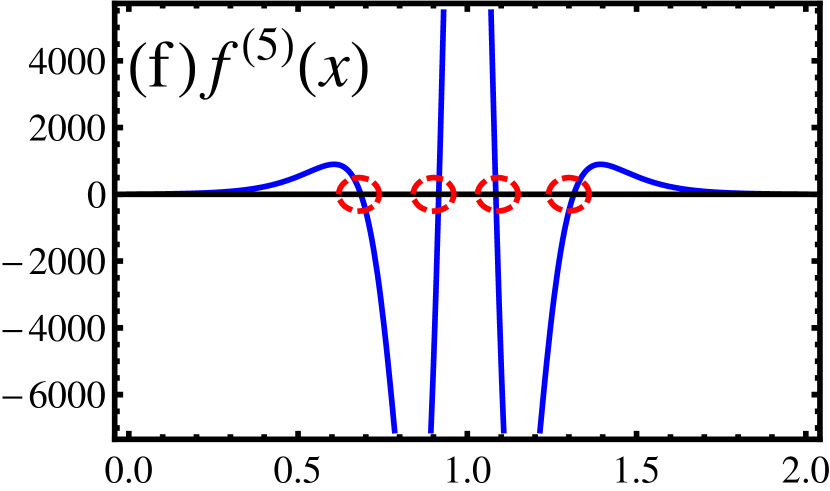
Let us demonstrate using a function with an inflection point, e.g.
| (7) |
Through requiring and observing the signs of and , we find that point is an inflection point, as shown in figure 1(a). As increases from 0 to 2, the curve changes from concave to convex. The inflection point (marked as red point in figure 1(a)) is the point where the concavity changes. Then we plot the derivatives from the first order to the fifth order and show them in figure 1(b)-(f). The first derivative (the slope of the curve) shows a peak on the interval and is at an extremum at the inflection point, i.e. a (local) minimum or maximum. At the inflection point, the second derivative changes the sign. The positions of the sign change are denoted by red open circles in figure 1. We see oscillating behavior of the high derivatives. In the neighborhood of the inflection point, the third order derivative changes the sign two times, the fourth order derivative changes the sign three times, and the fifth order derivative changes the sign four times. From this example function (7), we summarize to obtain the law about the number of times of sign change (the counting law): the th order derivative changes the sign times in the neighborhood of the inflection point.


3 Inflection point of EoS and the critical point
How the inflection point relates to the critical point are interesting in general and in particular, in QCD system. So we choose three systems in the section to see their relations.
3.1 Inflection point of the van der Waals equation of fluid
The van der Waals equation is an equation of state for a fluid which qualitatively describes the properties of the liquid phase and the gas phase as well as the phase transition between them. Although the van der Waals equation can not describe the coexistence state at the first order phase transition, it is still a good tool to demonstrate a critical point. The equation reads
| (8) |
with representing the pressure of the fluid, the molar volume and the temperature respectively. and are parameters which depends on the type of the molecule. is the universal gas constant atmlmolK-1.
For demenstrating, here we use the parameters of CO2, i.e. atmlmol-2 and lmol-1. Its critical temperature, critical volume and critical pressure would be K, l, atm. The van der Waals isotherms (- plot) for , (=310 K) and (=340 K), are shown in figure 2(a). We do not show the isotherms for since experimental isotherms do not follow the van der Waals curves at that case, as we mentioned above. When , the blue curve shows an inflection point, as marked in red in figure 2(a). As the temperature increases, the inflection point disappears gradually and the curve turns to concave in the whole interval.
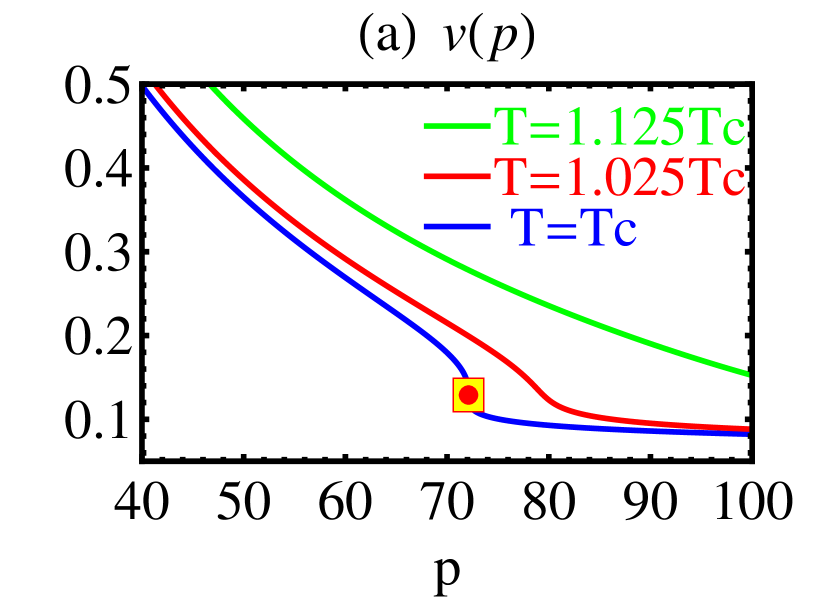
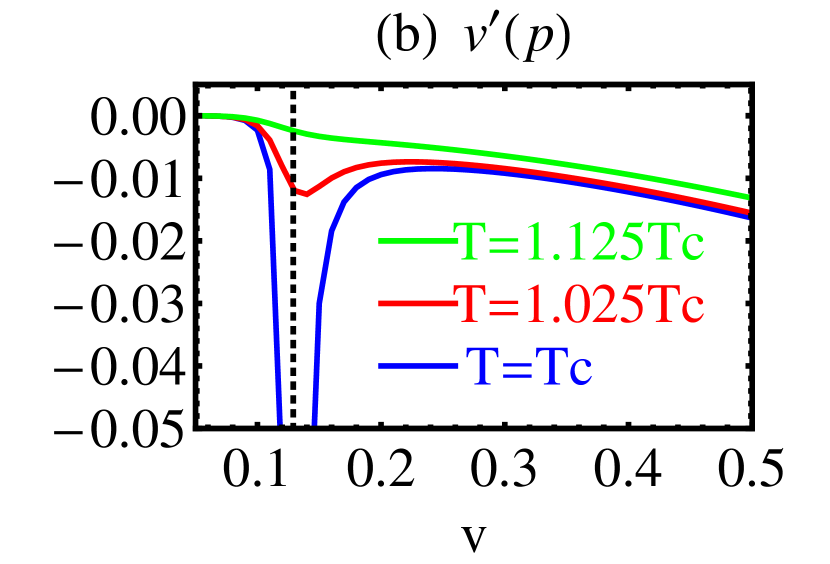
The first derivative of at fixed temperatures is shown in figure 2(b). When , the first derivative shows a cuspal peak at the critical position. As the temperature increases to , the peak shrinks. At , the peak nearly disappears. The first derivative of at fixed temperatures is proportional to the isothermal compression coefficient (see equation (5)). The discontinuity or divergence of the compression coefficient is one of the features of the second order phase transition passing through the critical point. The divergence of is equivalent to the divergence of the first derivative . Here we show that it is the inflection point in figure 2(a) that leads to the divergence of the compression coefficient.
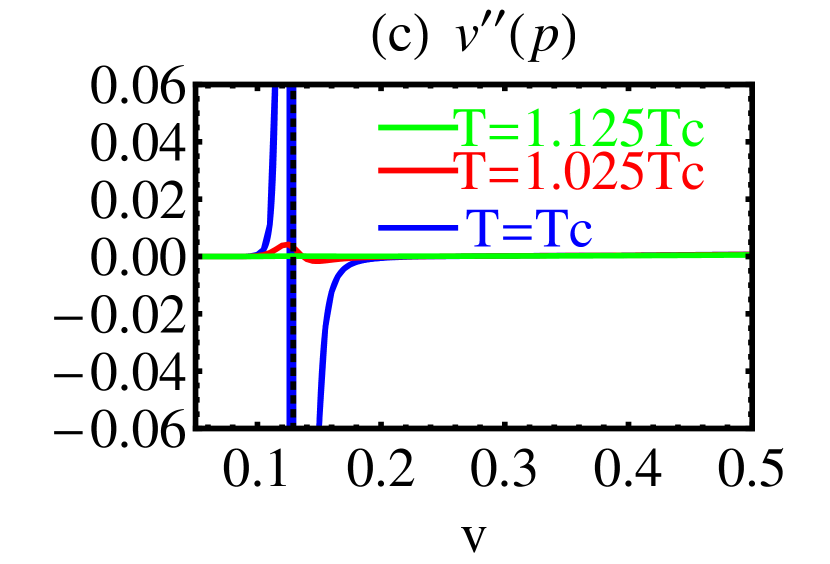
Figure 2(c) shows the second derivative of at fixed temperatures. At , prominent sign change occurs at the critical position, which exactly is the inflection point in the critical isotherms in figure 2(a). An inflection point certainly means the sign change of the second derivative, as defined. In paper [17], the sign change is proposed as the signal of the critical point. We note that, the intrinsic nature of the sign change is the existence of an inflection point in the equation of state. Essentially it is the inflection point that leads to the sign change of high order derivatives. In a broad sense, inflection point of EoS is a characteristic of the critical point.
It is worth noting that the derivatives of with respect to show signals of the CP, while the converse of this derivatives, i.e. the derivatives of with respect to , do not show any signals. This means that we may not observe the critical behavior by improper observables. The selected observables greatly affect whether we observe the CP. According to an analysis in the introduction, we regard the derivatives of the extensive variable with respect to its conjugate intensive variable as good observables.
3.2 Inflection point of the magnetization in the spin models
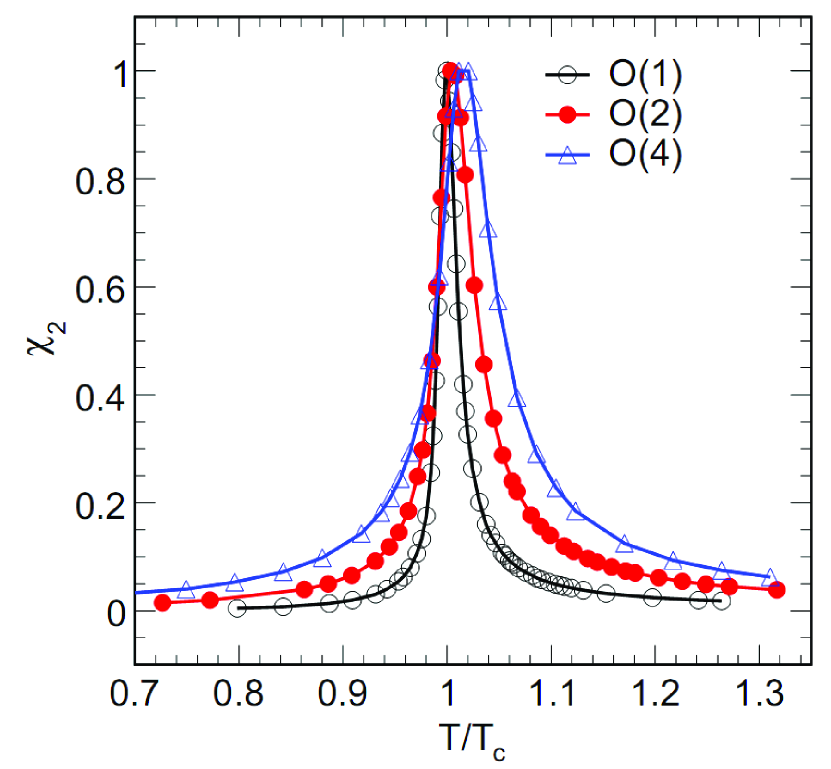
In the 3-dimensional O(1)(Ising), O(2) and O(4) spin models without external magnetic field, which are good examples to show the critical behaviors, it is found that all higher cumulant ratios change dramatically the sign near the critical temperature [25]. They define
| (9) |
where denotes the free energy density and denotes the magnitude of the external magnetic field. The first derivative in equation (9), , is the magnetization , i.e. the order parameter in the spin models, which is shown in figure 3(a). The function is usually regarded as the equation of state. (9) is equivalent to
| (10) |
An inflection point is obviously seen in figure 3(a). According to equation (10), is the usual susceptibility, which shows a finite peak in the vicinity of critical temperature in the Monte Carlo simulation, see figure 3(b). The magnetization process without external magnetic field, as simulated in [25], is a second order phase transition. The susceptibility should be divergent in the thermodynamic limit and be a finite peak in a finite system, as expected. The second derivative of EoS , i.e. plotted in figure 3(c), shows sign change. The sign change in the second derivative means there is an inflection point in the EoS. They also report oscillating behavior in and in [25] which are not shown here. Essentially, it is the inflection point of EoS that results in an oscillating behavior of the high cumulants.
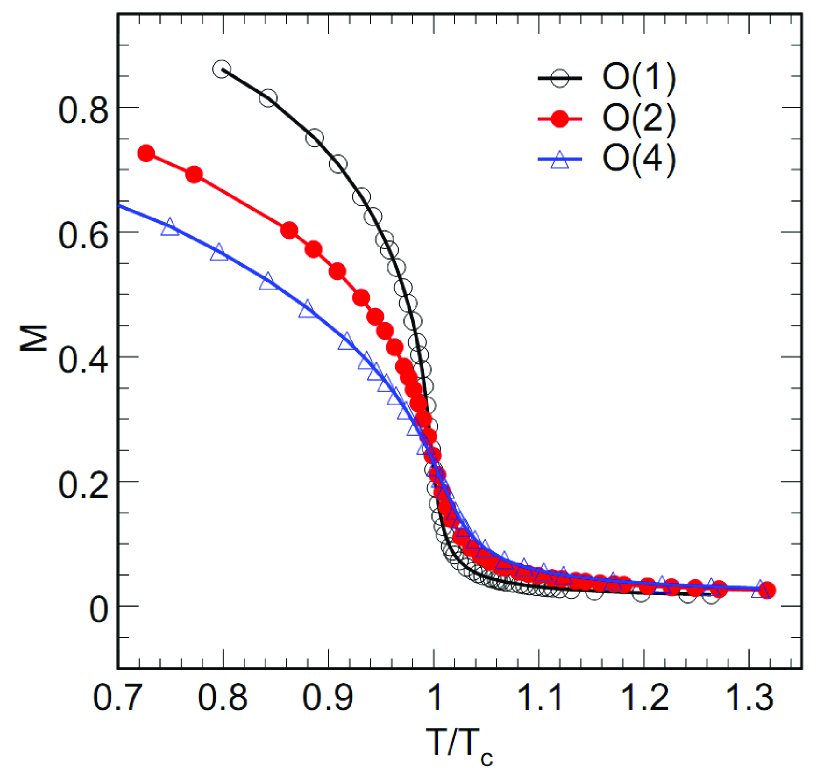
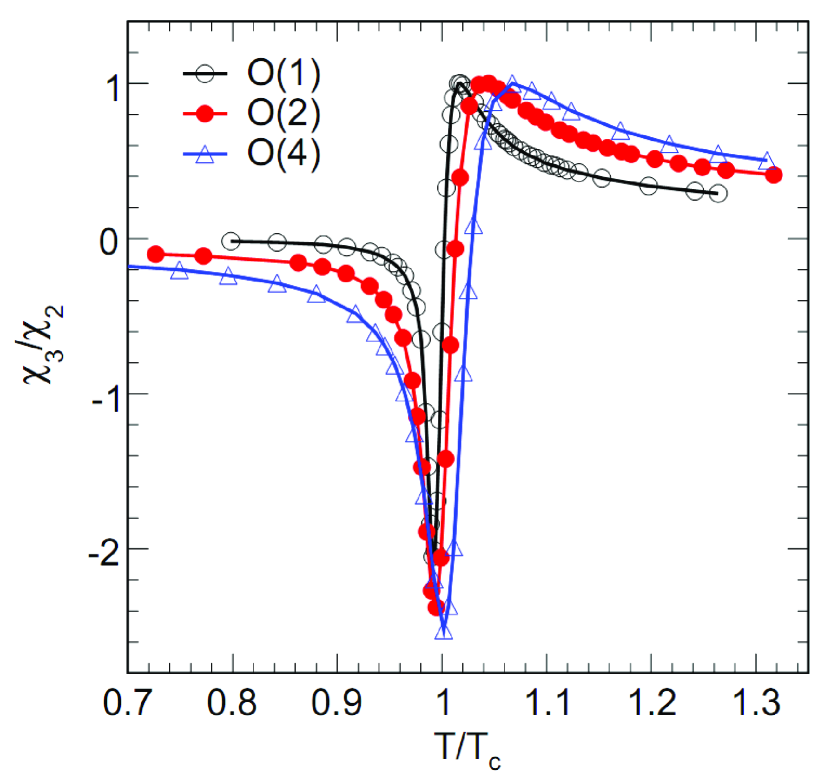
We have noticed that the inflection point for a finite system is not exactly the critical point, i.e., where the sign of the second derivative changes is above the critical temperature , as figure 3(c) shows. For a finite system, inflection point is just an approximate value of the critical point. As the system size increases, the inflection point will approach the critical point, which was previously discussed in a percolation model [26].
3.3 Inflection point of the baryon number density of QCD matter
Though the transition from hadron phase to quark gluon plasma phase is a crossover type at vanishing baryon chemical potential [1], the critical behavior can also be observed during a crossver [21, 27, 28] due to the remnants of O(4) criticality on the crossover line. The high cumulants , and from an universality analysis and the PQM model calculations, indeed show oscillating behavior close to the pseudo-critical temperature (the temperature of crossover). This oscillating behavior of high cumulants of the baryon number should be related to the inflection point of the baryon number density, as equation (2) suggests. Inflection points indeed exist in the curves of the quark number density for and , as shown in an earlier paper [29]. The quark number density is just the baryon number density except a factor of .
To summarize this section, all the existing second order phase transitions show the characteristic of an inflection point. An inflection point of EoS is a characteristic of the critical point and is associated with the oscillating behaviors of higher cumulants. Physically, the second order phase transition passing through the CP is always accompanied by the numerical change of the order parameter. Assuming that the temperature is a controlling parameter. The order parameter, denoted by , gets a particular value (e.g. ) at the low temperature limit in one phase and another value (e.g. ) at the high temperature limit in another phase. During a second order phase transition, the value of the order parameter is transformed continuously. When the temperature increases from a low value, the order parameter will deviate from and the curve of at this stage would be concave. When the temperature is high enough, the order parameter will turn to be convex to approach its upper limit . The point where the concavity changes is an inflection point. Therefore, a second order phase transition certainly means an inflection point on the equation of state. In this sense, inflection point of EoS is a characteristic of the critical point. This statement is general and independent on any models.
In section 3.3, an inflection point also appears in the EoS of crossover. In fact, the inflection points of some variables have been used to determine the transition temperature of crossover at in lattice calculations [30, 31, 32]. The fact that inflection point appears in the EoS of crossover does not contradict the statement in the previous paragraph, however. As we showed in section 3.1, when the crossover happens near the CP, e.g. , an inflection point survives, the first derivative shows a peak and the second derivative changes the sign. As the temperature increases, the peak in the first derivative shrinks and the sign change in the second derivative is not obvious. As the temperature increases further, the peak and sign change behavior disappear at last. The inflection point in the EoS of crossover may be due to the close location with the CP. This trend is common for different systems. For example, in the three-dimensional three-state Potts model in an external field [33], the peak heights of the susceptibilities decrease as the external field increases away from the critical point to crossover region (see figure 1(a) in [33]). Similarly, all the baryon number susceptibilities (or the quark number susceptibilities) calculated in NJL model [17, 34], another kind of chiral model [35] and the lattice QCD [36, 37, 38] show the same trend, too. Since the peak heights of the susceptibilities () reflect the slope at the inflection point in the EoS, a finite peak in a crossover corresponds to a finite value of the slope at the inflection point in the EoS, while a divergent peak at the CP corresponds to a infinite value of the slope at the inflection point in the EoS. As the critical point is approached from the crossover side, the susceptibility gradually develops to be divergent and the slope at the inflection point in the EoS gradually increases to infinity. The fact that the peak structure of the so called susceptibility survives along the crossover line induces the phrase “critical region”, as mentioned in [14, 29].
The analysis about the inflection point and oscillating high cumulants is resonable and can be applied. Let us use this analysis to explain the existing cumulants. It was suggested that the divergent behavior of th order susceptibility for is similar to that of the th order susceptibility for according to the O(4) universal scaling analysis [21]. In that universal analysis, for , shows a peak, changes the sign one time and changes the sign two times (see figure 1 and 2 in [21]). The PQM model at [21] reproduces the trend very well. In lattice QCD calculations at , has an inflection point [36, 37, 38], shows a moderate peak and changes the sign one time [23]. The law about the number of times of sign change works well.
4 Conclusions
In the paper, we firstly show how the critical behavior of high cumulant of susceptibility, in particular, the sign change, relates to the appearance of inflection point of EoS. The number of times of sign change of high cumulants near the critical temperature is determined by the order of cumulants, i.e., the order of derivative of EoS at the inflection point. The second, forth, sixth and eighth cumulants of conserved charges at zero chemical potential from current lattice QCD, an O(4) universal scaling analysis as well as PQM model calculation, show consistent sign changes as we predicted from the order of the cumulants. Secondly, we demonstrated that the characters of inflection point of EoS in three systems, i.e., Van der Waals fluid, magnetization of spin models and QCD matter, are as visible as the sign change of high cumulants of susceptibilities. Therefore, we propose that the EoS, or the mean of baryon number density, should be measured and studied together with its high cumulants in exploring QCD critical point in heavy ion collisions.
References
References
- [1] Aoki Y et al2006 Nature (London) 443 675
- [2] Asakawa M and Yazaki K 1989 Nucl. Phys. A 504 668
- [3] Barducci A et al1990 Phys. Rev. D 41 1610
- [4] Berges J and Rajagopal K 1999 Nucl. Phys. B 538 215
- [5] Halasz M A et al1998 Phys. Rev. D 58 096007
- [6] Scavenius O et al2001 Phys. Rev. C 64 045202
- [7] For a review, see Blume C 2012 Cent. Eur. J. Phys. 10(6) 1245 (talk given in CPOD 2011 Wuhan)
- [8] Cleymans J et al2006 Phys. Rev. C 73 034905
- [9] Stephanov M, Rajagopal K and Shuryak E 1999 Phys. Rev. D 60 114028
- [10] Mackowiak-Pawlowska M 2012 Cent. Eur. J. Phys. 10(6) 1285 (talk given in CPOD 2011 Wuhan) and references therein
- [11] Tian J (for the STAR Collaboration) 2012 Cent. Eur. J. Phys. 10(6) 1365 (talk given in CPOD 2011 Wuhan)
- [12] Jeon S and Koch V 2004 Quark Gluon Plasma 3, eds. by Hwa R C and Wang X N, (Singapore: World Scientific Publishing) p 430.
- [13] Berdnikov B and Rajagopal K 2000 Phys. Rev. D 61 105017
- [14] Stephanov M A 2009 Phys. Rev. Lett. 102 032301
- [15] Ejiri S, Karsch F and Redlich K 2006 Phys. Lett. B 633 275
- [16] Cheng M et al2009 Phys. Rev. D 79 074505
- [17] Asakawa M, Ejiri S and Kitazawa M 2009 Phys. Rev. Lett. 103 262301
- [18] Koch V EMMI rapid reaction tast force meeting 2013
- [19] Stephanov M A 2011 Phys. Rev. Lett. 107 052301
- [20] Gavai R V and Gupta S 2011 Phys. Lett. B 696 459
- [21] Friman B et al2011 Eur. Phys. J. C 71 1694
- [22] Skokov V et alarXiv: hep-ph/1108.1300
- [23] Schmidt C 2010 Prog. Theor. Phys. Suppl. 186 563
- [24] Luo X (for the STAR Collaboration) 2011 J. Phys.:Conf. Ser. 316 012003
- [25] Pan X et alarXiv:1306.0335
- [26] Ke H W, Xu M M and Liu L S 2009 Chinese Physics C 33(10) 854
- [27] Redlich K 2012 Cent. Eur. J. Phys. 10(6) 1254 (talk given in CPOD 2011 Wuhan)
- [28] Skokov V 2012 Cent. Eur. J. Phys. 10(6) 1375 (talk given in CPOD 2011 Wuhan)
- [29] Schaefer B-J and Wambach J 2007 Phys. Rev. D 75 085015
- [30] Aoki Y et al2006 Phys. Lett. B 643 46
- [31] Aoki Y et al2009 J. High Energy Phys. JHEP06(2009)088
- [32] Borsanyi S et al2010 J. High Energy Phys. JHEP09(2010)073
- [33] Karsch F and Stickan S 2000 Phys. Lett. B 488 319
- [34] Sasaki C, Friman B and Redlich K 2007 Phys. Rev. D 75 054026
- [35] Hatta Y and Ikeda T 2003 Phys. Rev. D 67 014028
- [36] Allton C R et al2005 Phys. Rev. D 71 054508
- [37] Stephanov M 2006 PoS(LAT2006)024
- [38] Schmidt C 2006 PoS(LAT2006)021