The co-planarity of satellite galaxies delivered by randomly aligned cold mode accretion streams
Abstract
Recent observations have shown that the majority of the Andromeda galaxy’s satellites are aligned in a thin plane. On the theoretical side it has been proposed that galaxies acquire their gas via cold streams. In addition, numerical simulations show that the same streams also deliver gas clumps which could potentially develop into satellite galaxies. Assuming that cold streams are a major source of satellite systems around galaxies we calculate the probabilities in two different models to find a certain fraction of satellites within a thin plane around the central galaxy of the host halo with and without having the same sense of rotation. Using simple geometrical considerations and adopting a random orientation of the streams we demonstrate that the vast thin disk of satellites detected around Andromeda can naturally be explained within this framework. In fact, without any satellite scattering, two streams would lead to too many satellites in the thin plane, compared with the observations. Three streams reproduce the observations very well. Natural implications from our model are that all massive galaxies should have a thin plane of satellites and that the satellites should naturally distribute themselves not only into a single plane but into several inclined ones. We estimate the effect of additional satellites accreted from random directions and find it to be of minor relevance for a mild inflow of satellites from random directions.
keywords:
cosmology: theory – galaxies: evolution – galaxies: formation – galaxies: high redshift – methods: numerical – Local Group1 Introduction
Our understanding of how galaxies form has changed substantially in recent years. A decade ago it was thought (Blumenthal et al., 1984; Rees & Ostriker, 1977; Silk, 1977; White & Rees, 1978) that galaxies collect their baryons through diffuse gas, spherically symmetrically falling into dark matter haloes and being shock-heated as it hits the gas residing in the haloes, the so-called hot mode accretion. Whether the gas eventually settles into the equatorial plane, forming a galactic disk was depending on the mass of the dark halo. Below a critical mass, the gas could cool efficiently, forming a disk galaxy, while for larger masses the cooling time would be longer than the Hubble time, leading to structures that resemble galaxy clusters with a large baryon fraction in the hot, diffuse intergalactic gas component. Recent theoretical work and simulations (Fardal et al., 2001; Birnboim & Dekel, 2003; Kereš et al., 2005, 2009; Dekel & Birnboim, 2006; Ocvirk, Pichon & Teyssier, 2008; Dekel et al., 2009a, 2013) however seem to indicate that at high redshift , galaxies acquire their baryons primarily via cold streams of relatively dense and pristine gas with temperatures around K that penetrate through the diffuse shock-heated medium, the so-called cold mode accretion. These streams peak in activity around redshift 3. Having reached the inner parts of the host halo they will eventually form a dense, unstable, turbulent disc where rapid star formation is triggered (Agertz, Teyssier & Moore, 2009, 2011; Dekel, Sari & Ceverino, 2009b; Ceverino, Dekel & Bournaud, 2010; Krumholz & Burkert, 2010; Ceverino et al., 2012; Cacciato, Dekel & Genel, 2012; Genel, Dekel & Cacciato, 2012; Genzel et al., 2011; Dekel et al., 2013; Ceverino et al., 2015).
-body simulations suggest that about half the mass in dark-matter haloes is built-up smoothly, suggesting that the baryons are also accreted semi-continuously as the galaxies grow (Genel et al., 2010). Hydrodynamical cosmological simulations also show rather smooth gas accretion, including mini-minor mergers with mass ratios smaller than 1:10, that brings in about two thirds of the mass (Dekel et al., 2009a). The massive, clumpy and star-forming discs observed at (Genzel et al., 2008; Genel et al., 2008; Förster Schreiber et al., 2009, 2011) may have been formed primarily via the smooth and steady accretion provided by the cold streams, with a smaller contribution by major merger events (Agertz, Teyssier & Moore, 2009; Ceverino, Dekel & Bournaud, 2010).
Attempts to directly observe cold accretion streams are ongoing: Goerdt et al. (2010) used cosmological hydrodynamical amr simulations to predict the characteristics of Ly emission from the cold gas streams. The Ly luminosity in their simulations is powered by the release of gravitational energy as the gas is flowing inwards with a rather constant velocity. The simulated Ly-blobs (LABs) are similar in many ways to the observed LABs. Some of the observed LABs may thus be regarded as direct detections of the cold streams that drove galaxy evolution at high . Observations (Rauch et al., 2011; Erb, Bogosavljević & Steidel, 2011) and new amr simulations incorporating radiative transfer support this model (Rosdahl & Blaizot, 2012). Goerdt et al. (2012) made theoretical predictions about the likelihood of observing these streams in absorption which have very recently really been observed (Bouché et al., 2013). Goerdt et al. (2015) looked at the amount of inflow – the mass accretion rate – both as a function of radius, mass and redshift for the three constituents gas, stars and dark matter.
Danovich et al. (2012) find that at the few virial radii vicinity of the galaxy, the streams tend to be confined to a stream plane, and embedded in a flat pancake that carries of the influx. There are on average three significant streams, of which one typically carries more than half the mass inflow. Given the fact that galaxies grow by cold stream accretion, the question arises whether some observational signatures of this phase are still detectable in present-day galaxies. Goerdt & Ceverino (2015) analysed the velocity of the accretion along the streams.
Libeskind et al. (2005, 2011) looked at the preferred direction and at the distribution of satellite galaxies in the Local Group. They used -body dark matter only simulations. They find that the satellites within the Local Group should preferentially lie in a plane.
Ibata et al. (2013) showed in a seminal observational paper the existence of a planar subgroup of satellites in the Andromeda galaxy (M 31), comprising about half of the population as observed and described by Conn et al. (2012). The structure is at least 200 kilo-parsec in radius, but also extremely thin, with a perpendicular scatter of less than 12.6 kilo-parsec. Radial velocity measurements reveal that the satellites in this structure have the same sense of rotation about their host. This shows conclusively that substantial numbers of dwarf satellite galaxies share the same dynamical orbital properties and direction of angular momentum. Intriguingly, the plane they identify is approximately aligned with the pole of the Milky Way’s disk and with the vector between the Milky Way and Andromeda. Ibata et al. (2014a) stressed the importance of reproducing all of the observed properties of the plane, especially the fact that most of the satellites are co-rotating, when comparing thy numerical simulations. Ibata et al. (2014b) found observational evidences that thin planes of satellites might be a common phenomenon amongst galaxies in the universe.
Following up on this Bowden, Ewans & Belokurov (2013) argued that a thin satellite disc can persist over cosmological times if and only if it lies in the planes perpendicular to the long or short axis of a triaxial halo, or in the equatorial or polar planes of a spheroidal halo. In any other orientation, the disc thickness would double on Gyr timescales and so must have been born with what they call ’an implausibly small vertical scale-height’.
Several scenarios have been proposed in order to explain the origin of planar satellite systems. Dwarf galaxies might be accreted in groups (D’Onghia & Lake, 2008; Li & Helmi, 2008). Alternatively, the disk of satellites might be the tidal debris of a major merger with a gas-rich galaxy with the tidal arms condensing into tidal dwarf galaxies (Wetzstein, Naab, & Burkert, 2007; Bournaud, Duc & Emsellem, 2008; Pawlowski, Kroupa & de Boer, 2011; Hammer et al., 2013). This scenario is however in conflict with the observational evidence of substantial amounts of dark matter, dominating the kinematics of dwarf spheroidals (see however Kroupa, 1997; Pawlowski, Pflamm-Altenburg & Kroupa, 2012b). Interestingly, coherently rotating, quasi-planar distributions of satellites have also been found in cold-dark-matter simulations (Lovell et al., 2011; Keller, Mackey & Da Costa, 2012; Bahl & Baumgardt, 2014; Gillet et al., 2015) (see Pawlowski et al., 2012a, 2014, for an alternative view). Macciò, Moore & Stadel (2006) found evidence in numerical simulation for the creation of polar ring galaxies by cold stream accretion. Temple & Tamm (2015) showed that galaxy pairs align with galactic filaments and Temple et al. (2015) found alignement between the angular distribution of satellite galaxies around the isolated primary galaxies in filaments and the direction of the filaments where those primaries are located in SDSS observations. This indicates that satellite great planes might be a natural result of how galaxies accrete material and substructure from the cosmic web. It is this idea, that is the motivation for our paper. We demonstrate that thin planes of substructure, consistent with the observations of Ibata et al. (2013) are in fact expected if galaxies are fed by cold, satellite loaded streams. In section 2 we present two simple geometrical models to analyse the probability of generating a satellite disk with given thickness and satellite fraction, for various numbers of randomly oriented cold streams. Section 3 presents the conclusions.
2 Calculations
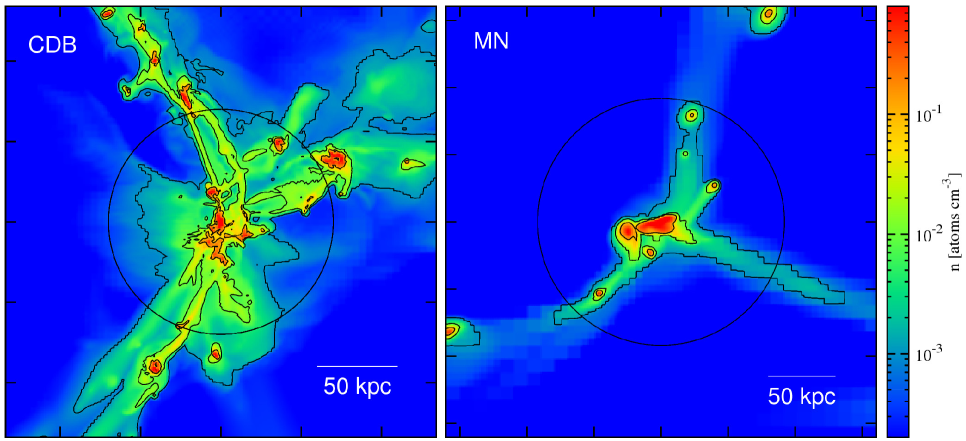
It has been proposed that gas enters a host halo via smooth accretion streams (Dekel et al., 2009a). For our purposes more interestingly, dark matter haloes filled with gas that could potentially form stars and end up as satellite galaxies are seen in simulations to lie on top of those smooth accretion streams (e.g. figure 2 of Dekel et al. (2009a) shows gas clumps on top of gas streams, which are identified by Goerdt et al. (in preparation) to be gas clumps surrounded by dark matter haloes). In figure 1 we show maps from hydrodynamical amr simulations of high redshift , high mass M galaxies from two suites of cosmological simulations: the Horizon-MareNostrum simulation (hereafter MN, Ocvirk, Pichon & Teyssier, 2008) and the ART suite of simulations (Adaptive Refinement Tree, Ceverino & Klypin, 2009; Ceverino, Dekel & Bournaud, 2010; Ceverino et al., 2012; Dekel et al., 2013; Ceverino et al., 2014). The circles indicate the virial radii. Clearly visible are three cold streams, funnelling gas into the centre of the galaxy. One can also see several gas clumps, embedded in the streams. Those are smaller galaxies which are entering the host halo via the streams. These smaller structures could merge with the central galaxy or, as we will assume below, end up as satellites, orbiting their host. Note that there are no clumps outside a stream, indicating that the build-up of a satellite system is stream driven (see e.g: Tormen, 1997; Onuora & Thomas, 2000; Libeskind et al., 2005; Dekel et al., 2009a). Note further that the clumps are carried in the innermost parts of the streams which are substantially narrower than 13 kpc (i.e. the width of the plane of satellites of M31).
Suppose now that galaxies and their satellite systems form in the focal point of a number of randomly oriented cold streams. What is then the probability that a certain fraction of satellites lies within a thin plane around the central galaxy of the host halo? Ibata et al. (2013) found through observations that 15 out of Andromeda galaxy’s 27 satellites are within a plane with 200 kpc radius and 12.6 kpc vertical rms scatter. As the radius (total extent) and vertical thickness (rms scatter) are defined in a different way these values cannot be used directly in order to determine the opening angle of the disk. We therefore analysed again the 3-D coordinates of the 15 satellite galaxies selected by Ibata et al. (2013, see figure 10 of Conn et al. 2012) and computed the rms radius instead of the maximum radius to be able to compare it to the rms thickness (12.6 kpc) of the disk. The rms radius turns out to be 187 kpc. From that we computed the opening angle atan which is 3.8 degree. Ibata et al. (2013) excluded two out of those 15 subhaloes since those are counter-rotating. Since our first analysis using radial orbits does not take the orientation of the rotation into account we will compare this analysis to the ratio . Our second analysis, deploying planar orbits does take the orientation of the rotation into account therefore we will compare that analysis to the ratio .
In order to work out the likelihood of having of order half of the satellites in a plane as thin as 3.8 degree we have performed two sets of Monte Carlo experiments, drawing randomly orientated streams and calculating the probabilities of having a given ratio of subhaloes within a plane of certain thickness. Underlying our calculations are the following assumptions: (1) A vast majority of incoming subhaloes enter the host halo through cold streams, as seen in the arrangement of the gas clumps in figure 2 of Dekel et al. (2009a). The effect of having additional subhaloes entering from random directions111e.g. accretion of satellites at cosmic times at which there is no cold stream activity, i.e. outside . will be discussed in depth in section 2.3. (2) Some of the gas clumps carried by the cold streams end up as satellite galaxies orbiting the central galaxy today. (3) Any host halo has between two and seven streams. (4) The streams themselves are randomly distributed over the whole sky as seen from the centre of the host halo. We are aware of studies which present evidence that already the streams seem to lie in a single plane (Dekel et al., 2009a; Danovich et al., 2012). It is therefore a conservative assumption to distribute the streams randomly with equal solid angles on the sky carrying equal probabilities of having a stream. (5) The orientation of the cold streams does not change with respect to the host halo during the period of accreting satellites. Both of our models are built upon those five assumptions.
2.1 Radial orbits model
For this model, which deploys radial orbits, an additional four assumptions are needed: (6) Each stream is loaded with an equal amount of subhaloes. (7) The streams will hit the centre of the host halo directly head on, i.e. they have no significant impact parameter with respect to the central galaxy. (8) The subhaloes will initially stay on the same orbits as defined by their stream, i.e. radial orbits parallel to the stream the subhalo is coming from. (9) These orbits will eventually be circularised within a plane also parallel to this stream.
Using these assumptions we have performed a series of Monte Carlo calculations. We start a Monte Carlo calculation by fixing the total number of streams, with in the range of two to seven. We then draw a large number of sets of random stream orientations. As mentioned earlier, randomly oriented means, that an equal solid angle of the sky as seen from the centre of the host halo has an equal probability of carrying a stream. Also all streams must reach the centre of the host halo directly and the position of one of the streams does not have any influence on the position of the other streams. For each set of streams we conduct for each number () of streams out of the total streams a grid search for the ’optimum’ plane. ’Optimum’ means that the largest of angles between streams and the plane is minimal. For this we rasterise the whole unit sphere centred on the host halo with points equally distributed and never further apart than 0.2 degree. Equally distributed means in this context that all points on the sphere are angularly equidistant. The vectors connecting these points with the centre of the host halo are the normal vectors to our plane candidates. A single subset of streams out of the total of streams gives a single optimal plane, but there are different optimal planes for different values of within the same set of total streams. In practice, the program runs through the following steps: Given one of the planes from our grid search mentioned above, we calculate the angles between each of the streams and the plane. The resulting angles are sorted according to their value. The highest value denotes the opening angle within which all streams lie in one plane. The second highest value indicates the opening angle within which a number streams belong to one plane. We collect the values of the minimal angles for each set of streams and for each value of . We then proceed to the next test plane of our grid search.
2.1.1 Results
In figure 2 we show the cumulative distribution functions of having out of streams close to a plane with a maximum angular deviation of (opening angle). These are the cumulative distribution functions of the minimum angle for a set of streams out of the total of streams. Each panel corresponds to a different total number and each of the coloured dashed curves shows a different value of . The vertical black line at 3.8 degree indicates the observation of Ibata et al. (2013). The two triangles on that line indicate the intersections with those predicted curves that lie most closely to the fraction of Andromeda’s satellites that have been found to belong to the thin plane. These triangles therefore show upper and a lower values for our predicted probabilities. In the first five columns of table 1 we explicitly state the positions of the triangles.
| 2 | 2 | 2 | 1.0 | 1.0 | 1.0 |
|---|---|---|---|---|---|
| 3 | 2 | 2 | 1.0 | 1.0 | 0.588 |
| 4 | 3 | 2 | 1.0 | 0.622 | 0.243 |
| 5 | 3 | 2 | 1.0 | 0.920 | 0.115 |
| 6 | 4 | 3 | 0.996 | 0.317 | 0.078 |
| 7 | 4 | 3 | 1.0 | 0.558 | 0.053 |
Since we assumed that all the streams pass trough the galaxy centre, two streams will always lie on a perfect plane. The ’2 / ’ lines in figure 2 therefore are always at a probability of . For a three stream scenario we would expect at least 67 % of the satellites to lie within one plane. Since two, three or four stream configurations are most commonly seen in cosmological simulations (Danovich et al., 2012), we can already say that there is nothing surprising about the configuration seen around the Andromeda galaxy. On the contrary, the fact that so little satellites lie on a thin plane rules out a two stream or a three stream scenario for the Andromeda galaxy, unless secular evolution or other processes move some of the satellites out of that plane.
Since all heavy galaxies are fulled by cold streams it is a natural consequence of this model that not only the Andromeda galaxy, but all galaxies having at least Andromeda’s mass should have a thin plane of satellites as Andromeda does. Recent observational work (Ibata et al., 2014b, 2015) points in this direction (See Cautun et al., 2015, however for an alternative view). The beauty of this model is that it can also explain the two counter-rotating satellite galaxies which belong to the plane of satellites. Other models have severe difficulties with explaining those two.
2.2 Planar orbits model
Since Ibata et al. (2014a) pointed out the importance of reproducing all of the observed properties of the plane we decided to refine our model further, allowing for planar, co-rotating orbits. For this second model we use the common five assumptions from the beginning of section 2, but we exchange the old assumptions 6 to 9 and replace them by three more realistic ones: (6) The streams are loaded with a varying amount of subhaloes. Each stream has the same probability of carrying many or only few satellites. (7) The streams will not hit the centre of the host halo head on, but with a significant impact parameter in a random direction perpendicular to the stream itself. (8) The subhaloes will stay on planar orbits, in a way that the cross product of the vector of the stream and the vector of the impact parameter defines the plane of the orbit and the sense of the rotation within this plane.
Using these assumptions we have performed another large number of Monte Carlo calculations. This second set of Monte Carlo simulations is very similar to the first set mentioned in section 2.1: First we fix the total number of streams, with being in the range of two to seven. We then draw a large number of sets of random stream orientations. In this model we also draw for each stream a random impact parameter direction. The impact parameter direction is a unit vector which has to be perpendicular to the stream orientation vector which is also a unit vector. The amplitude of the impact parameter vector is always unity (the actual physical size of the impact parameter is irrelevant to our problem, due to the expected circularisation of the orbits) and its remaining direction angle (the overall vector has to be perpendicular to the stream orientation vector) is uniformly distributed between 0 and 2 . Also for each stream we draw a satellite loading factor in a way that each stream has the same satellite loading factor distribution and the sum of the satellite loading factors of all streams always adds up to one. This is done by drawing a random number uniformly distributed between 0 and 1 for each of the streams. These numbers are then renormalised so that their sum equals to one. This approach might lead to streams which carry only a single or even no clumps. There is nothing peculiar about such a stream carrying only smooth gas but no clumps, it is still a perfectly valid stream. Simulations show indeed that such streams exists. An example for such a stream is the one plotted in the right hand panel of figure 1 (the stream in the lower right hand corner). We now conduct a grid search for the ’optimum’ plane the same way we did in our first model described in section 2.1. Now we collect the values of the minimal angles for each possible combination of satellite loading factors.
2.2.1 Results
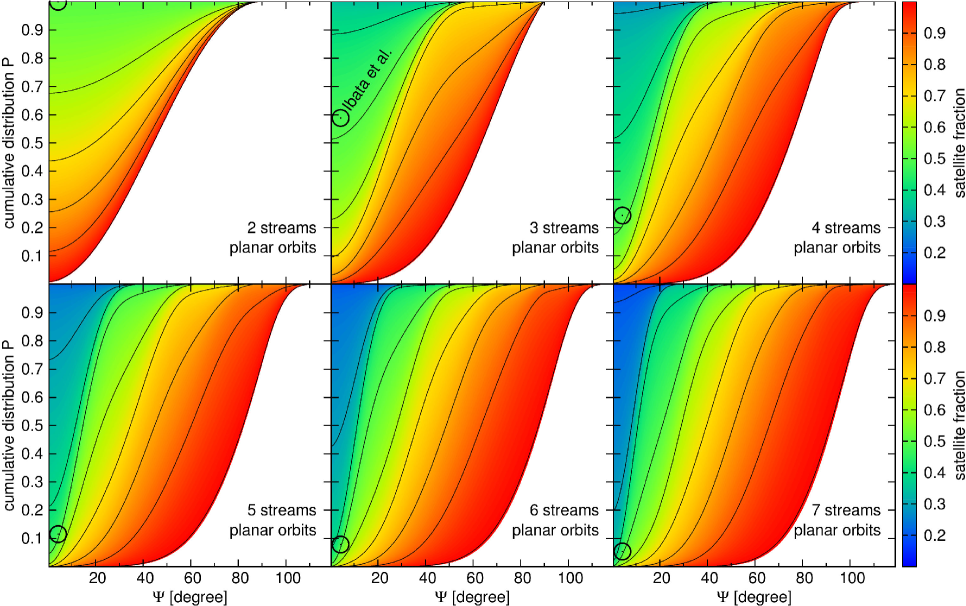
In figure 3 we plot the cumulative distribution functions of having the indicated fraction of satellites in a plane with an opening angle and the same sense of rotation. Each panel corresponds to a different total number of streams. The black circles indicate the observation of Andromeda which has a fraction of its satellites within a thin plane with an opening angle of 3.8 degree and the same sense of rotation (Ibata et al., 2013). In the last column of table 1 we explicitly state the positions of the circles.
It is a feature of our model that all satellites entering from the same stream always stay in the same plane. It is also obvious that the stream with the highest satellite loading factor carries always at least a fraction of the total satellites. Therefore a satellite fraction of has always a probability of regardless of the opening angle , as seen in figure 3. Generalising this one can say that the majority of the signal is usually coming from a large value of the varying satellite loading factor and only a minor contribution is coming from alignments of the planes. Since in the two and in the three stream scenario, which are the most common ones in cosmological simulations (Danovich et al., 2012) the observational data points lie well above 50% we can firmly state that there is nothing surprising about the configuration seen around the Andromeda galaxy. In this model even a four stream scenario can only just be ruled out on a one sigma level.
Pawlowski et al. (2014) present a very similar model of planar orbits, but with fixed satellite loading fractions. They report relatively small probabilities to reproduce the observed situation. The differences to our results arise from their use of fixed instead of varying satellite loading fractions and from their negligence of the two stream scenario. Both might introduce inaccuracies since varying satellite loading fractions are clearly more physical then fixed satellite loading fractions (compare the right panel of figure 1) and the two stream scenario is one of the most likely scenarios seen in numerical simulations (Danovich et al., 2012).
As in the radial orbits model a natural consequence of this model is that all galaxies having at least Andromeda’s mass should have such a thin plane of satellites. Recent observations might point in this direction (Ibata et al., 2014b). On top of that, this model has a second natural consequence: It predicts that high mass haloes should have several planes of satellites, namely one plane for each stream. Indeed recent observational work (Shaya & Tully, 2013) reports the detection of four inclined planes in the Local Group. To make definitive statements about multiple planes however more extended analyses are needed: One should test the statistical significance of the planes, one should consider velocity data or the biases introduced by the satellite survey volumes or having associated satellites to a first plane when looking for a second one and finally one should keep in mind that one of the planes identified is actually offset from Andromeda’s barycentre. So much more theoretical as well as observational work is still needed in the field of multiple planes.
2.3 Non-stream satellites
In this section we discuss the impact of satellites entering from random directions not connected to the cold streams. Those satellites could either be accreted at cosmic times at which at which there is no cold stream activity, i.e. outside or of sattelites not connected to any of the streams. Satellites entering the host halo from random directions outside of any of the streams will hardly lie in the same plane as the ones accreted as part of the streams. Therefore extending our models to allow for satellites to enter from random directions will significantly lower the probabilities of a certain fraction of all satellites lying in a thin plane. Assuming that no satellite accreted from a random direction will ever end up in the plane of the other satellites, the fraction of all the satellites however accreted lying within a thin plane obviously decreases as , where is the fraction of the satellites accreted only through cold streams lying within a thin plane and is the fraction of spherically or randomly accreted satellites. To calculate the probability of a certain fraction of all satellites lying in a thin plane we first fix to the observed values of 15 out of 27 or 13 out of 27, depending on the underlying model and calculate the required fraction of the satellites accreted through the cold streams only lying within a thin plane according to the above formula. The probability of a certain fraction of all satellites lying in a thin plane as a function of can now be taken from our two models. They are presented in figures 2 and 3 with indicated by different line types or by colour, labelled as ’satellite fraction’.
In figure 4 we show how the different probabilities of having the observed thin plane of satellites in host galaxies with a varying number of cold streams in our two models decrease with increasing . In the left panel the radial orbits model is shown. Since we have only a few discrete data points for the satellite fraction in this model it can only show upper and lower bounds. For configurations having two to four streams the upper bound of the observed degree of co-planarity has a cumulative probability of more than 50% if one allows for up to 44.4% spherically accreted satellites. Since this panel is difficult to read and has only limited significance we also show in the middle panel an “extended radial orbits model” whose only difference to the pure radial orbits model is that we allow for a varying satellite loading factor. This gives narrow lines in this plot. One sees that we still get the observed degree of co-planarity with a cumulative probability of more than 50% if we allow for up to 35.4% spherically accreted satellites even in the seven stream configuration. Scenarios with less streams can have higher fraction of spherically accreted satellites. In the right panel we show the planar orbits model. One sees that one still gets a thin plane of co-rotating satellites as observed in Andromeda in 50% of all the cases if we allow for up to 28.6% spherically accreted satellites in the two stream configuration or up to 4.7% spherically accreted satellites in the three stream configuration. So a mild inflow of satellites from random direction does not alter the conclusions drawn from either of our models.
3 Conclusions
Inspired by recent observations we investigated the probabilities of a certain fraction of subhaloes lying within a thin plane around the central galaxy of the host halo within the framework of the cold stream scenario. We performed two sets of Monte Carlo simulations that draw randomly orientated streams assuming that the satellites stay on circularised orbits whose planes are still parallel to the stream. We estimated the effect of additional satellites accreted from random directions, leading to the following results:
-
•
The configuration seen around the Andromeda galaxy is a natural result of cold stream accretion. A plane as thin as observed can be generated in both of our models with probabilities as high as 50% to 100% for two or three streams, which are the most common configurations seen in cosmological simulations. The radial orbits model however neglects the orientations of the rotation and only takes into account the positions of the satellites. Only the planar orbits model takes both the positions as well as the orientations of the rotation into account.
-
•
Without scattering of dwarf satellites, the Andromeda galaxy must have been fed by more than two streams otherwise we would expect more than only 48% of its satellite galaxies to lie within a very thin plane with the same sens of rotation. The most likely number of streams is three. If Andromeda’s satellite system was produced by two streams in fact a large number of objects must have been scattered out of the thin plane and it would be interesting to investigate whether and how this scattering process affects the internal structure of these satellites.
-
•
Since both of our models which are both based on the cold stream feeding mechanism guarantee an initial disc that is born with a remarkable small vertical scale-height, scattering processes as discussed by Bowden, Ewans & Belokurov (2013) will most likely play only a minor role.
-
•
A natural implication from both our models is that all galaxies having at least the mass of Andromeda should have such a thin plane of satellites. Interestingly recent observations point in that direction (Ibata et al., 2014b). The high probabilities found for the planar orbits model come about because of the high probability to assign of the satellites to a single stream which itself is a direct consequence of the fact that the most likely number of cold streams flowing into a single host halo is relatively low, namely between two and four (Danovich et al., 2012). Also one should keep in mind that the radial orbits model neglects the orientations of the rotation and only takes into account the positions of the satellites. Only the planar orbits model takes both the positions as well as the orientations of the rotation into account.
-
•
An additional implication from our second, planar orbits model is that the satellites should naturally distribute themselves into several inclined planes. Indeed Shaya & Tully (2013) reported that there are four inclined planes altogether in the Local Group222Concerning multiple planes one should remember the words of caution from the end of section 2.2.1..
-
•
Allowing satellites to accrete from random directions lowers the probabilities of having the required fraction of satellites in a thin disk. A mild inflow of satellites from random directions however does not change our conclusions.
We are aware that the current analyses has its limitations. So far we do not incorporate the evolution of the satellite’s orbits, the alignment of the Milky Way and its plane of satellites with respect to Andromeda and its respective plane of satellites nor the possibility of having multiple planes of satellites as observed by Shaya & Tully (2013).
We conclude that the special spatial alignment of Andromeda’s satellite galaxies can naturally be explained by cold stream accretion and simple geometry.
Acknowledgements
Tobias Goerdt is a Lise Meitner fellow. We thank Rodrigo Ibata, Ben Moore, Doug Potter and Romain Teyssier for their kindness in sharing simulation and observational data with us and Oliver Czoske for the fruitful discussions. Tobias Goerdt would like to thank the University Observatory Munich for their hospitality, where parts of this work were carried out. Parts of the computational calculations were done at the Leibniz-Rechenzentrum under project number pr86ci and at the Vienna Scientific Cluster under project number 70522. This work was supported by FWF project number M 1590-N27 and by MINECO project number AYA 2012-32295.
References
- Agertz, Teyssier & Moore (2009) Agertz O, Teyssier R, Moore B, 2009, MNRAS, 397L, 64
- Agertz, Teyssier & Moore (2011) Agertz O, Teyssier R, Moore B, 2011, MNRAS, 410, 1391
- Bahl & Baumgardt (2014) Bahl H, Baumgardt H, 2014, MNRAS, 438, 2916
- Birnboim & Dekel (2003) Birnboim Y, Dekel A, 2003, MNRAS, 345, 349
- Blumenthal et al. (1984) Blumenthal G. R, Faber S. M, Primack J. R, Rees M. J, 1984, Nature, 311, 517
- Bouché et al. (2013) Bouché N, Murphy M. T, Kacprzak G. G, Péroux C, Contini T, Martin C. L, Dessauges-Zavadsky M, 2013, Science, 341, 50
- Bournaud, Duc & Emsellem (2008) Bournaud F, Duc P.-A, Emsellem E, 2008, MNRAS, 389, L8
- Bowden, Ewans & Belokurov (2013) Bowden A, Evans N. W, Belokurov V, 2013, MNRAS, 435, 928
- Cacciato, Dekel & Genel (2012) Cacciato M, Dekel A, Genel S, 2012, MNRAS, 421, 818
- Cautun et al. (2015) Cautun M, Wang W, Frenk C. S, Sawala T, 2015, MNRAS, 449,2576
- Ceverino, Dekel & Bournaud (2010) Ceverino D, Dekel A, Bournaud F, 2010, MNRAS, 404, 2151
- Ceverino et al. (2012) Ceverino D, Dekel A, Mandelker N, Bournaud F, Burkert A, Genzel R, Primack J, 2012, MNRAS, 420, 3490
- Ceverino & Klypin (2009) Ceverino D, Klypin A. A, 2009, ApJ, 695, 292
- Ceverino et al. (2014) Ceverino D, Klypin A, Klimek E. S, Trujillo-Gomez S, Churchill C. W, Primack J, Dekel A, 2014, MNRAS, 442, 1545
- Ceverino et al. (2015) Ceverino D, Dekel A, Tweed D, Primack J, 2015, MNRAS, 447, 3291
- Conn et al. (2012) Conn A. R. et al, 2012, ApJ, 758, 11
- Danovich et al. (2012) Danovich M, Dekel A, Hahn O, Teyssier R, 2012, MNRAS, 422, 1732
- Dekel & Birnboim (2006) Dekel A, Birnboin Y, 2006, MNRAS, 368, 2
- Dekel et al. (2009a) Dekel A. et al, 2009a, Nature, 457, 451
- Dekel, Sari & Ceverino (2009b) Dekel A, Sari R, Ceverino D, 2009b, ApJ, 703, 785
- Dekel et al. (2013) Dekel A, Zolotov A, Tweed D, Cacciato M, Ceverino D, Primack J. R, 2013, MNRAS, 435, 999
- D’Onghia & Lake (2008) D’Onghia E, Lake G, 2008, ApJ, 686, L61
- Erb, Bogosavljević & Steidel (2011) Erb D. K, Bogosavljević M, Steidel C. C, 2011, ApJ, 740L, 31
- Fardal et al. (2001) Fardal M. A, Katz N, Gardner J. P, Hernquist L, Weinberg D. H, Davé R, 2001, ApJ, 562, 605
- Förster Schreiber et al. (2009) Förster Schreiber N. M. et al, 2009, ApJ, 706, 1364
- Förster Schreiber et al. (2011) Förster Schreiber N. M. et al, 2011, The Messenger, 145, 39
- Genel et al. (2008) Genel S. et al, 2008, ApJ, 688, 789
- Genel, Dekel & Cacciato (2012) Genel S, Dekel A, Cacciato M, 2012, MNRAS, 425, 788
- Genel et al. (2010) Genel S, Bouché N, Naab T, Sternberg A, Genzel R, 2010, ApJ, 719, 229
- Genzel et al. (2008) Genzel R. et al, 2008, ApJ, 687, 59
- Genzel et al. (2011) Genzel R. et al, 2011, ApJ, 733, 101
- Gillet et al. (2015) Gillet N, Ocvirk P, Knebe A, Libeskind N, Yepes G, Gottlöber S, Hoffman Y, 2015, ApJ, 800, 34
- Goerdt et al. (2010) Goerdt T, Dekel A, Sternberg A, Ceverino D, Teyssier R, Primack J. R, 2010, MNRAS, 407, 613
- Goerdt et al. (2012) Goerdt T, Dekel A, Sternberg A, Gnat O, Ceverino D, 2012, MNRAS, 424, 2292
- Goerdt et al. (in preparation) Goerdt T, Dekel A, Ceverino D, Teyssier R, in preparation
- Goerdt & Ceverino (2015) Goerdt T, Ceverino D, 2015, MNRAS, 450, 3359
- Goerdt et al. (2015) Goerdt T, Ceverino D, Dekel A, Teyssier R, 2015, arXiv:1505.01486
- Hammer et al. (2013) Hammer F. et al, 2013, MNRAS, 431, 3543
- Ibata et al. (2013) Ibata R. A. et al, 2013, Nature, 493, 62
- Ibata et al. (2014a) Ibata R. A, Ibata N. G, Lewis G. F, Martin N. F, Conn A, Elahi P, Arias V, Fernando N, 2014a, ApJL, 784, 6L
- Ibata et al. (2014b) Ibata N. G, Ibata R. A, Famaey B, Lewis G. F, 2014b, Nature, 511, 563
- Ibata et al. (2015) Ibata R. A, Famaey B, Lewis G. F, Ibata N. G, Martin N, 2015, ApJ, 805, 67
- Keller, Mackey & Da Costa (2012) Keller S. C, Mackey D, Da Costa G. S, 2012, ApJ, 744, 57
- Kereš et al. (2005) Kereš D, Katz N, Weinberg D. H, Davé R, 2005, MNRAS, 363, 2
- Kereš et al. (2009) Kereš D, Katz N, Fardal M, Davé R, Weinberg D. H, 2009, MNRAS, 395, 160
- Kroupa (1997) Kroupa P, 1997, New Astron, 2, 139
- Krumholz & Burkert (2010) Krumholz M, Burkert A, 2010, ApJ, 724, 895
- Li & Helmi (2008) Li Y.-S, Helmi A, 2008, MNRAS, 385, 1365
- Libeskind et al. (2005) Libeskind N. I, Frenk C. S, Cole S, Helly J. C, Jenkins A, Navarro J. F, Power C, 2005, MNRAS, 363, 146
- Libeskind et al. (2011) Libeskind N. I, Knebe A, Hoffman Y, Gottlöber S, Yepes G, Steinmetz M, 2011, MNRAS, 411, 1525
- Lovell et al. (2011) Lovell M. R, Eke V. R, Frenk C. S, Jenkins A, 2011, MNRAS, 413, 3013
- Macciò, Moore & Stadel (2006) Macciò A. V, Moore B, Stadel J, 2006, ApJ, 636, 25
- Ocvirk, Pichon & Teyssier (2008) Ocvirk P, Pichon C, Teyssier R, 2008, MNRAS, 390, 1326
- Onuora & Thomas (2000) Onuora L. I, Thomas P. A, 2000, MNRAS, 319, 614
- Pawlowski, Kroupa & de Boer (2011) Pawlowski M. S, Kroupa P, de Boer K. S, 2011, A&A, 532, A118
- Pawlowski et al. (2012a) Pawlowski M. S, Kroupa P, Angus G, de Boer K. S, Famaey B, Hensler G, 2012a, MNRAS, 424, 80
- Pawlowski, Pflamm-Altenburg & Kroupa (2012b) Pawlowski M. S, Pflamm-Altenburg J, Kroupa P, 2012b, MNRAS, 423, 1109
- Pawlowski et al. (2014) Pawlowski M. S. et al, 2014, MNRAS, 442, 2362
- Rauch et al. (2011) Rauch M, Becker G. D, Haehnelt M. G, Gauthier J-R, Ravindranath S, Sargent W. L. W, 2011, MNRAS, 418, 1115
- Rees & Ostriker (1977) Rees M. J, Ostriker J. P, 1977, MNRAS, 179, 541
- Rosdahl & Blaizot (2012) Rosdahl J, Blaizot J, 2012, MNRAS, 423, 344
- Shaya & Tully (2013) Shaya E. J, Tully R. B, 2013, MNRAS, 436, 2096
- Silk (1977) Silk J, 1977, ApJ, 211, 638
- Temple & Tamm (2015) Temple E, Tamm A, 2015, A&A 576, L5
- Temple et al. (2015) Temple E, Guo Q, Kipper R, Libeskind N.I, 2015, MNRAS, 450, 2727
- Tormen (1997) Tormen G, 1997, MNRAS, 290, 411
- Wetzstein, Naab, & Burkert (2007) Wetzstein M, Naab T, Burkert A, 2007, MNRAS, 375, 805
- White & Rees (1978) White S. D. M, Rees M. J, 1978, MNRAS, 183, 341