SN 2012ca: a stripped envelope core-collapse SN interacting with dense circumstellar medium ††thanks: Based on observations collected at the European Organisation for Astronomical Research in the Southern Hemisphere, Chile, as part of programme 188.D-3003 (PESSTO).
Abstract
We report optical and near-infrared observations of SN2012ca with the Public ESO Spectroscopy Survey of Transient Objects (PESSTO), spread over one year since discovery. The supernova (SN) bears many similarities to SN1997cy and to other events classified as Type IIn but which have been suggested to have a thermonuclear origin with narrow hydrogen lines produced when the ejecta impact a hydrogen-rich circumstellar medium (CSM). Our analysis, especially in the nebular phase, reveals the presence of oxygen, magnesium and carbon features. This suggests a core collapse explanation for SN2012ca, in contrast to the thermonuclear interpretation proposed for some members of this group. We suggest that the data can be explained with a hydrogen and helium deficient SN ejecta (Type I) interacting with a hydrogen-rich CSM, but that the explosion was more likely a Type Ic core-collapse explosion than a Type Ia thermonuclear one. This suggests two channels (both thermonuclear and stripped envelope core-collapse) may be responsible for these SN 1997cy-like events.
keywords:
supernovae: general – supernovae: circumstellar interaction1 Introduction
Supernovae (SNe) are produced by two physical mechanisms: thermonuclear SNe (SN Ia) which completely destroy the degenerate progenitor star (Hillebrandt & Niemeyer, 2000), and core-collapse SNe (CC-SNe) which leave a compact remnant (Janka, 2012). Thermonuclear SNe can be produced through a single-degenerate channel when a white dwarf accretes hydrogen and helium from a companion or through the merger of two WDs (Hillebrandt & Niemeyer, 2000). CC-SNe are produced by the explosion following the gravitational collapse of the cores of massive stars and classified according to the presence (SNe II) or absence (SN I) of H and/or He in their spectra (Filippenko, 1997). Theoretical stellar evolution calculations have long attempted to link evolved model stars (Heger et al., 2003; Langer, 2012) to the types of CC-SNe observed and in some cases the directly identified progenitors (Smartt, 2009). The two physical mechanisms are rather different, but a number of SNe have been discovered for which the underlying origin of the explosion is unclear.
Events such as SN 2002ic (Hamuy et al., 2003; Deng et al., 2004; Wood-Vasey, Wang, & Aldering, 2004) and PTF11kx (Dilday et al., 2012; Silverman et al., 2013a), exhibit unambiguous signs of the ejecta interacting with circumstellar material (CSM). They have been classified as interacting Type Ia SNe and are thought to be of thermonuclear origin. Their spectra appear to be a“diluted” spectrum of a bright SN Ia (e.g. SNe 1991T and 1999aa) along with superimposed H emission lines. PTF11kx shows the strongest evidence for being a thermonuclear event interacting with CSM expelled by a companion red giant star (Dilday et al., 2012). However the physical origin of other SNe are still uncertain and this debate dates back to the peculiar Type IIn SN1997cy (Germany et al., 2000; Turatto et al., 2000). The growing arguments that many such events with narrow hydrogen (classified as SNe IIn) could be thermonuclear has resulted in SN2008J (Taddia et al., 2012) being labelled as an interacting SN Ia, while new data for SN2005gj (Aldering et al., 2006; Prieto et al., 2007) has been used to suggest a thermonuclear origin rather than a CC-SN (Silverman et al., 2013b). But this is not the unanimous view, with Benetti et al. (2006) and Trundle et al. (2008) arguing for a core-collapse origin for SNe 2002ic and 2005gj, respectively.
These ambiguous and interacting events are important for determining the possible progenitor channels for SNe Ia in particular, but are rare. During the first run of the Public ESO Spectroscopy Survey of Transient Objects (PESSTO)111www.pessto.org in April 2012, SN2012ca was classified as an unusual Type IIn, with an early spectral resemblance to SN 1997cy. Its distance and brightness have allowed an extensive follow-up until late epochs providing another object to better understand whether these events are all interacting SNe Ia or some are in fact CC-SNe. The letter presents most of the first season of PESSTO optical and NIR data, which is publicly available in the ESO222as part of the Spectroscopic Survey Data Release 1 (SSDR1) and WISeREP333http://www.weizmann.ac.il/astrophysics/wiserep/ (Yaron & Gal-Yam, 2012) archives.
2 Observations and data analysis
SN2012ca was discovered in the late-type spiral galaxy ESO 336-G009 by Drescher, Parker, & Brimacombe (2012), with a first detection on 2012 April 25.6 UT (m14.8 mag). A spectrum was obtained at the New Technology Telescope (NTT) + EFOSC2 (Valenti et al., 2012; Inserra et al., 2012) on April 29.4 as part of PESSTO. The initial spectrum of SN2012ca showed a resemblance to a few SNe 1997cy-like explosions at 60 d post maximum. Because of the lack of early data, we cross-correlated the first spectrum with a library of SN 1997cy-like events at multiple epochs and found a best match adopting a peak light epoch at MJD (March 2). From the emission component of the Balmer lines a redshift was measured, consistent with that of the host galaxy. Adopting a standard cosmology with km s-1, and , NED444NASA/IPAC Extragalactic Database provides mag from the heliocentric radial velocity of km s-1, which will be used throughout the letter. There is no detection of Na i interstellar medium (ISM) features from the host galaxy, nor do we have any evidence of significant extinction inside the host from the SN spectra itself. This suggests that the internal absorption is low and we assume it to be negligible. Moreover, SN2012ca is 3.5 kpc far from the centre of the host galaxy, this is consistent with the absence of significant extinction. The Galactic reddening toward the SN line of sight is mag (Schlafly & Finkbeiner, 2011), which we correct for in the following. Spectro-photometric follow-up was obtained by PESSTO with NTT+EFOSC2, PROMPT (Reichart et al., 2005), Swift+UVOT and ANU+WiFeS in optical, while in near infrared (NIR) with NTT+SOFI. Images and spectra were reduced in the standard fashion, and the NTT data were processed within the PESSTO pipeline as in Valenti et al. (2013); Fraser et al. (2013). The resolution of the optical spectra were checked and found to be 18 Å and 2 Å for the EFOSC2 and WiFeS data, respectively. The resolution in the NIR were 23 Å (blue grism) and 33 Å (red grism).
2.1 Bolometric luminosity

A pseudo-bolometric light curve () of SN2012ca (Fig. 1) was constructed using similar methods as in Inserra et al. (2013). There is certainly flux outside these bands however, to first order we assume that these contributions are similar in each SN. This allows an approximate comparison of the pseudo-bolometric luminosities which is not as comprehensive as full bolometric measurements, but better than using single band comparisons. Although there are uncertainties in the explosion date, peak epoch and some caveats comparing pseudo-bolometric lightcurves determined using different optical filter systems, SN2012ca appears brighter and more slowly declining than SN2005gj. It is of comparable luminosity to SN1997cy between 60-250 d from peak, and also to the luminous Type IIn SN2010jl. However it is significantly brighter and slower evolving than SNe 1991T (Ia) and 1998bw (Ic) or the interacting Ibn SN2006jc. Indeed, SN2012ca appears to be 10 times more luminous than the bright SN Ic reported in Fig. 1, and its overall evolution is much slower than that of normal Type Ic or Type Ia events. The post peak decline rate is mag/100 d until the last epoch available, and is much slower than those of the interacting SNe Ia PTF11kx and SN2005gj and the Type Ibn 2006jc, with , and mag/100d, respectively. The decrease is slower than the 56Co decay even at 250 d, suggesting that the interaction is still the main energy source. One striking feature in Fig. 1 is the self-similarity of SN2012ca, SN1997cy, SN2005gj and how different they appear compared to the initial decline of PTF11kx. While the PTF11kx decline after 200 d is similar to that of SN2012ca, the late-time values of the former are determined solely from -band observations (assuming constant colours from neighbouring epochs) and show considerable scatter, thus we suggest to treat this result with caution.
2.2 Spectroscopy
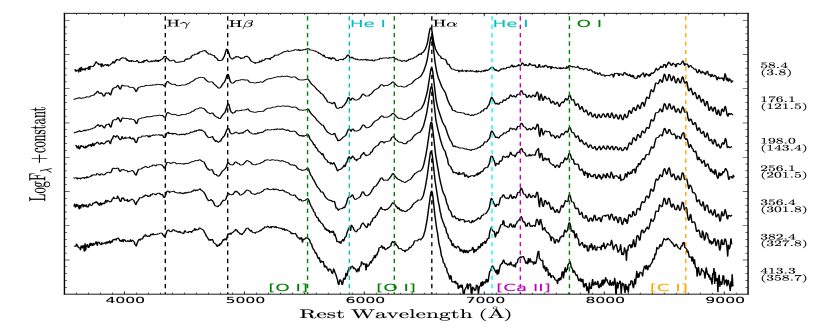
Optical spectra of SN2012ca are shown in Fig. 2 to illustrate the evolution during the first year. The somewhat blue continuum does not show significant evolution, suggesting an origin due to multiple, narrow lines of iron-group elements creating a pseudo continuum (Smith et al., 2009; Silverman et al., 2013b). After about 180 d the pseudo-continuum seems visible only at wavelength shorter than 5500 Å, whereas the features redward look nebular. Most notable in SN2012ca is the presence of Balmer and He i emission lines through its entire evolution. The high resolution of WiFeS allows us to resolve narrow components in H lines. We see narrow P-Cygni absorption in H from a wind, as shown in Fig. 3 (right). The expansion velocity of the absorption minimum is km s-1 , a factor 3 greater than that measured for PTF11kx (65 km s-1; Dilday et al., 2012). This is also a factor 2 or 3 greater than that observed in probable diffuse CSM from the companion of an exploding WD in some SNe Ia (50-100 km s-1; Patat et al., 2011). However, Sternberg et al. (2011) noted that some higher velocities (150-200 km s-1) can be reached in the CSM of a small fraction of SNe Ia. A broader emission component is also identified for H and He i. No P-Cygni profiles linked to this component are seen. The He i broader component shows a FWHM velocity km s-1, decreasing to km s-1 in the last spectrum, while H has km s-1 in the same period. This is also confirmed by the measurement of the unblended NIR features (see below). These broad lines can be associated with the fast-moving ejecta or, in case of interaction such as in SN2012ca, viable explanations are boxy emission from interaction (Chevalier & Fransson, 1994) or Thomson scattering of photons by electron in a dense CSM (Chugai, 2001; Dessart et al., 2009). From deblending the Ca ii NIR components, we measure a velocity of km s-1 (at +198d) related to the fast-moving ejecta, higher than those of H and He, suggesting a different origin for those emission components.
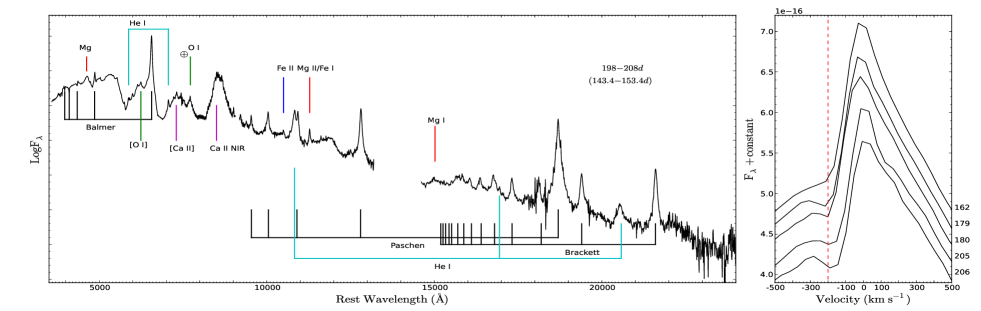
A combined spectrum comprised of an optical and a blue NIR grism taken on Sept. 15, plus a red NIR grism taken on Sept. 24 is shown in Fig. 3. As reported above, the optical region shows Balmer lines in emission, while the Paschen and Brackett series are visible at wavelengths Å with comparable velocities to the Balmer series at that phase ( km s-1). He i 5876, 7065, 10830 and 20589 emission lines are clearly detected, and also tentatively at Å. Calcium has also been identified with a weak Ca ii H&K line, the Ca NIR triplet and the [Ca ii] doublet, implying that at 198d the SN is moving toward the nebular phase. Two puzzling lines at Å and Å are detected. They could be [O i] 6300, 6364 and O i 7774 (v km s-1), but blue shifted by km s-1. This hypothesis is strengthened by the presence of a line at Å identifiable as [O ii] blue shifted at the same velocity. The shift could be attributed to asymmetries in the ejecta or a clump moving toward us. Moreover, [O i] 5577 blue shifted by the same amount could be responsible for the red shoulder of the pseudo continuum. Metal lines of various species are unambiguously detected both in the optical and the NIR. Fe ii multiplet 42 is responsible for the features redder than H. Mg i] 4571 is already seen at this phase and gives plausibility to the detection of [O i] because of their mutual presence in Type Ib/c SNe (see Hunter et al., 2009). Other Mg lines could explain the feature at Å in the first spectrum and at 11300 Å at d, whilst Mg i 15024, the strongest Mg line in the NIR, is detected and we measured a FWHM velocity of 7000 km s-1. After 256 d the Ca NIR triplet is weaker, and [C i] at Å is shown in emission. The [C i] profile resembles those of typical SNe Ic after five months from peak (Filippenko, 1997).
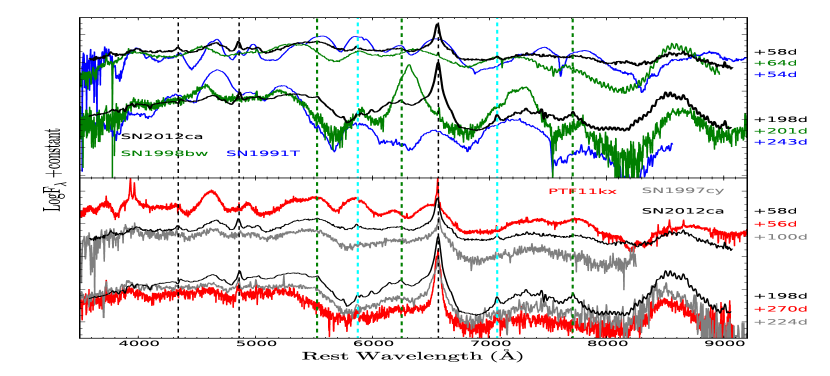
Since SNe Ia and Ic have similar spectral evolution during the photospheric period and as a consequence it is not easy to detect features uniquely seen in a class before 60 d post maximum (Taubenberger et al., 2006), especially if we take into account the interaction. In Fig. 4 we compare SN2012ca spectra with those of the bright SNe 1998bw (Ic) and 1991T (Ia) at similar epochs to investigate possible spectral similitudes. In the earliest spectrum of SN2012ca the blue region ( Å) appears more similar to SN 1998bw than SN 1991T both in continuum and line profiles. In the region around H we cannot make a detailed comparison because of the presence of the emission lines, however the Si ii and [Fe ii] lines typical of Type Ia SNe are not consistent with the line profiles seen in SN2012ca, even after accounting for dilution by a continuum. In the nebular phase comparison, a SN Ia spectrum at a similar phase to SN2012ca makes it difficult to explain the region bluer than 6500Å because of the presence of [Fe ii], [Fe iii] and [Co ii] lines in the former. In contrast, SN2012ca bears more resemblance to SN1998bw. We suggest the emission features at 6250Å and 7710Å are indeed [O i] which would make a Ia origin unlikely. While the features are not as broad and prominent as in SN1998bw, we suggest they are most likely to be [O i], and hence are important indications of a core-collapse origin. In the bottom panel of Fig. 4 the difference between an interacting Type Ia and SN2012ca becomes clear, comparing the object to PTF11kx at similar epochs. They show some dissimilarities, mainly due to the presence of strong metal lines such as Fe ii in PTF11kx. The 198 d spectrum is more similar to that of SN1997cy at 224 d (epoch defined in Turatto et al., 2000) and both show a spectral evolution in the [O i] lines regions different to that of PTF11kx. SN2012ca and SN 1997cy have similar He i emission lines (EW EWÅ, EWÅ and EWÅ), and H FWHM velocity ( km s-1 and km s-1).
3 Is SN2012ca an interacting CC-SNe?
The discovery of PTF11kx and its nature has changed the paradigm of these SN1997cy-like events, leading Silverman et al. (2013b) to suggest a thermonuclear origin for the majority, or even all, of these type of events. The data for SN2012ca indicate that it too is similar to SN1997cy and we consider it more likely to have a core-collapse origin. The evidence for a core collapse interpretation are summarised as follows:
-
•
The overall spectral evolution of SN2012ca is hard to explain using diluted Type Ia spectra with superimposed emission. SNe Ia over one year are dominated by forbidden iron lines, as also shown by Filippenko et al. (1992) for the luminous SN1991T. On the contrary, a broad-line Type Ic such as SN1998bw shows more spectral similarities.
-
•
O i, [O i] and [O ii] lines were likely identified, blue shifted by 2500 km s-1. A number of magnesium lines were identified, including Mg i 15024 which is usually seen in spectra of Type Ic SNe (e.g. SNe 1998bw, 2004aw; Patat et al., 2001; Taubenberger et al., 2006). Both elements, and their observed line strengths are more indicative of a massive progenitor and CC-SN origin.
-
•
We detect [C i] at 8700 Å at 413 d with km s-1. This is again similar to what is typically seen in the ejecta of Type Ic SNe (e.g. Filippenko, 1997).
-
•
The Ca ii NIR triplet is usually seen during the photospheric phase of Type Ia SNe (Filippenko, 1997). Forbidden [Ca ii] has been seen only in sub luminous SNe Ia (Filippenko et al., 1992), but not in normal or bright (e.g. SN 1991T) SNe Ia. The SNe Ia ejecta environment is typically more strongly ionised than in SNe Ic, thus the absence of [Ca ii] in Type Ia SNe is probably linked to the fact that it is at a higher ionisation state (Liu, Jeffery, & Schultz, 1997; Mazzali et al., 2010). Any possible interaction should enhance this effect, and so the presence of [Ca ii] in SN2012ca again points towards core collapse.
-
•
H narrow P-Cygni absorption from a wind has been detected with an expansion velocity of 200 km s-1, a factor greater than what was seen in PTF11kx.
-
•
Broader and persistent He i emission lines have been detected in SN2012ca, in contrast to what seen in PTF11kx. Furthermore, it appears that little to no He i emission is a key attribute of members of the SN Ia-CSM class (Silverman et al., 2013b).
The data favour the interpretation of SN2012ca as a CC-SN, with a certain degree of asymmetry in the ejecta and surrounded by a H- and He-rich CSM. The interacting SN Ia scenario appears to work well for for PTF11kx but the link has been extended broadly to many SNe showing interaction which are SN1997cy-like. We argue that this is almost certainly premature, and that the extensive data set for SN2012ca, including the bolometric lightcurve and optical to NIR spectral sequence is strongly suggestive of a core-collapse origin. The similarity to bright SNe Ic nebular spectra at phases of 150d suggests that it could well have been a stripped envelope progenitor which impacts and interacts with an H-rich CSM. Although the presence of H in the spectra and narrow emission lines suggest a classification as a Type IIn SN by definition, we do not find clear evidence that the SN ejecta was H-rich. This illustrates the limitations of our currently employed SN classification nomenclature. Indeed SN2012ca and probably SN1997cy are better referred to as interacting stripped envelope SNe. SN2012ca provides evidence of a viable alternative scenario to the thermonuclear interpretation (Ia-CSM, Silverman et al., 2013b) about interacting SNe with H and He rich CSM, suggesting that two different channels may be responsible for SN1997cy-like events.
Acknowledgments
Based on observations collected by PESSTO, and the Panchromatic Robotic Optical Monitoring and Polarimetry Telescope (PROMPT), Chile; the Australian National University 2.3m Telescope and the Swift Satellite. Funded by the European Research Council under the European Union’s Seventh Framework Programme (FP7/2007-2013)/ERC Grant agreement no [291222] (SJS). SB and AP acknowledge the PRIN-INAF 2011 project “Transient Universe: from ESO Large to PESSTO". G.P. acknowledges Millennium Center for Supernova Science (P10-064-F).
References
- Aldering et al. (2006) Aldering G., et al., 2006, ApJ, 650, 510
- Benetti et al. (2006) Benetti S., Cappellaro E., Turatto M., Taubenberger S., Harutyunyan A., Valenti S., 2006, ApJ, 653, L129
- Chevalier & Fransson (1994) Chevalier R. A., Fransson C., 1994, ApJ, 420, 268
- Chugai (2001) Chugai N. N., 2001, MNRAS, 326, 1448
- Deng et al. (2004) Deng J., et al., 2004, ApJ, 605, L37
- Dessart et al. (2009) Dessart L., Hillier D. J., Gezari S., Basa S., Matheson T., 2009, MNRAS, 394, 21
- Dilday et al. (2012) Dilday B., et al., 2012, Sci, 337, 942
- Drescher, Parker, & Brimacombe (2012) Drescher C., Parker S., Brimacombe J., 2012, CBET,3101,1
- Filippenko (1997) Filippenko A. V., 1997, ARA&A, 35, 309
- Filippenko et al. (1992) Filippenko A. V., et al., 1992, AJ, 104, 1543
- Filippenko et al. (1992) Filippenko A. V., et al., 1992, ApJ, 384, L15
- Fraser et al. (2013) Fraser M., et al., 2013, MNRAS, 1499
- Galama et al. (1998) Galama T. J., et al., 1998, Natur, 395, 670
- Germany et al. (2000) Germany L. M., Reiss D. J., Sadler E. M., Schmidt B. P., Stubbs C. W., 2000, ApJ, 533, 320
- Gómez & López (1998) Gómez G., López R., 1998, AJ, 115, 1096
- Hamuy et al. (2003) Hamuy M., et al., 2003, Natur, 424, 651
- Hamuy et al. (2002) Hamuy M., et al., 2002, AJ, 124, 417
- Heger et al. (2003) Heger A., Fryer C. L., Woosley S. E., Langer N., Hartmann D. H., 2003, ApJ, 591, 288
- Hillebrandt & Niemeyer (2000) Hillebrandt W., Niemeyer J. C., 2000, ARA&A, 38, 191
- Hunter et al. (2009) Hunter D. J., et al., 2009, A&A, 508, 371
- Inserra et al. (2013) Inserra C., et al., 2013, ApJ, 770, 128
- Inserra et al. (2012) Inserra C., et al., 2012, CBET, 3101, 1
- Janka (2012) Janka, H.-T. 2012, Annu. Rev. Nucl. Part. Sci., 62, 407
- Langer (2012) Langer, N. 2012, ARA&A, 50, 107
- Lira et al. (1998) Lira P., et al., 1998, AJ, 115, 234
- Liu, Jeffery, & Schultz (1997) Liu W., Jeffery D. J., Schultz D. R., 1997, ApJ, 483, L107
- Mazzali et al. (2010) Mazzali P. A., Maurer I., Valenti S., Kotak R., Hunter D., 2010, MNRAS, 408, 87
- Pastorello et al. (2007) Pastorello A., et al., 2007, Natur, 447, 829
- Patat et al. (2011) Patat F., Chugai N. N., Podsiadlowski P., Mason E., Melo C., Pasquini L., 2011, A&A, 530, A63
- Patat et al. (2001) Patat F., et al., 2001, ApJ, 555, 900
- Prieto et al. (2007) Prieto J. L., et al., 2007, arXiv, arXiv:0706.4088
- Reichart et al. (2005) Reichart D., et al., 2005, NCimC, 28, 767
- Schlafly & Finkbeiner (2011) Schlafly E. F., Finkbeiner D. P., 2011, ApJ, 737, 103
- Silverman et al. (2013a) Silverman J. M., et al., 2013a, ApJ, 772, 125
- Silverman et al. (2013b) Silverman J. M., et al., 2013b, ApJS, 207, 3
- Smartt (2009) Smartt, S. J. 2009, ARA&A, 47, 63
- Smith et al. (2009) Smith N., et al., 2009, ApJ, 695, 1334
- Sternberg et al. (2011) Sternberg A., et al., 2011, Sci, 333, 856
- Taddia et al. (2012) Taddia F., et al., 2012, A&A, 545, L7
- Taubenberger et al. (2006) Taubenberger S., et al., 2006, MNRAS, 371, 1459
- Trundle et al. (2008) Trundle C., Kotak R., Vink J. S., Meikle W. P. S., 2008, A&A, 483, L47
- Turatto et al. (2000) Turatto M., et al., 2000, ApJ, 534, L57
- Valenti et al. (2013) Valenti S., et al., 2013, arXiv, arXiv:1302.2983
- Valenti et al. (2012) Valenti S., et al., 2012, ATel, 4076, 1
- Wood-Vasey, Wang, & Aldering (2004) Wood-Vasey W. M., Wang L., Aldering G., 2004, ApJ, 616, 339
- Yaron & Gal-Yam (2012) Yaron O., Gal-Yam A., 2012, PASP, 124, 668
- Zhang et al. (2012) Zhang T., et al., 2012, AJ, 144, 131