Dense Suspension Splat: Monolayer Spreading and Hole Formation After Impact
Abstract
We use experiments and minimal numerical models to investigate the rapidly expanding monolayer formed by the impact of a dense suspension drop against a smooth solid surface. The expansion creates a lace-like pattern of particle clusters separated by particle-free regions. Both the expansion and the development of the spatial inhomogeneity are dominated by particle inertia, therefore robust and insensitive to details of the surface wetting, capillarity and viscous drag.
pacs:
82.70.Kj, 45.70.Qj, 82.70.Dd, 47.57.Qk, 47.57.GcSince the pioneering work by Worthington Worthington (1876) the spreading of liquids droplets upon impact has remained an active research area Rein (1993); Marengo et al. (2011). At meters-per-second impact speeds, the spreading divides into two stages Clanet et al. (2004): an initial, rapid spreading dominated by liquid inertia and, consequently, insensitive to surface wetting, capillary or liquid viscosity, followed by a slower evolution where the intricate interplay of these effects is important.
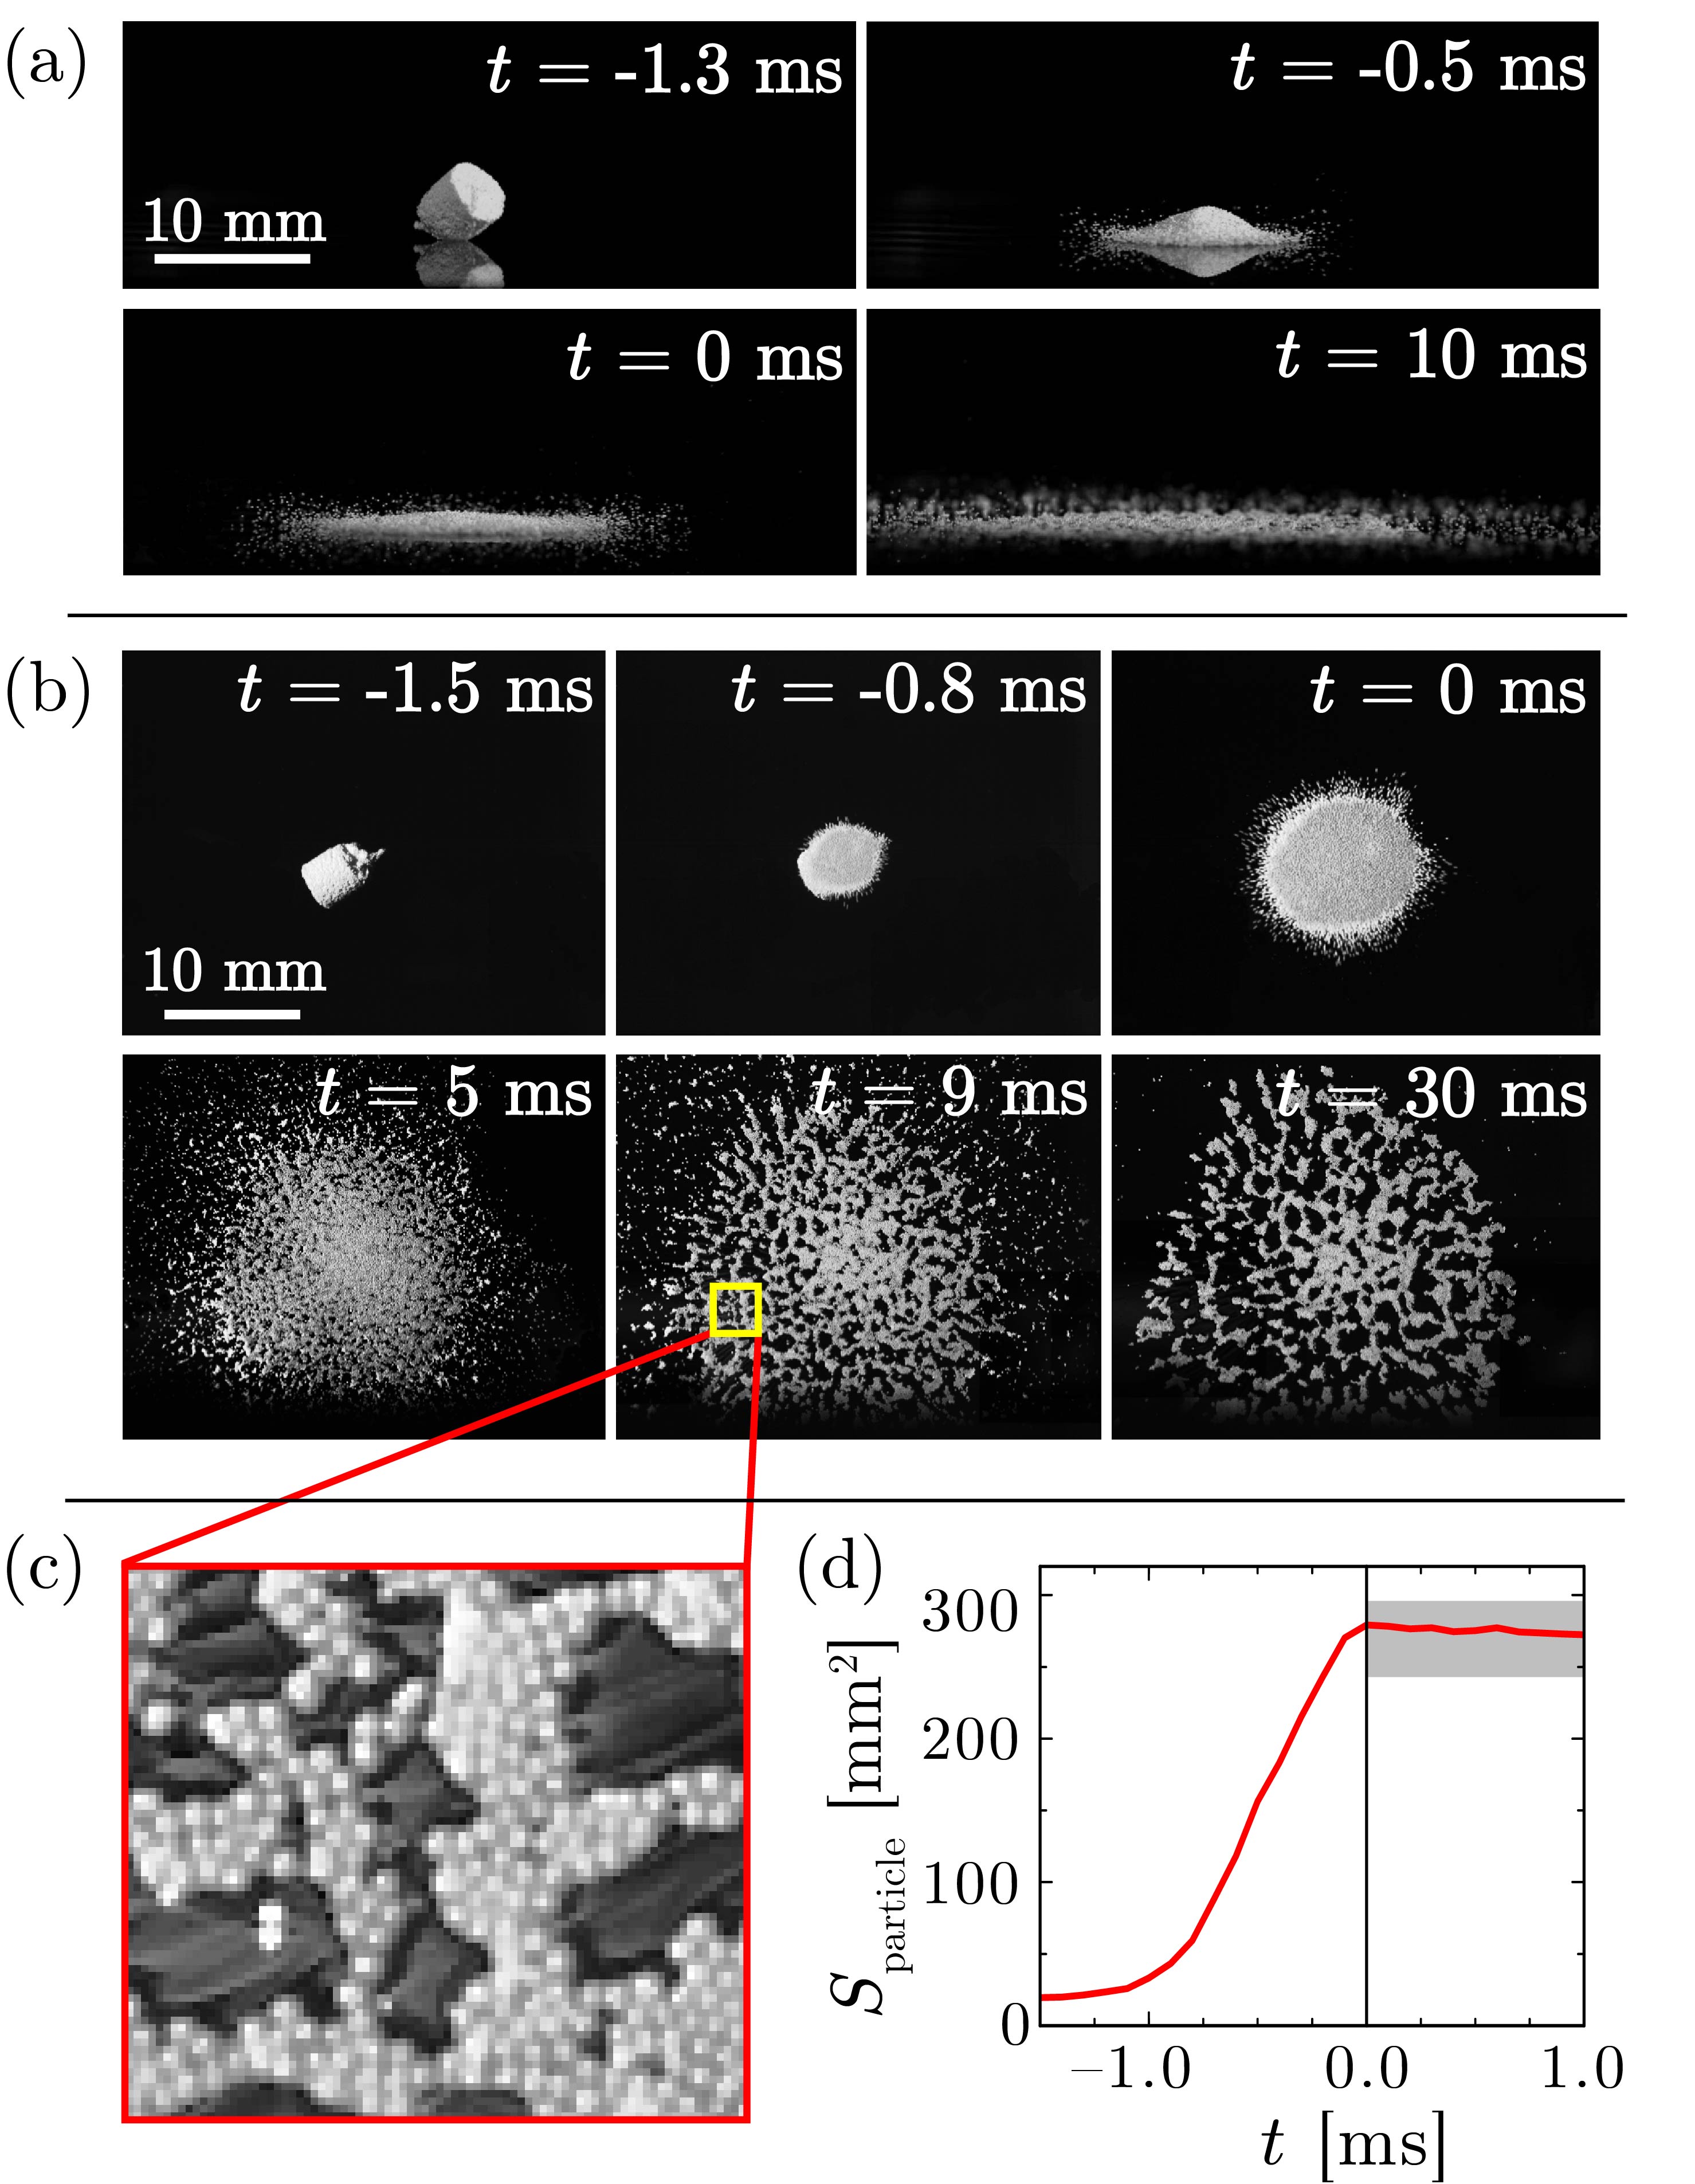
Here we examine an analogous inertia-dominated spreading dynamics in dense suspension impact. We use a suspension of rigid, non-Brownian particles at high volume fraction ( or above). This impact regime has received little study Peters et al. (2013). Previous studies on particle-laden drop impact have mainly analyzed slow evolution in dilute and semi-dilute suspensions de Jong et al. (2007); Hu and Larson (2006); Nikolov et al. (2002); Nicolas (2005). We find that impact at several meters per second produces a novel outcome (Fig. 1): the suspension drop deforms into a splat comprised of a single layer of densely packed particles immersed in a thin liquid layer. As the splat expands, void-like regions appear and grow, causing the final splat to display a lace-like pattern of particle clusters separated by particle-free regions. Because particle inertia dominates the expansion and the instability, the monolayer splat dynamics is robust and only weakly modified by surface wetting, capillary and viscous drag.
This insensitivity to material and surface properties is often the desired outcome in coating processes. This makes our results useful in ongoing efforts to assess the cohesive strengths of colloidal semiconductor quantum dots by measuring their maximal splat size after impact Qi et al. (2011), as well as applications such as thermal spray coating of sintered powders Fukumoto and Huang (1999) and additive manufacturing using inkjet printing Seerden et al. (2004); Derby (2011). These processes often involve concentrated suspensions. Moreover the impact speeds are often very large. As a result, despite the smaller particles used in these processes, the post-impact spreading dynamics belongs in the same particle-inertia dominated regime as our experiments.
Experiments —
Dense suspensions were made by adding spherical particles to water or silicon oils. Letting the particles sediment inside a straight cylindrical syringe produces packing fractions of . As gravity pulls the suspension down, a pinch-off occurs below the cylinder opening Miskin and Jaeger (2012); Bertrand et al. (2012). In the dense suspension limit studied here, the plugs preserve the cylindrical shape of the syringe, resulting in a plug radius , and have a height . The substrate was a smooth, horizontal glass plate below the syringe.
Figure 1 shows typical image sequences of the impact, recorded by high-speed video. We denote as the moment when a monolayer first forms. Before this moment the cylinder-shaped plug flattens into a single-particle layer. This time point can be defined precisely by viewing plug impact onto a transparent glass slide from below and plotting the substrate coverage area as a function of time [Fig. 1(c)]. The transition to constant area indicates the monolayer onset.
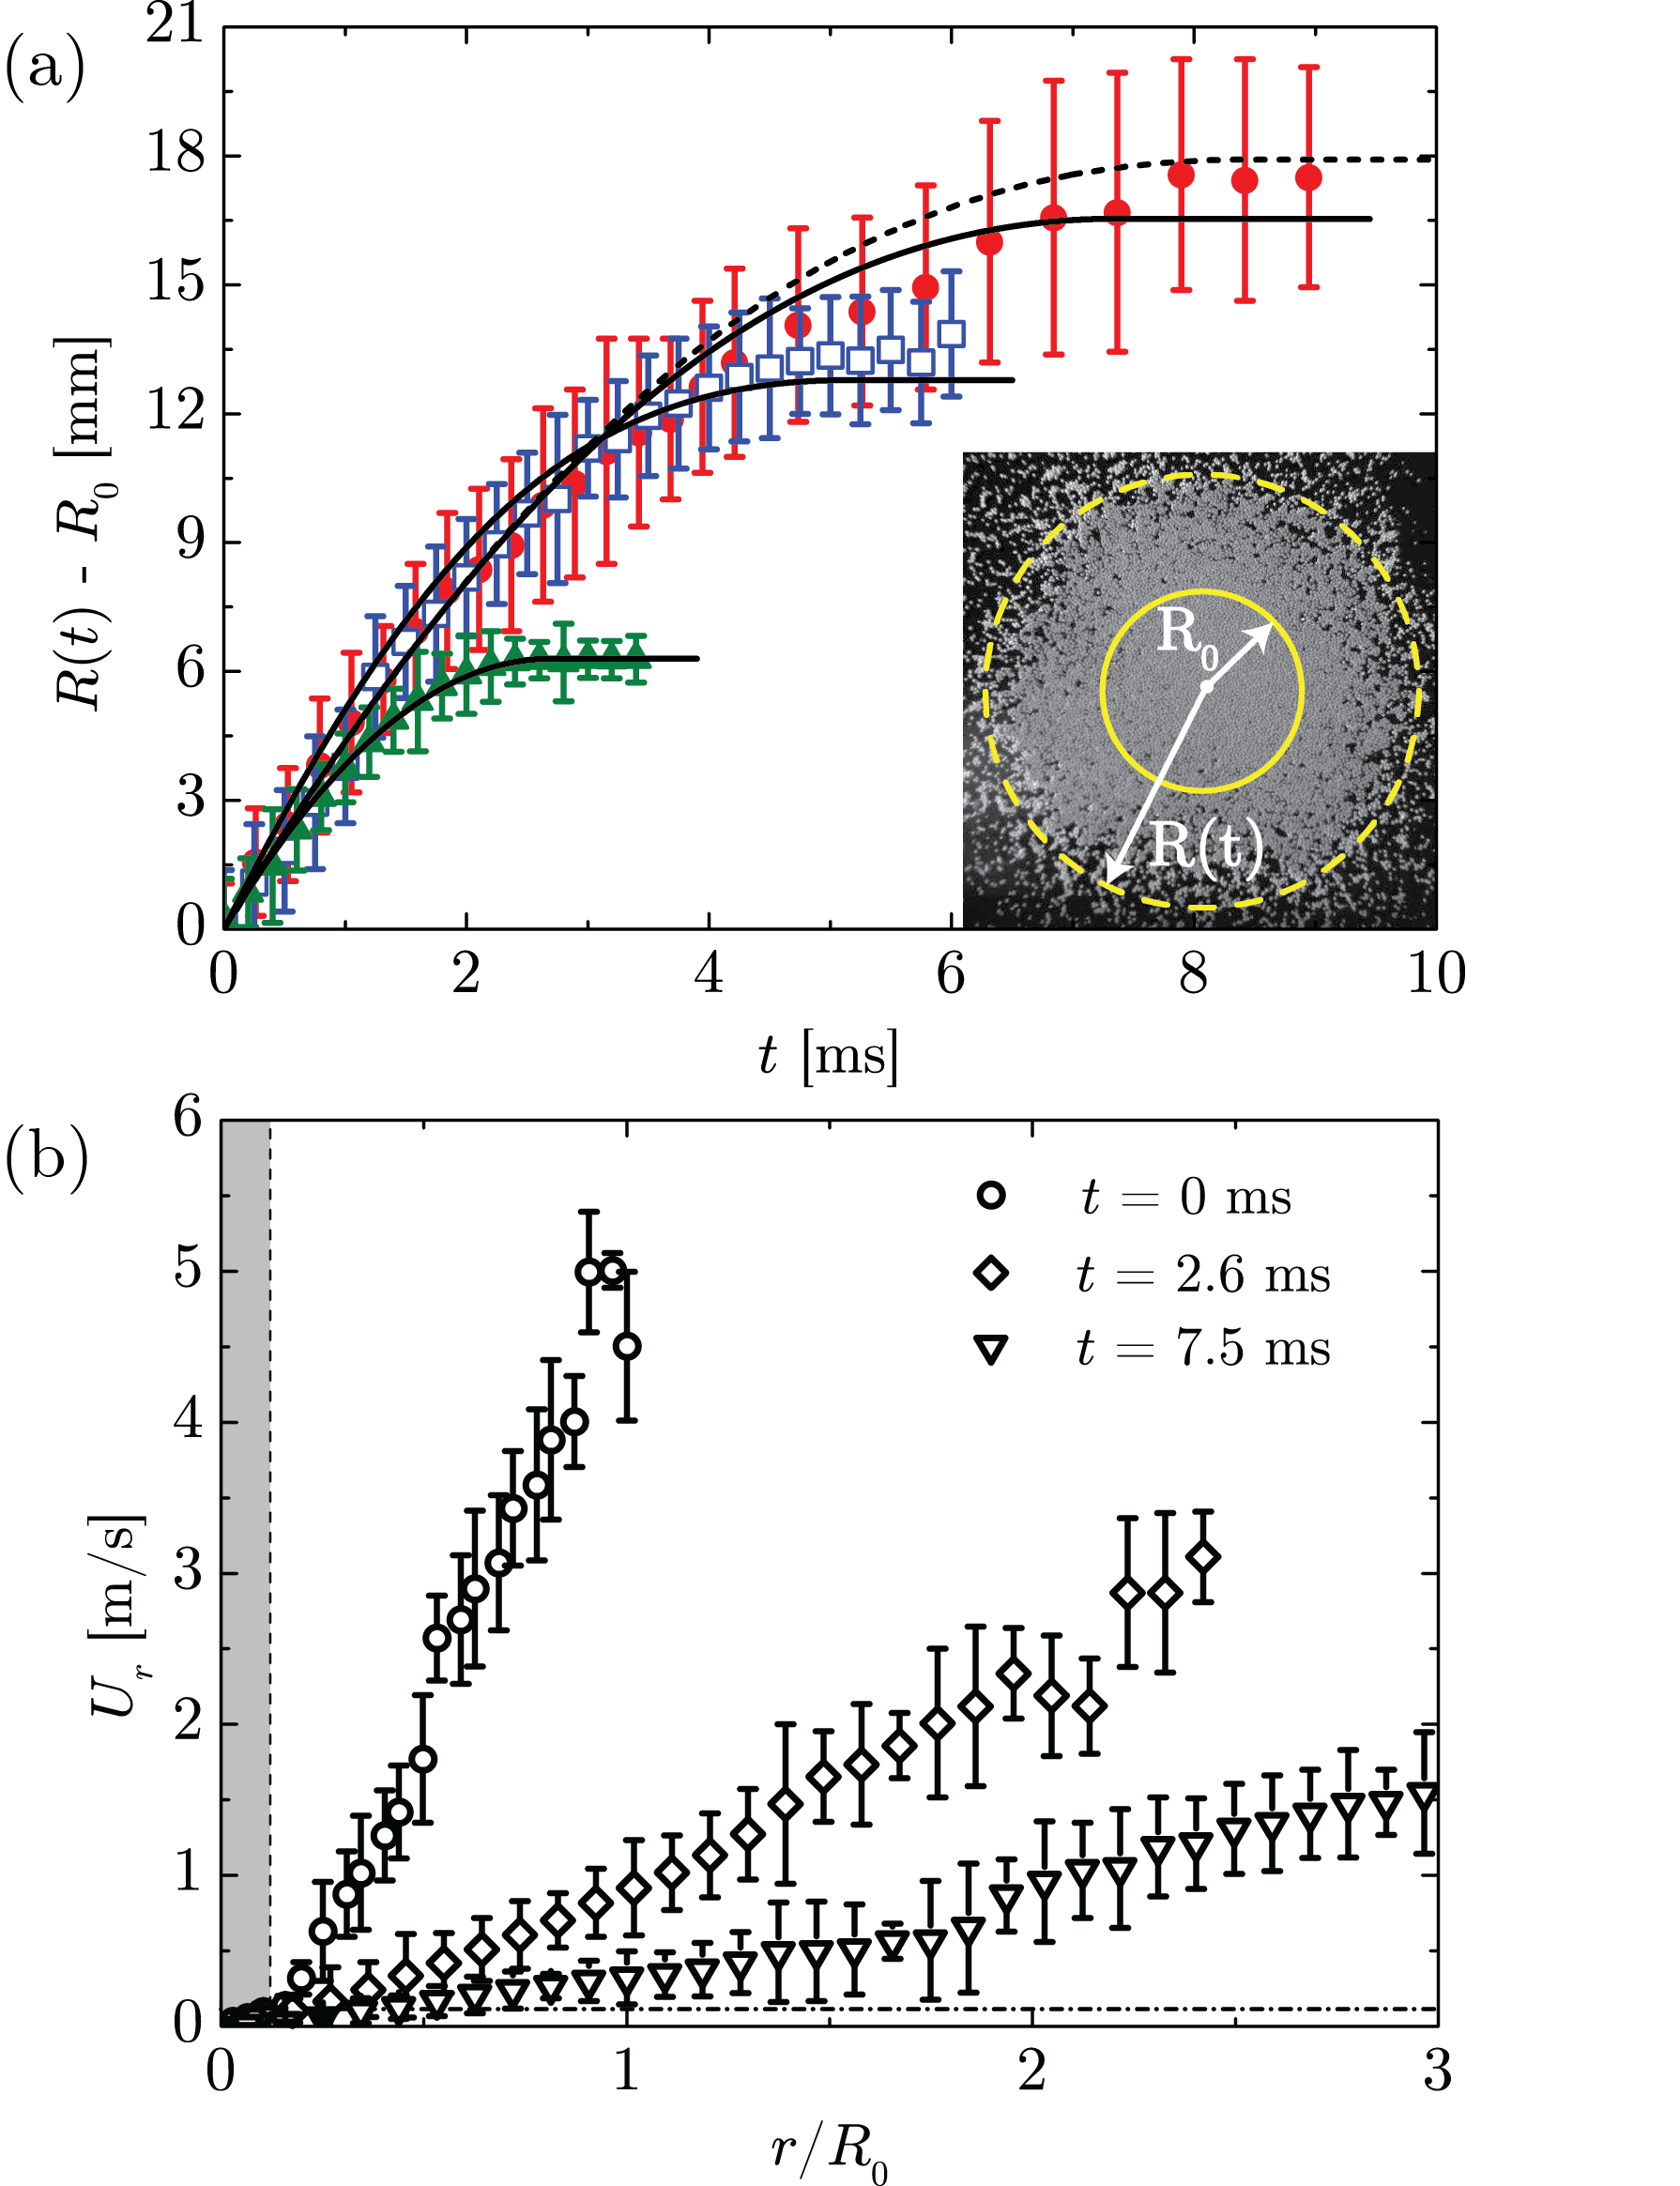
After , the monolayer expands radially and develops holes. We measure the expansion by azimuthally averaging the particle density as a function of radial distance and define the splat’s edge as the sharp transition zone from high to zero density. Fig. 2(a) plots , the difference between the splat radius and the initial monolayer radius . The velocity field is obtained by azimuthally averaging the particle motion [Fig. 2(b)]. We find a linear straining flow, starting at zero velocity at the small dead zone of immobile particles at the center of impact (shaded region). At later times, this linear straining flow weakens but retains its form. This velocity field is consistent with the self-similar, inertia-dominated thin-film spreading flow after impact, first described by Yarin & Weiss Yarin and Weiss (1995), and supports the idea that inertia dominates the expansion. We quantify the time evolution of the spatial inhomogeneity in terms of the area fraction in the splat occupied by the particle-free regions. Since the instability grows fastest near the outer edge and slower in the interior, we divide the splat into an inner and outer annulus that contain approximately the same particles over time, and plot the average area fraction of void regions within each annulus as a function of time. The measured void fraction initially grows rapidly, then slows and saturates [Fig. 4(b)].
Our experiments are characterized by the particle-based Weber number , where is surface tension and is the initial expansion speed for the monolayer, and the Stokes number , where is the suspending liquid viscosity. Using speeds at the expanding edge, the water and silicone oil suspension impacts featured in 2(a) have (water) and (silicone oil), and values of (water), (1.8 cSt oil) and (10 cSt oil). The rate of strain is so large that and are both much larger than over almost all the splat interior.
Splat Expansion—
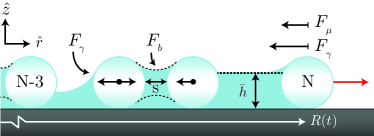
Given and we consider the following particle-inertia dominated model. We assume the splat expands as fast as particles at the splat’s leading edge can move and that these particle motions are unaffected by collisions. As a result, the only forces acting on the leading-edge particles are surface tension and drag due to motion relative to the liquid layer and/or the solid substrate. First, to estimate the force due to surface tension, we note that in the experiments the particle remains fully coated by the suspending liquid through out the expansion. This gives rise to an asymmetric free surface shape: a thin liquid film coats the front surface of the particle at the outermost edge while the rear half of the particle remains immersed in a thicker liquid layer (Fig. 3). This yields a retarding force . Because the value of the constant depends on the free-surface asymmetry, it varies from particle to particle and changes over time depending on the precise configuration of neighbors wet ; sup . This makes an explicit calculation cumbersome. Here we will simply determine the value of by fitting the model predictions against measurements. Second, the drag experienced by a leading-edge particle moving outwards with speed has several distinct contributions. Measurements suggest the dominant contribution is viscous drag due to a thin trailing liquid streak sup . If the average liquid layer thickness in the splat is , then the average viscous stress experienced by the particle as it drags a liquid streak along is . If we assume in addition that this viscous stress acts over , the projection of the particle surface area in the direction of motion, then , the total drag due to the trailing streak, is . Comparison with measured data presented later will show that this expression gives a quantitatively correct description for splat expansion at high liquid viscosities.
Requiring where is the particle mass and its acceleration at the leading edge yields an evolution equation for the splat radius
| (1) |
Since the volume of liquid inside the suspension is conserved over time and the liquid layer is much thinner than the particle diameter, the unknown liquid layer thickness is directly related to via , where is the volume of the suspension plug.
Fig. 2(a) plots the measured splat expansion dynamics against those calculated using Eqn. (1) initialized with measured values of and . We found that choosing the prefactor to be yields the best agreement with the measured evolution for water-solvent suspension, which has the highest surface tension value 111Varying by 10% still allows a fit within the error bar range of experiments.. The model also produces good agreement with data from the cst silicone oil suspension, where the expansion is slowed by viscous drag. This shows that the proposed expression for is quantitatively accurate. As far as we are aware, this simple drag law has neither been proposed nor tested against data in previous studies.
Splat Instability—
Because the monolayer splat regime is characterized by large particle inertia together with small surface tension and viscous drag, the observed spatial inhomogeneity originates as small variations in the particle velocities within the initial, densely packed monolayer splat. These imperfections are amplified by the subsequent rapid expansion and grow into a lace pattern. This instability is qualitatively different from capillarity induced aggregation Vella and Mahadevan (2005), which proceeds on a time-scale far longer than the monolayer expansion time-scale. The inertia-dominated instability is also far less sensitive to the detailed forms of capillarity and/or viscous drag. Neither is required to nucleate the instability. Nor do they control the instability growth rate. As a result, a minimal numerical model in which particle inertia is weakly perturbed by capillary and viscous drag is capable of quantitatively reproducing the main features of the instability.
A one-dimensional (1D) model based on this scenario gives reasonable agreement with measured growth rates for the spatial inhomogeneity. The model considers a chain of particles which lie along a ray emanating from the center of the splat (Fig. 3). Because surface tension and viscous drag merely perturb the dominant inertial motion, simple approximations will turn out to be sufficient for a quantitatively accurate description. Specifically, each particle in the chain experiences viscous drag where is the speed of the th particle in the chain. Initially the particles in the chain are closely packed together and each experiences cohesive capillary forces with neighbors ahead of and behind itself. As the splat expands rapidly, the interface profile is dominated by particle inertia therefore deforming to coat the particles as they move outwards. In the region between particles, the highly dynamical surface shape is controlled by liquid inertia and viscous drag, and therefore remains nearly flat once the particles are sufficiently far apart. Therefore no cohesive capillary forces are expected to be present between particles more than a critical distance apart. To model this force, we use the formula for the cohesion exerted by an axisymmetric, static liquid bridge connecting two fully wetted spheres Herminghaus (2005). This is not because this corresponds to our dynamic situation, but because it recapitulates the main desired features once is allowed to vary sup . As the gap between the neighboring particles exceed a critical value , the cohesive capillary interaction switches off (). Instead, motivated by images from the experiment showing faster moving particles leaving streaks of liquid behind themselves, we require that a particle far ahead of its neighbor in the chain model experiences a retarding force due to surface tension , while the left-behind neighbor no longer is pulled forward force by a liquid bridge.
The dashed line in Fig. 2(a) gives the position of the outermost particle in the -particle chain and agrees well with the measured evolution. Comparisons with the other two systems also show good agreement and are given in sup . Finally, we calculate the void fraction evolution from the chain model and plot the results in 4(b). Importantly, the calculated instability dynamics is robust when changing model parameters. Altering the value for by from used in generating the chain model result presented in Fig. 4(b), or using an initial velocity fluctuation that is half, or double the value used, produces negligible changes.
2D Simulation of Instability—
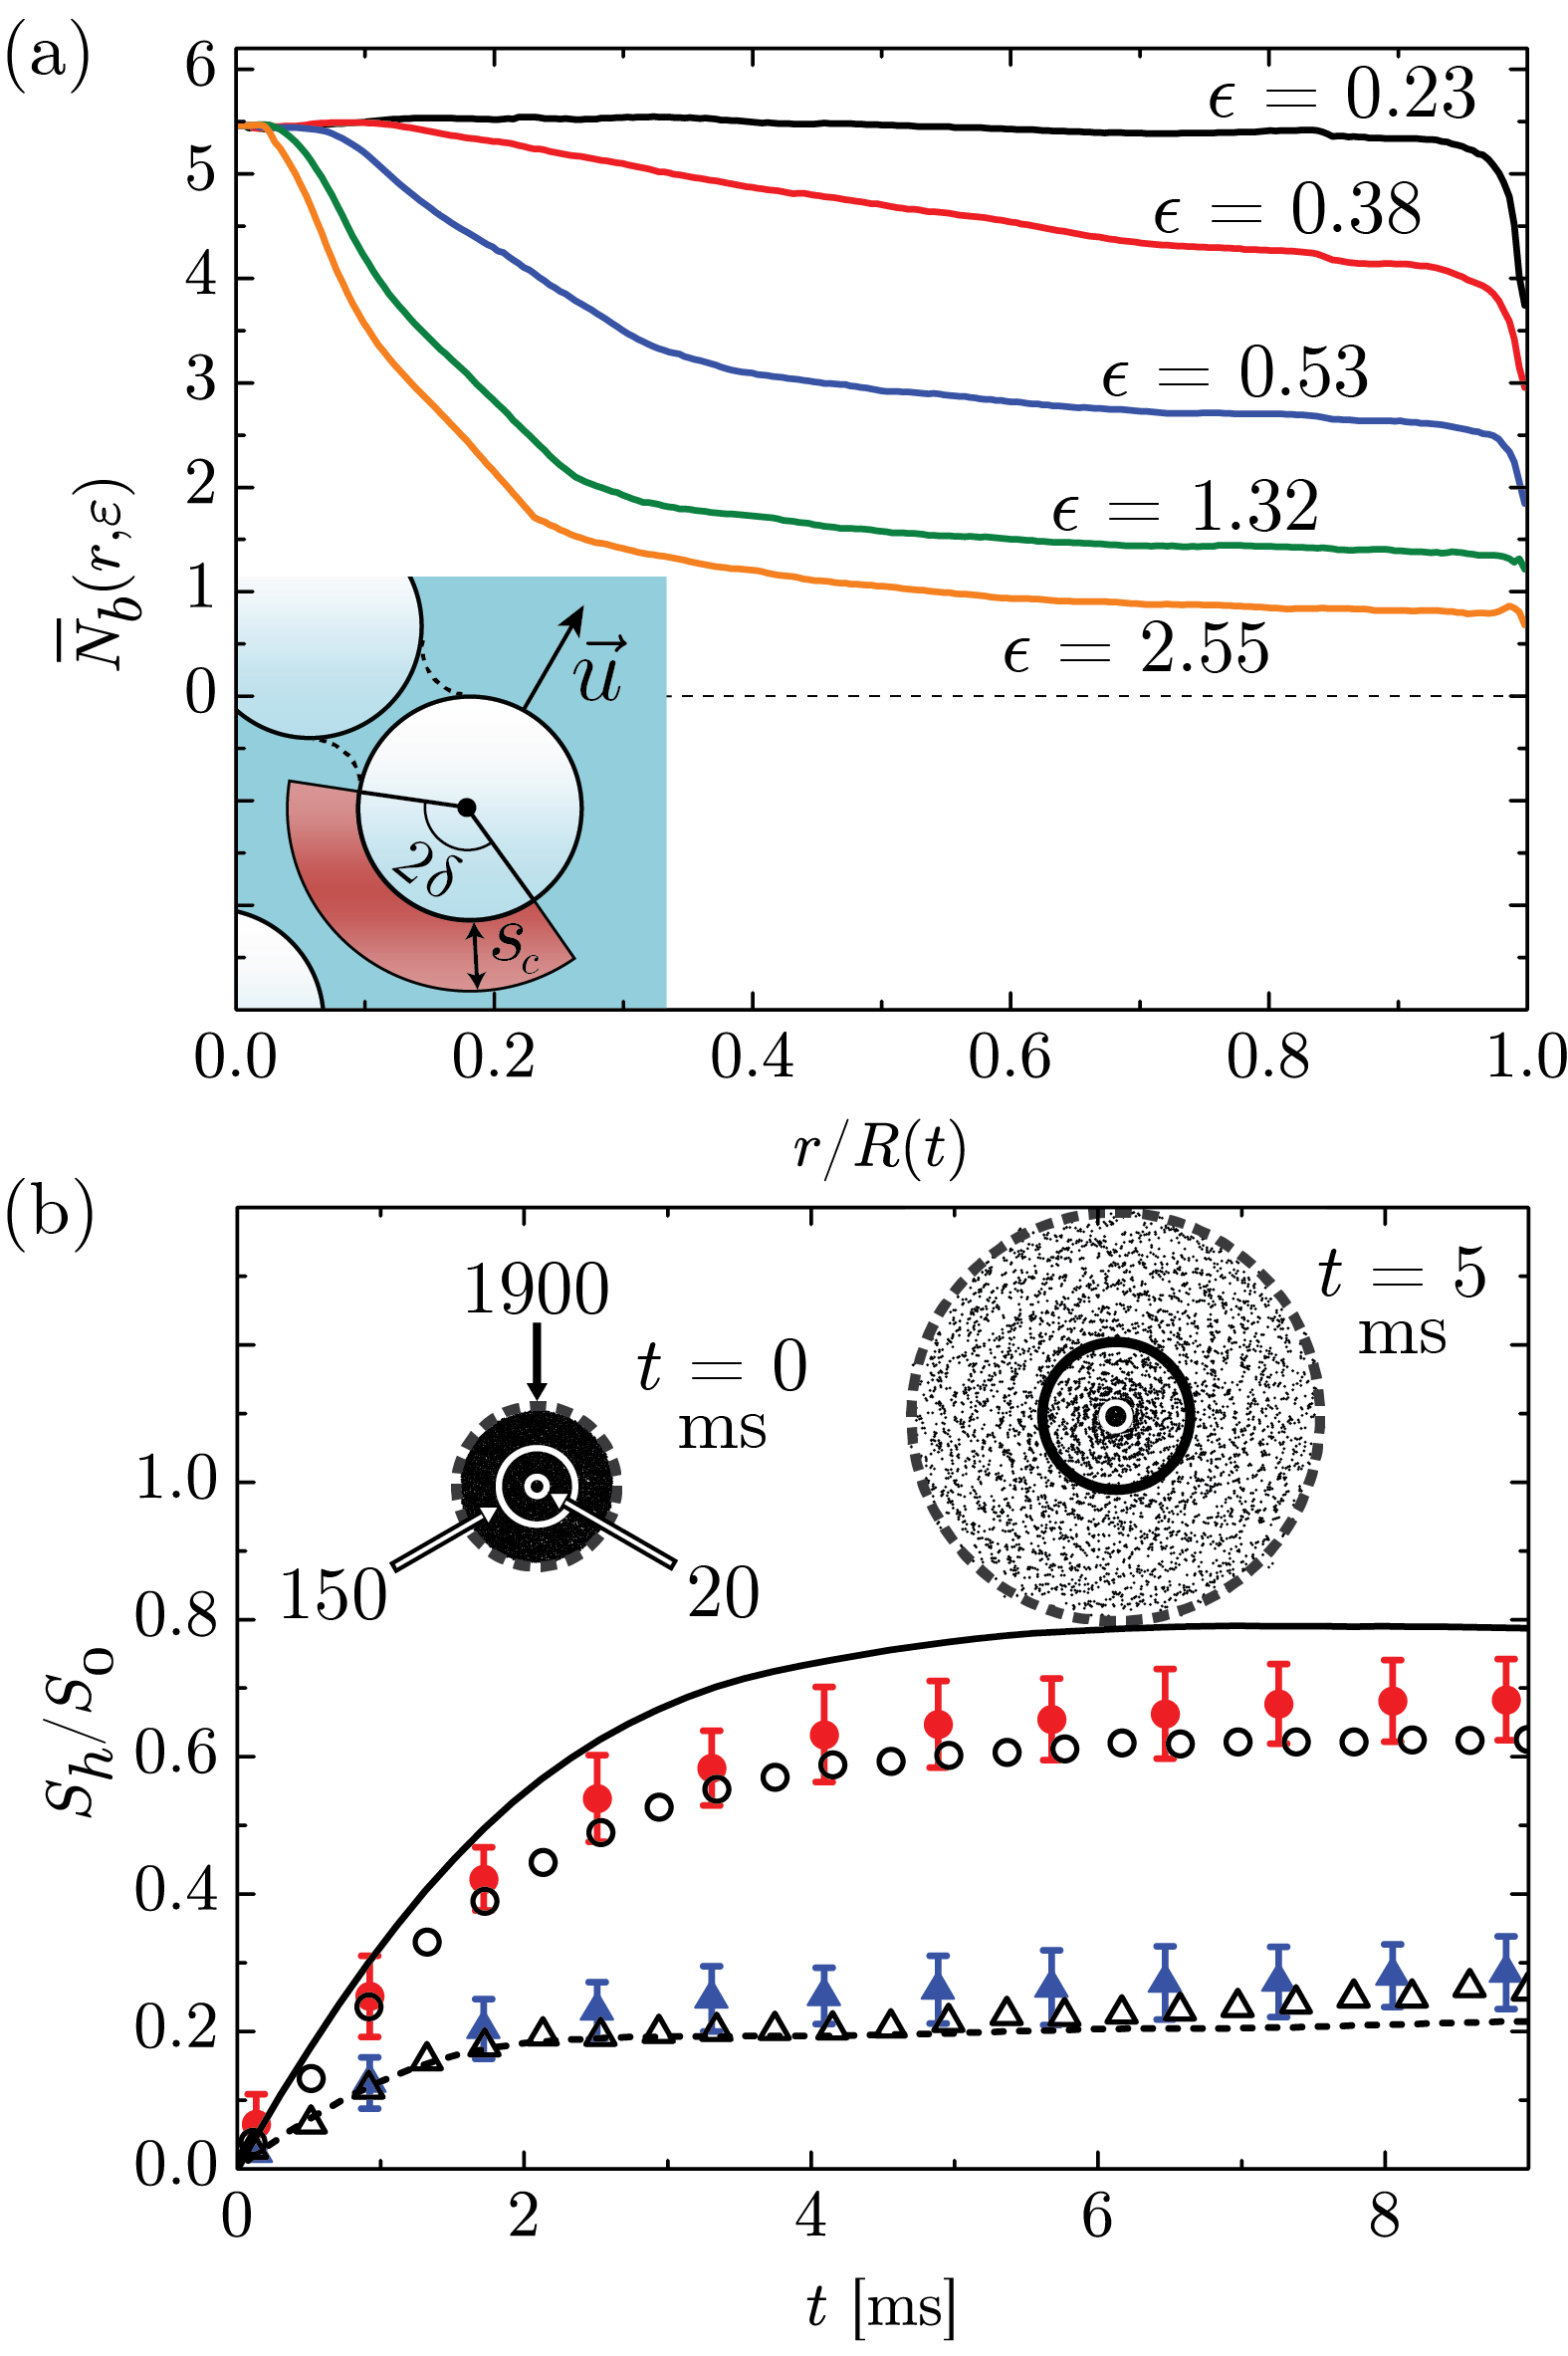
We next refine the chain model by going to 2D by prescribing the same but generalizing and (inset to Fig. 4(a) and sup ) to include capillary interactions with all nearest neighbors, not only those along a radial direction. The inset in Fig. 4(b) shows two snapshots from the simulation: initially the splat is so densely packed that it appears uniformly black. As the expansion proceeds, voids appear and grow, with the growth rate being faster in the outer regions. In Fig. 4(b) we also plot the void area fraction calculated from the simulation. Including the interaction with azimuthal neighbors allows the 2D simulation to track the initial void growth rate more accurately than the chain model. This results in a noticeably better fit to the measured evolution.
The simulation also allows us to test our starting assumption that the radial expansion causes the particle dynamics in the monolayer splat to be decoupled, thereby rendering the splat evolution simple. In Fig. 4(a) we plot , the average number of nearest neighbors experiencing cohesive capillary interaction, as a function of normalized radial distance. The different curves correspond to different radial strain , with the radius of the dead zone. This quantity is difficult to extract from the experiment but gives direct insight into the degree of collective interactions present. Initially particles everywhere in the splat are densely packed and have on average neighbors. As the radial expansion proceeds and the radial strain grows large, many particles lose cohesive capillary interactions with nearest neighbors, particularly those along the azimuthal direction. This effect is most pronounced near the outer edge, where the expansion speed is the largest. Finally, as the monolayer splat expansion slows, a large outer area in the splat are occupied by particles experiencing one cohesive capillary bond on average.
Conclusions—
We report a novel outcome of dense suspension impact onto a smooth solid: the formation of a monolayer splat. Using experiments and minimal numerical models, we analyze the splat expansion and instability dynamics. The quantitative agreement between measurements and model results demonstrate that particle inertia dominates both processes. In this and regime, the detailed forms of surface wetting, capillarity and viscous drag have little effect on either the expansion or the instability. This is also a regime relevant for many technologically relevant applications Fukumoto and Huang (1999); Seerden et al. (2004); Derby (2011); Qi et al. (2011). The high impact speeds used in these processes ensure that particle inertia remains important despite the smaller particles used. Understanding the mechanism responsible for monolayer formation raise more complex questions such as how impact destroys 3D particles clusters, or whether a qualitatively different dynamic appears at lower volume fractions due to long-range viscous flow coupling Ward et al. (2009); Timberlake and Morris (2005); Colosqui et al. (2013); Guazzelli and Hinch (2011). The monolayer spreading dynamics elucidated here provides a particularly simple, yet solid, starting point for tackling these issues. This is because the inertia-dominated expansion rapidly switches off capillary and viscous interactions between neighboring particles, thus making it possible to model and predict the spreading dynamics without having to resolve the considerable complication of suspension rheology Stickel and Powell (2005); Lerner et al. (2012); Brader et al. (2008); Bonnoit et al. (2010); Mewis and Wagner (2009); Boyer et al. (2011); Koos and Willenbacher (2011); Brown and Jaeger (2012).
Acknowledgements—
Acknowledgements.
We thank I.R. Peters and M.Z. Miskin for discussions. We also thank D. Lohse and J.H. Snoeijer for bringing Chicago and Enschede together. This work was supported by NSF through its MRSEC program (DMR-0820054) and fluid dynamics program (CBET-1336489).References
- Worthington (1876) A. Worthington, Proc. R. Soc. A 25, 261 (1876).
- Rein (1993) M. Rein, Fluid Dyn. Res. 12, 61 (1993).
- Marengo et al. (2011) M. Marengo, C. Antonini, I. V. Roisman, and C. Tropea, Curr. Opinion in Colloid Inter. Sci. 16, 292 (2011).
- Clanet et al. (2004) C. Clanet, C. Béguin, D. Richard, D. Quéré, et al., J. Fluid Mech. 517, 199 (2004).
- Peters et al. (2013) I. R. Peters, Q. Xu, and H. M. Jaeger, Phys. Rev. Lett. 111, 028301 (2013).
- de Jong et al. (2007) J. de Jong, H. Reinten, H. Wijshoff, M. van den Berg, K. Delescen, R. van Dongen, F. Mugele, M. Versluis, and D. Lohse, Appl. Phys. Lett. 91, 204102 (2007).
- Hu and Larson (2006) H. Hu and R. G. Larson, J. Phys. Chem. B 110, 7090 (2006).
- Nikolov et al. (2002) A. D. Nikolov, D. T. Wasan, A. Chengara, K. Koczo, G. A. Policello, and I. Kolossvary, Adv. Colloid Interface Sci. 96, 325 (2002).
- Nicolas (2005) M. Nicolas, J. Fluid Mech. 545, 271 (2005).
- (10) See the experimental movie.
- Qi et al. (2011) L. Qi, P. H. McMurry, D. J. Norris, and S. L. Girshick, Langmuir 27, 12677 (2011).
- Fukumoto and Huang (1999) M. Fukumoto and Y. Huang, J. Thermal Spray Tech. 8, 427 (1999).
- Seerden et al. (2004) K. A. Seerden, N. Reis, J. R. Evans, P. S. Grant, J. W. Halloran, and B. Derby, J. Am. Ceram. Soc. 84, 2514 (2004).
- Derby (2011) B. Derby, J. Eur. Ceram. Soc. 31, 2543 (2011).
- Miskin and Jaeger (2012) Z. Miskin and H. M. Jaeger, Proc. Natl. Acad. Sci. 109, 4389 (2012).
- Bertrand et al. (2012) T. Bertrand, C. Bonnoit, E. Clément, and A. Lindner, Granul. Matter 14, 169 (2012).
- Yarin and Weiss (1995) A. Yarin and D. Weiss, J. Fluid Mech. 283, 141 (1995).
- (18) The value of is insensitive to the contact line dynamics. Impacts using plugs suspended in silicone oil show the same expansion dynamics as those suspended in water even though oil wets the dry glass substrate but water does not. This insensitivity arises because the region of the liquid surface affected by the substrate wetting properties corresponds to a very small portion of the full area when the liquid motion Weber number are large and .
- (19) See the details in the Supplemental Material.
- Note (1) Varying by 10% still allows a fit within the error bar range of experiments.
- Vella and Mahadevan (2005) D. Vella and L. Mahadevan, Am. J. Phys. 73, 817 (2005).
- Herminghaus (2005) S. Herminghaus, Adv. Phys. 54, 221 (2005).
- Ward et al. (2009) T. Ward, C. Wey, R. Glidden, A. E. Hosoi, and A. Bertozzi, Phys. Fluids 21, 083305 (2009).
- Timberlake and Morris (2005) B. D. Timberlake and J. F. Morris, J. Fluid Mech. 538, 309 (2005).
- Colosqui et al. (2013) C. E. Colosqui, J. F. Morris, and H. A. Stone, Phys. Rev. Lett. 110, 188302 (2013).
- Guazzelli and Hinch (2011) É. Guazzelli and J. Hinch, Annu. Rev. Fluid Mech. 43, 97 (2011).
- Stickel and Powell (2005) J. J. Stickel and R. L. Powell, Annu. Rev. Fluid Mech. 37, 129 (2005).
- Lerner et al. (2012) E. Lerner, G. Düring, and M. Wyart, Proc. Natl. Acad. Sci. 109, 4798 (2012).
- Brader et al. (2008) J. Brader, M. Cates, and M. Fuchs, Phys. Rev. Lett. 101, 138301 (2008).
- Bonnoit et al. (2010) C. Bonnoit, J. Lanuza, A. Lindner, and E. Clement, Phys. Rev. Lett. 105, 108302 (2010).
- Mewis and Wagner (2009) J. Mewis and N. J. Wagner, J. Non-Newton. Fluid Mech. 157, 147 (2009).
- Boyer et al. (2011) F. Boyer, É. Guazzelli, and O. Pouliquen, Phys. Rev. Lett. 107, 188301 (2011).
- Koos and Willenbacher (2011) E. Koos and N. Willenbacher, Science 331, 897 (2011).
- Brown and Jaeger (2012) E. Brown and H. M. Jaeger, J. Rheol. 56, 875 (2012).