Nanophotonic Luminescent Solar Concentrators
Abstract
We investigate the connection between photonic local density of states and luminescent solar concentrator (LSC) performance in two manufacturable nanocavity LSC structures, a bilayer slab and a slab photonic crystal. Finite-difference time-domain electromagnetic simulations show that the waveguided luminescence photon flux can be enhanced up to 30% for the photonic crystal design over a conventional LSC operating in the ray optic limit assuming the same number of excited lumophores. Further photonic engineering could realize an increase of up to one order of magnitude in the flux of waveguided luminescence.
The luminescent solar concentrator (LSC) could decrease the installed cost of solar energy through building integration Debije and Verbunt (2011). The LSC, a semi-transparent waveguide with embedded lumophores, concentrates sunlight by frequency downconversion; the lumophores absorb diffuse incident sunlight and luminesce at a redder, Stokes-shifted wavelength. The majority of the luminescence is emitted into modes that can be guided by total internal reflection (TIR) to the waveguide edges, upon which small-area, high efficiency solar cells are normally fastened.
Despite the LSC’s simplicity, the concept has not been commercialized due to low performance. Experimental realizations have demonstrated a twelve-fold concentration of solar flux Currie et al. (2008) and power conversion efficiency of 7.2%, well below the theoretical predictions of a flux concentration in excess of 100 Smestad et al. (1990) and power conversion efficiency of 26.8% Markvart (2006). Reabsorption of luminescence and subsequent re-emission into non-waveguided modes has been identified as the primary performance bottleneck Batchelder et al. (1979); Debije et al. (2008); Olson et al. (1981); Weber and Lambe (1976); Wilson et al. (2010).
While prior work has demonstrated that LSCs consisting of lumophores embedded in optical nanocavities exhibit enhanced waveguiding Gutmann et al. (2012) and reduced reabsorption Giebink et al. (2011), the nanocavity modifies the photonic local density of states (LDOS) and therefore the spatial and temporal luminescence distributations John (1987); Yablonovitch (1987). Here, we investigate the effect of the modified LDOS on LSC performance using first-principles simulations of Maxwell’s equations in two realistic nanocavity LSC designs (Fig. 1, insets). After establishing a link between photonic LDOS and LSC performance, we use finite difference time domain (FDTD) simulations to show that a nanocavity LSC can increase the flux of waveguided luminescence photons by up to 30% over a conventional LSC. Finally, we assess the maximum theoretical performance gains from LDOS engineering in the LSC.
First, we define a metric of LSC performance, connect the performance metric to the photonic LDOS, and determine the conditions under which LSC performance comparisons can be made on the basis of the photonic LDOS. Luminescence photons are spontaneously emitted into one of many photonic modes of the LSC. These can be divided into two groups based on the wavevector in the LSC plane (): non-waveguided () and total internally reflected (TIR, ) modes. In conventional LSCs, lumophore-filled waveguides of refractive index much thicker than the luminescence wavelength, the fraction
| (1) |
of photonic modes corresponds to TIR modes Debije and Verbunt (2011). According to ray tracing simulations, photons emitted into non-waveguided modes are lost into air after multiple reflections Batchelder et al. (1979). Thus, our analysis assumes that only luminescence photons emitted into TIR modes can be collected by the solar cells attached to the LSC edges.
Assuming the lumophore has unity quantum yield and the LSC surfaces are smooth, a photon emitted into a TIR mode can either be re-absorbed by the lumophore or absorbed by the solar cells affixed to the LSC edges Yablonovitch (1980); Markvart (2006). Starting from the quantum optical master equation for a single, lossy photonic mode weakly coupled to a lumophore, we derive a recursion relation for the occupation probability () of a -photon Fock state sup
| (2) | |||||
Here, and are the photon emission and absorption rates from Fermi’s Golden Rule Abraham and Smith (1977), and is the rate at which photons leak out of the photonic mode Breuer and Petruccione (2007), which, in the case of the LSC, we assume is the rate at which luminescence photons are collected by solar cells affixed to the LSC edges.
The solution to Eq. 2 is a geometric series sup , and the steady-state rate at which photons are collected by the attached solar cells from a single TIR mode is
| (3) |
Eq. 3 is the emission rate divided by the sum of the reabsorption and collection rates minus the emission rate. If photons are extracted by the solar cells much faster than they can be reabsorbed (), then Eq. 3 can be further simplified such that the photon collection rate for a single mode is then equal to the emission rate, .
Experimentally, this regime corresponds to either small LSCs or LSCs containing lumophores with small reabsorption, which has been demonstrated by exploiting Förster resonant energy transfer or intersystem crossing Currie et al. (2008). Eq. 3 must be summed over all wavevectors corresponding to TIR modes () to find the total flux collected by attached solar cells at each frequency. In this operation regime, LSCs with the same species and number of excited lumophores can be directly compared on the basis of TIR LDOS sup . Here, we compare TIR LDOS in different LSC designs: a “conventional” LSC comprised of lumophores dispersed in a thick dielectric waveguide and two different nanophotonic LSCs with lumophores embedded in a nanocavity.
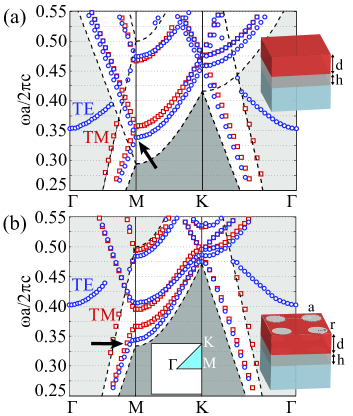
We calculate the photonic LDOS for two realistic nanocavity LSC designs, each with a waveguide core comprised of the organic lumophore DCM2-doped Alq3 () and a fluoropolymer () waveguide cladding. The nanocavity formed by the air-core-cladding layers is coupled to the underlying waveguide-substrate for transport of luminescence to attached solar cells. In the bilayer slab LSC (Fig. 1a, inset), the waveguide is coupled through the cladding layer to the underlying flint glass () substrate-waveguide Giebink et al. (2011). The second design, a slab photonic crystal (PC) LSC (Fig. 1b, inset) has the same dimensions as the bilayer slab but contains a square lattice of air holes extruded through the core and cladding layers. Since the air holes decrease the core’s average refractive index, the substrate-waveguide refractive index is reduced to that of crown glass (), which would reduce material costs.
The photonic LDOS in three dimensions for each structure is computed using a freely available finite-difference time-domain (FDTD) software package Oskooi et al. (2010). The FDTD method is chosen because the LDOS can be calculated over a broad frequency range in a single simulation Koenderink et al. (2006). To simulate an infinite periodic photonic crystal, Bloch periodic boundary conditions in the in-plane directions and absorbing boundary conditions in the vertical directions are selected. In order to calculate the LDOS, the electric field transient is recorded at a point after excitation by a point broadband Gaussian current source () at that same location. The Fourier transform of the electric field transient normalized by the excitation pulse spectrum yields the photonic local density of states for a given location and source orientation Oskooi and Johnson (2013)
| (4) |
Since the LDOS depends on the dipole location and orientation Lee et al. (2000), LDOS calculations are carried out for thirty randomly selected locations within the waveguide core volume, three Cartesian dipole orientations, and for 2401 wavevectors in a rectangular mesh spanning the irreducible Brillouin zone of the square lattice. Further details explaining the FDTD simulations, k-space integration, and LDOS normalization are found in the supplementary material sup .
Fig. 1 displays the simulated band structures, taken from local maxima in the LDOS, as a function of in-plane wavevector (). The blue circles and red squares indicate TE-like () and TM-like () modes, respectively. The white region corresponds to generalized TIR modes in the substrate-waveguide Joannopoulos et al. (2008). Luminescence emitted into these modes can be transported within the lumophore-free substrate-waveguide to the attached solar cells.
The simulated dimensions, , , and , while not optimized, are selected to satisfy several criteria. Comparing the two bandstructures, we see that the PC-LSC’s discrete translational symmetry splits the TE- and TM-like guided photonic bands at the -point in the band structure (black arrow). To enhance emission into TIR modes, the PC-LSC dimensions are chosen such that the lumophore photoluminescence spectrum overlaps with Van Hove singularities for the dielectric (valence) bands residing in the white generalized TIR region. Van Hove singularities occur at saddle points in the dispersion relation (here, the -point) and result in peaks in the photonic DOS Busch and John (1998); Joannopoulos et al. (2008). Finally, modes below the light line in the substrate-waveguide (dark gray) should be eliminated so that luminescence is not trapped in the nanocavity. These design considerations are opposite to those previously proposed for enhancement of light extraction in light-emitting diodes Boroditsky et al. (1999); Fan et al. (1997).
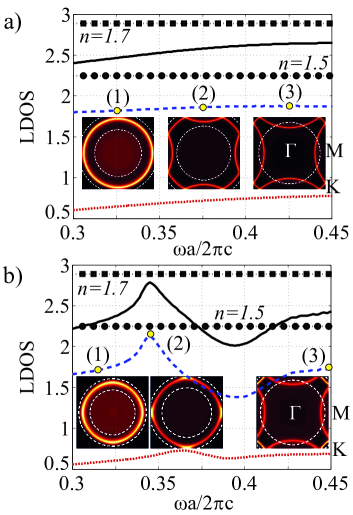
Fig. 2 compares the total simulated LDOS normalized to the total vacuum LDOS. The reference cases are conventional LSCs in which the lumophores are dispersed in a glass substrate that is much thicker than the wavelength of the emitted light. The bilayer slab (Fig.2a) LDOS is approximately 80% of the conventional LSC, consistent with previous experimental and theoretical work on dielectric slabs Urbach and Rikken (1998). The PC-LSC LDOS (Fig.2b) falls between that of and conventional LSCs, but does not exceed the conventional LSC Boroditsky et al. (1999). The TE-like (blue) and TM-like (red) contributions to the total LDOS confirm that the LDOS enhancement lies at the Van Hove singularity corresponding to the -point (Fig. 2b). Finally, in the PC-LSC design, spontaneous emission is inhibited between and 0.41 in the PC-LSC; fewer photons are emitted in the region of strongest overlap between lumophore absorption and luminescence spectra.
The insets in Fig. 2 provide visual confirmation that the embedment of lumophores in nanocavities results in directional spontaneous emission distributions. The concentric white dashed circles indicate the light lines in air and in the substrate. Luminescence emitted between these two circles is waveguided by generalized TIR. In both nanocavity LSC designs, a ring corresponding to a single guided TE mode increases in size with frequency and is eventually folded about the band edges due to the Bloch periodic boundary conditions. Since the bilayer LSC has continuous translational symmetry, the folding has no bearing on LSC performance. The folding in the PC-LSC, on the other hand, begins to decrease the TIR LDOS starting at , where the second band crosses the light line in air (Fig. 1b). However, through the choice of a larger lattice constant, the strong dielectric band emission at at the -point can be utilized to increase the TIR LDOS. By integrating these partial LDOS distributions between the two light lines, we compute the TIR LDOS for each structure.
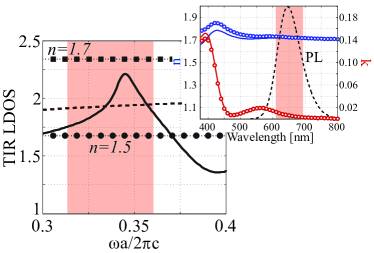
Fig. 3 compares the TIR LDOS for the nanocavity LSCs with those of conventional LSCs. The nanocavity LSCs are compared to conventional LSCs with the same substrate refractive index. The bilayer LSC’s TIR LDOS is 15% less than that of the reference. The PC-LSC TIR LDOS exceeds that of a conventional LSC with by up to 31% at the -point. We choose the lattice constant nm, which maximizes the product of the TIR LDOS with the Alq3:DCM2 photoluminescence spectrum (inset) when integrated over the luminescence photon frequency. For this choice of (pink squares), the PC-LSC demonstrates a modest 10% increase in the waveguided luminescent photon flux over the conventional LSC.
The maximum TIR LDOS enhancement of spontaneous emission is limited by lumophore photoluminescence spectrum linewidth () to Boroditsky et al. (1999). LSC lumophore -factors range from three to seven for organics (Fig. 3, inset) to thirty for state-of-the-art colloidal semicondutor quantum dots Chen et al. (2013). Thus, the maximum TIR LDOS enhancment is approximately ten.
In conclusion, we calculated the detailed spatial and spectral luminescence distributions for two nanophotonic LSC designs, which are chosen based on past work as well as manfuacturability considerations Yokoo et al. (2003). Although the directional luminescence distributions are desirable for minimizing reabsorption losses Giebink et al. (2011), both the total and waveguided spontaneous emission rates are less than the bulk rate for the waveguide core material. By patterning the waveguide core into a photonic crystal, we find that the spontaneous emission rate into guided modes of the bulk material can be recovered by utilizing dielectric band edge emission in the photonic crystal. The inhibition of the total spontaneous emission rate in a photonic crystal could be further exploited to reduce reabsorption losses in the large LSC limit.
I Acknowledgements
This research was supported by the Swiss National Science Foundation through the National Centre of Competence in Research Quantum Science and Technology and by ETH Research Grant ETH-42 12-2. The authors would like to thank Atac Imamoğlu, Christian Hafner, the Computational Optics group at ETH, and Deniz Bozyigit for helpful discussions.
References
- Debije and Verbunt (2011) M. Debije and P. Verbunt, Advanced Energy Materials pp. 12–35 (2011).
- Currie et al. (2008) M. Currie, J. Mapel, T. Heidel, S. Goffri, and M. Baldo, Science 321, 226 (2008).
- Smestad et al. (1990) G. Smestad, H. Ries, R. Winston, and E. Yablonovitch, Solar Energy Materials 21, 99 (1990).
- Markvart (2006) T. Markvart, Journal of Applied Physics 99, 026101 (2006).
- Batchelder et al. (1979) J. Batchelder, A. Zewail, and T. Cole, Applied Optics 18, 3090 (1979).
- Debije et al. (2008) M. Debije, P. Verbunt, B. Rowan, B. Richards, and T. Hoeks, Applied Optics 47, 6763 (2008).
- Olson et al. (1981) R. Olson, R. Loring, and M. Fayer, Applied Optics 20, 2934 (1981).
- Weber and Lambe (1976) W. Weber and J. Lambe, Applied Optics 15, 3 (1976).
- Wilson et al. (2010) L. Wilson, B. Rowan, N. Robertson, O. Moudam, A. Jones, and B. Richards, Applied Optics 49, 1651 (2010).
- Gutmann et al. (2012) J. Gutmann, M. Peters, B. Bläsi, M. Hermle, H. Zappe, and J. Goldschmidt, Optics Express 20, 2811 (2012).
- Giebink et al. (2011) N. Giebink, G. Wiederrecht, and M. Wasielewski, Nature Photonics 5, 694 (2011).
- John (1987) S. John, Physical Review Letters 58 (1987).
- Yablonovitch (1987) E. Yablonovitch, Physical Review Letters 58, 2059 (1987).
- Yablonovitch (1980) E. Yablonovitch, Journal of the Optical Society of America 70, 1362 (1980).
- (15) See supplementary material at URL for details on calculations and FDTD simulations.
- Abraham and Smith (1977) N. Abraham and S. Smith, Physical Review A 15, 421 (1977).
- Breuer and Petruccione (2007) H. Breuer and F. Petruccione, The Theory of Open Quantum Systems (Oxford University Press, 2007).
- Oskooi et al. (2010) A. F. Oskooi, D. Roundy, M. Ibanescu, P. Bermel, J. Joannopoulos, and S. G. Johnson, Computer Physics Communications 181, 687 (2010).
- Koenderink et al. (2006) A. Koenderink, M. Kafesaki, C. Soukoulis, and V. Sandoghdar, Journal of the Optical Society of America B 23, 1196 (2006).
- Oskooi and Johnson (2013) A. Oskooi and S. Johnson, Advances in Computational Electrodynamics: Photonics and Nanotechnology (Artech House, 2013).
- Lee et al. (2000) R. K. Lee, Y. Xu, and A. Yariv, Journal of the Optical Society of America B 17, 1438 (2000).
- Joannopoulos et al. (2008) J. Joannopoulos, S. Johnson, J. Winn, and R. Meade, Photonic Crystals: Modeling the Flow of Light (Princeton University Press, Princeton, NJ, 2008), 2nd ed.
- Busch and John (1998) K. Busch and S. John, Physical Review E 58, 3896 (1998).
- Boroditsky et al. (1999) M. Boroditsky, R. Vrijen, T. Krauss, R. Coccioli, R. Bhat, and E. Yablonovitch, Journal of Lightwave Technology 17, 2096 2112 (1999).
- Fan et al. (1997) S. Fan, P. Villeneuve, J. Joannopoulos, and E. Schubert, Physical Review Letters 78, 3294 (1997).
- Urbach and Rikken (1998) H. Urbach and G. Rikken, Physical Review A 57, 3913 (1998).
- Chen et al. (2013) O. Chen, J. Zhao, V. Chauhan, J. Cui, C. Wong, D. Harris, H. Wei, H. Han, D. Fukumura, R. Jain, et al., Nature Materials 12, 1 7 (2013).
- Yokoo et al. (2003) A. Yokoo, H. Suzuki, and M. Notomi, in Microprocesses and Nanotechnology Conference (2003), pp. 54–55.