eurm10 \checkfontmsam10 \pagerange
Dynamics of line plumes on horizontal surfaces in turbulent convection
Abstract
We study the dynamics of line plumes on the bottom plate in turbulent convection over six decades of Rayleigh number and two decades of Prandtl number . From the visualisations of these plumes in a horizontal plane close to the plate, we qualitatively identify the main dynamics as motion along the plumes, lateral merging of the plumes and initiation of the plumes; various other minor types of motion also occur along with these main dynamics. The mean velocity along the length of the plumes scales as the large scale flow velocity, with the fraction of the length of the plumes affected by shear increasing with as . In agreement with Howard (1964), the mean time of initiation of the plumes , scales as the diffusive time scale near the plate, , where is the appropriate length scale near the plate. Merging occurs in a large fraction of the area of the plate, with about 70% of the length of the plumes undergoing merging at and . The fraction of the length of the plumes that undergoes merging decreases with increase in as, ; the exponents of and being of the same magnitude but of opposite sign as that in the relation for . Measurements of the velocities of merging of the plumes show that they merge with a constant velocity during their merging cycle. However, the values of these constant velocities depend on the location and the time of measurement, since the merging velocities are affected by the local shear. The merging velocities at all and have a common lognormal distribution, but their mean and variance increased with increasing and decreasing . We quantify the dependence of the mean merging velocities on and , using mass and momentum balance of the region between two merging plumes. , which are an order lower than the large scale velocities, scale as the average entrainment velocity at the sides of the plumes. This implies that scales as the velocity scale near the plate . , the Reynolds number interms of and the layer height scales as , in the same way as the Nusselt number ; therefore . These relations imply that the Reynolds number near the plate is an invariant for a given fluid in turbulent convection.
1 Introduction
In turbulent natural convection over horizontal hot surfaces, rising sheets of fluid near the plate show complex dynamics of forming and merging, while being also sheared by the large scale flow. Since these ‘line plumes’ transport the major portion of the heat from the plate to the bulk, understanding this dynamics is important to clarify the phenomenology of flux scaling; improving many technological applications of convection also depend on such an understanding. In addition, the dynamics of these plumes strongly influence the velocity and temperature fields near the plate, whose phenomenology is still not clear. In spite of such importance, the dynamics of these plumes on the horizontal plate have rarely been investigated quantitatively. In the present work we quantify various aspects of the dynamics of line plumes on the bottom horizontal surface in turbulent convection and then propose scaling laws for the predominant dynamics.
Line plumes are formed from the gravitational instabilityPera & Gebhart (1973) of the thin layer of lighter fluid that forms on the hot horizontal plate. Once these line plumes are formed, they rise as sheets while being fed by the local natural convection boundary layers on both sides of the sheets, at the same time moving laterally and merging. After a short distance of rise, they break up into axisymmetric plumes/thermals at heights of the order of 10 times the thermal boundary layer thicknessZhou & Xia (2010). Line plumes hence collect the fluid near the plate and transport it into the bulk through the ejection of thermals. Motions in the bulk group these thermals; the resultant column of light fluid drives a coherent large scale flow in the bulk. The large scale flow in turn creates a shear near the plate that affects the organisation of these line plumes; the shear also possibly modifies the local natural convection boundary layers on either side of the line plumes Puthenveettil & Arakeri (2005). In the top views of these near-plate coherent structures, at any instant, a complex pattern of lines is seen due to the combined effect of the spatial nature of the boundary layer instability, the spatially varying external shear due to the large scale flow and, more importantly, due to the interaction between these line plumes.
Such complex plume structures, look geometrically quite different at different Rayleigh numbers () and Prandtl numbers (), and have their mean and integral properties strongly dependent on and . Here, and , with being the acceleration due to gravity, the coefficient of thermal expansion, the temperature difference across the fluid layer, the height of the fluid layer, the kinematic viscosity and the thermal diffusivity with the thermal conductivity, the density and the specific heat at constant pressure. To describe the phenomena near the plate it is also convenient to define a Rayleigh number based on the temperature drop near the plate , as
| (1) |
At high , since , . One of the mean properties of these plume structures at any instant, the mean plume spacing , was shown to be proportional to,
| (2) |
the appropriate length scale obtained by a balance of buoyant and diffusive processes near the plate Theerthan & Arakeri (1998); Puthenveettil & Arakeri (2005). Dependence of other mean geometric properties of these line plumes on have also been obtained empirically by Zhou & Xia (2010). Puthenveettil et al. (2011), herein after referred as PA11, obtained relations for an integral property of these plume structures viz. the total length , under similar assumption that natural convection boundary layers, or equivalently line plumes that are an outcome of these boundary layers, carry most of the heat from the plate to the bulk. The plume lengths per unit area for any given fluid; a similar dependence were also observed by Bosbach et al. (2012), eventhough they interpreted it differently. This result also implied that , the Nusselt number; , where is the heat flux.
Even though the mean and the integral properties of the plume structures are strong functions of and , the statistical distributions of the properties of these structures are not. Puthenveettil & Arakeri (2005) found that the probability distribution function (pdf) of the spacings between these line plumes showed a common log-normal form at different and ; Haramina & Tilgner (2004) have tried to explain such a distribution. A similar common log-normal distribution has been found for other geometric properties of these line plumes by Zhou & Xia (2010). These plume structures also had a common multifractal spectrum associated with them over a decade of Puthenveettil, Ananthakrishna & Arakeri (2005), implying that the probability of occurrence of the line plumes in any area of the planform is independent of . The common form of the pdfs observed by various researchers and the common multifractal spectrum point towards some commonality in the underlying dynamics by which these structures are formed.
Spangenberg & Rowland (1961) was the first to qualitatively describe the dynamics of these structures at the free surface in evaporative convection; they identified the transient nature of forming, random motion and plunging down of line plumes. Husar & Sparrow (1968) also made similar qualitative observations while studying the patterns of line plumes on a hot horizontal plate with no side walls. The first quantitative measurements of the horizontal velocities of these line plumes on the bottom plate, which they considered as waves on the viscous boundary layer, was by Zocchi et al. (1990). In their visualisations, the line plumes mostly moved lateral to their length, in the direction of the large scale flow; the velocity distribution was asymmetric with a long tail, whose peak was approximately same as the velocity of the large scale flow. Recently, Hogg & Ahlers (2013) have estimated the mean and fluctuating horizontal velocities in the convection cell using spatial correlation of shadowgraph images obtained from the top view of the cell. Since plumes near the plate are the predominant structures seen in such images, the obtained velocities are mostly the plume velocities. Hogg & Ahlers (2013) obtained the scaling of the mean and the fluctuating velocity to be the same as that of the large scale flow. The magnitude of the mean velocities were two orders lower than that of the bulk flow while the magnitude of fluctuating velocities were of the same order as that of the bulk flow.
Most of the above investigations of the dynamics of these line plumes on the plate have been qualitative. The few quantitative investigations fail to describe the whole gamut of motions and identify the predominant dynamics as that of the large scale flow. However, as described above, the line plumes have various other motions other than that due to the large scale flow alone. To the best of our knowledge, details of the dynamics of line plumes on the hot plate in turbulent convection are still unexplored. There is no information available about the various types of motion, the predominant ones from these types, the relative magnitude of the predominant motions with the other velocity scales in turbulent convection and the scaling of the predominant motions with and . The motion of these line plumes, that have a higher temperature than in the bulk, contribute to the velocity and temperature profiles near the plate in turbulent convection. Since various theoretical expressions for these profiles have been proposed by Theerthan & Arakeri (1998), Shishkina & Thess (2009) and Ahlers et al. (2012), understanding the quantitative details of the dynamics of line plumes is crucial to understand the origin of the profiles of temperature and velocity near the plate. Such profiles near the plate, based on realistic phenomenology of the dynamics near the plate, could result in better wall functions for modelling turbulent convection computationally. More importantly, since line plumes transport most of the heat from the plate Shishkina & Wagner (2008), understanding the dynamics of these structures is necessary to clarify the phenomenology of heat transport in turbulent convection. Such knowledge will also be of great use in applications that use natural convection heat transport like electronic cooling, materials processing and atmospheric modelling.
In this paper, we study the dynamics of line plumes on the bottom plate in turbulent convection over horizontal surfaces. Three experimental setups that use air (), water ( 3.6 to 5.3) and concentration driven convection in water (), are used to achieve a wide range of and Rayleigh numbers (). Movies of the evolution of the line plume structure with time in a horizontal plane grazing the bottom plate are captured using laser scattering by particles, electrochemical visualisation and planar laser induced fluorescence (PLIF) for the three respectively. After identifying the predominant types of motion from the visualisations as shear, initiation and merging of plumes, we find scaling laws for the mean shear velocities and the initiation times. We then focus on describing the mean and statistics of the merging velocities before proposing scaling laws for the dependence of merging velocities on and .
The paper is organised as follows. After a description of the experimental setups used for the three in § 2, we give a qualitative description of the various types of motion observed on the plate in § 3. In § 4 we describe the methodology of our measurements while the results of these measurements are discussed in § 5. We describe the scaling of longitudinal velocities in § 5.1 and the scaling of initiation times in § 5.2. The rest of the paper focuses on the dynamics of merging of plumes with § 5.3.1 showing that merging occurs in a large fraction of the total plume length. § 5.3.2 finds that the plumes merge with constant velocities; the statistics of merging velocities are the discussed in § 5.3.3. Based on the variation of the mean merging velocities described in § 5.3.4, we develop a theory for the scaling of mean merging velocities in § 6. The scaling laws for the mean merging velocities and the verification of these laws with our experiments are described in § 6.4, before we conclude in § 7.
2 Experiments
The dynamics of plume structures near the plate were obtained from top view images in experiments conducted at to and for ranging from to . We briefly discuss the details of the setups and the procedure used for the conduct of these experiments in this section; details could be found in Gunasegarane (2013).
2.1
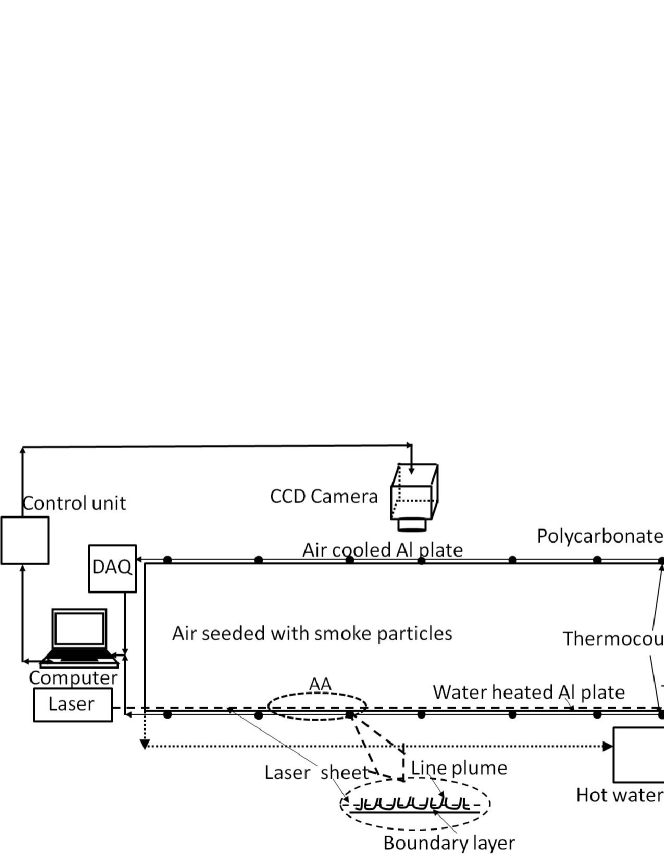
A convection cell of area of cross section mmmm, that had air confined between top and bottom aluminium plates was used for visualising the plume structures near the bottom plate at . The schematic of the convection cell used is shown in figure 1. The aluminium plates were separated by four transparent polycarbonate side walls of height mm. The bottom aluminium plate was maintained at a constant temperature using a temperature controlled water circulating system. The top plate was air cooled by fans so that a constant mean temperature difference between the plates could be maintained. was determined from spatial and temporal averaging of the plate temperatures recorded at 25 locations in each plate using PT100 thermocouples. The range of Rayleigh numbers in the experiments was , which was obtained by changing . Each experiment was run for approximately minutes to ensure a steady state condition inside the convection cell before measurements were taken. The planforms of plume structures near the plate were made visible when a horizontal light sheet from a nm Nd-Yag laser, grazing the bottom hot plate, was scattered by the smoke particles mixed with the air inside the convection cell. Since the plumes have relatively lesser number of smoke particles, they scatter less light and hence appear as dark lines in a bright background.
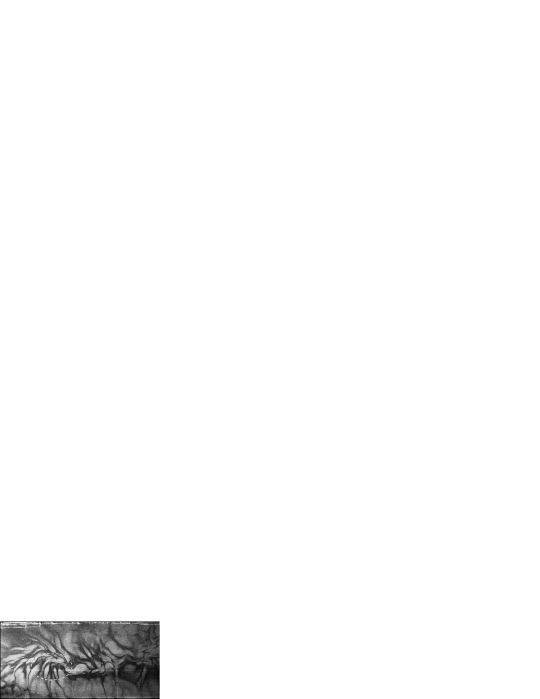
Since the convection cell had a closed opaque top, the top views of the plume structures near the bottom plate were captured through the side walls by a CCD camera at 10fps. The perspective errors caused by this inclined camera axis were removed using a horizontal calibration plate in the plane of observation. Figures 5 shows one of such top view of the plume structures near the plate at , the dark lines in the figure are the top view of the rising line plumes near the bottom plate. The details of the values of the parameters used in these experiments are given in table 1.
| or | (mm) | (mm2) | or | (mm/s) | ||
|---|---|---|---|---|---|---|
| 0.74 | 500 | 10.48 | 19.12 | 16.16 | ||
| 15.46 | 31.44 | 19.132 | ||||
| 20.17 | 44.16 | 20.64 | ||||
| 24.89 | 57.64 | 21.886 | ||||
| 5.3 | 50 | 0.05 | 65 | 0.2608 | ||
| 5.3 | 0.15 | 190 | 0.3922 | |||
| 5.2 | 0.26 | 260 | 0.4758 | |||
| 5.1 | 0.56 | 585 | 0.5776 | |||
| 5.1 | 1.12 | 1040 | 0.7440 | |||
| 4.9 | 2.03 | 1625 | 0.8630 | |||
| 4.7 | 2.53 | 2340 | 0.9496 | |||
| 3.9 | 4.65 | 4158 | 1.2741 | |||
| 5.3 | 100 | 0.15 | 50 | 0.3866 | ||
| 5.2 | 0.85 | 260 | 0.6726 | |||
| 5.1 | 1.19 | 585 | 0.7292 | |||
| 4.7 | 2.66 | 1625 | 1.0448 | |||
| 4.0 | 3.19 | 2340 | 1.1044 | |||
| 5.3 | 150 | 0.21 | 50 | 0.4666 | ||
| 5.0 | 1.87 | 585 | 0.9297 | |||
| 4.7 | 2.92 | 1625 | 1.1048 | |||
| 4.0 | 3.26 | 2340 | 1.1180 | |||
| 3.6 | 200 | 5.41 | 4158 | 1.2772 | ||
| 5.3 | 210 | 0.23 | 50 | 0.4498 | ||
| 5.1 | 2.45 | 1040 | 0.9818 | |||
| 4.0 | 4.91 | 2340 | 1.222 | |||
| 3.6 | 5.98 | 4158 | 1.3132 | |||
| 602 | 230 | 1 | 0.021 | 0.15 | ||
| 2.65 | 0.09 | 0.2094 | ||||
| 3.21 | 0.1116 | 0.216 |
2.2
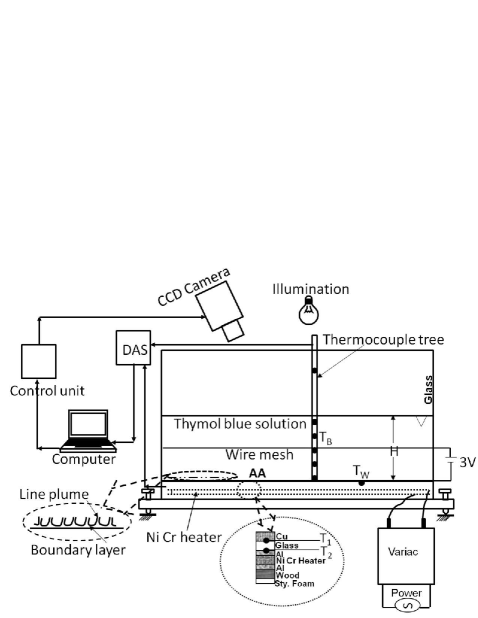
The plume structures near the plate in water for at , were obtained from unsteady temperature driven convection experiments conducted in a convection cell of size mm mm mm. The schematic of the set up used in the experiments is shown in figure 1. The top of the convection cell was kept open to ambient while the bottom copper plate was used to provide a constant heat flux into the layer of water above the plate. The glass side walls as well as the bottom of the cell were sufficiently insulated to minimise the heat loss. The constant heat flux was provided by a Nichrome wire heater connected to variac, sandwiched between two aluminium plates in a vertical plate array as shown in figure 1. The temperature difference (), measured across the glass plate in this vertical array of plates was used to estimate the flux supplied to the bottom plate. This flux was also cross checked with the heat flux supplied by the nichrome wire, estimated from the resistance of the wire and the voltage input. Even though the temperature of the bottom plate and the bulk fluid increased with time, a constant was obtained after about 200 min due to the balance of influx and efflux of heat. Since the dynamics near the plate is solely determined by the driving potential and , the results from the present unsteady experiments could be compared to that from steady Rayleigh Be’nard Convection (RBC).
When a 5V DC supply is applied across the water layer, the local pH of water near the cathodic bottom plate changes due to accumulation of H+ ions. Due to this pH change, the thymol blue dye added to the water changes its colour near the bottom plate, thereby making the plume structures near the plate visible Baker (1966). Since the change in pH occurs in regions close to the bottom plate alone, only the plume structures very near the plate are seen by this technique. The dark lines seen in figure 6 are the line plumes observed near the plate using this technique. The parameters of these experiments are shown in table 1. The reader is referred to Gunasegarane (2013) for more details.
2.3
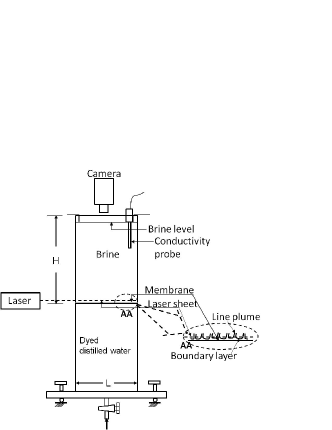
Figure 1 shows the schematic of the experimental set up used by Puthenveettil & Arakeri (2005) for unsteady concentration driven convection at that occurred in a layer of brine placed over a layer of water separated by a horizontal membrane. The experiments were conducted in a tank of cross section mmmm for a liquid layer height of mm. The plume structure shown in figure 7 was observed when an Ar-ion laser (nm) sheet, just above the membrane, intercepted the line plumes that had sodium fluorescein dye in them. The membrane acted in a way similar to the bottom plate in the temperature driven convection, allowing only diffusive transport of mass across it. Since the time scale of dynamics of line plumes near the membrane in this system was much lower than the time scale of variation of flux and the large scale flow, the convection was quasi-steady (Puthenveettil & Arakeri (2008) and Ramareddy & Puthenveettil (2011)). The results could hence be compared with steady RBC when the concentration difference in is calculated using the concentration difference above/below the membrane. The reader is referred to Puthenveettil & Arakeri (2005), Puthenveettil & Arakeri (2008) and Ramareddy & Puthenveettil (2011) for more details of the set-up and procedure.
3 Qualitative description of dynamics
The videos of the topviews of the plume dynamics were studied to classify the complex dynamics of these plumes into the following four classes,
-
1.
longitudinal motion of line plumes,
-
2.
lateral motion of line plumes,
-
3.
initiation of point plumes and
-
4.
miscellaneous motions.
We now qualitatively describe these classes of motion in this section before quantifying the first three classes in § 5.
3.1 Longitudinal motion of line plumes


There was substantial motion along the lengths of plumes in various regions of the planforms. Most often, these motions along the length of the plumes also coincided with the direction of local alignment of the plumes. Such an instance of motion is seen in Figures 3 to 3 at and . The point P in the figure, which indicates the point of joining of two plumes, moves along the length of the plumes on both sides of P. The plumes to the bottom left of P are also aligned along the direction of motion of P. From such a motion we infer that there is a shear in the planform along the diagonal connecting bottom left to top right of these images; point P seems to be at the shear front which moves along this diagonal. This direction of shear is shown by a filled arrow in figure 3. The plumes, that are aligned along the direction of shear, also merge with time, as is obvious by observing the space between the plumes indicated by the hollow arrows in figure 3. Such dynamics that include motion of plume features along their lengths, aligning of plumes along this direction of motion and the merging of such parallel plumes could also be seen in figures 3 to 3 at a similar of but at a higher of . Comparing the motion of point P in figures 3 to 3 with that in figures 3 to 3 we could also infer that the velocity of longitudinal motion of the plumes are substantially less for the higher case. A qualitatively similar dynamics in the shear dominant region at a much higher of and of is shown in figures 4 to 4. A similar comparison of the motion of P between figures 3 to 3 with that in 4 to 4 does not show a substantial difference in velocities of longitudinal motion, even though the is much higher in the latter set of planforms. As we quantify later in § 5.3.1, the strength of longitudinal motion is also a strong function of , which being substantially higher for figure 4, offsets the decrease due to a higher . All the planforms have regions with different strengths of shear, low shear regions usually occur near to the side walls, with the high shear region usually occuring at the center.
3.2 Lateral motion of line plumes
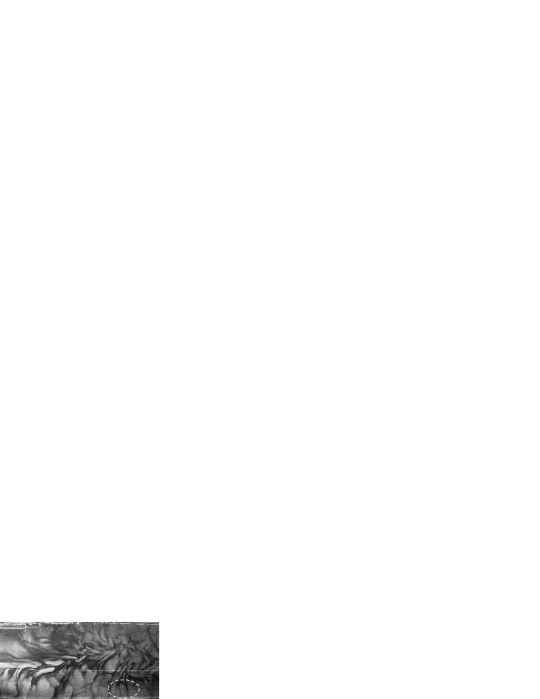


Pairs of line plumes that are near to each other and nearly parallel were observed to move perpendicular to their length and merge. Such a motion could be seen in figures 5 to 5, which shows the zoomed view of the region marked by the dashed ellipse in the planform in figure 5 at and . The lateral merging is obvious from the reducing distance between the line plumes indicated by the hollow arrows in these images which are separated by 0.4 s from each other. Similar lateral merging at around similar but at a higher in water is shown in figures 6 to 6. The merging sequence of two nearby plumes in the concentration driven experiments at higher and higher , than the case of water is seen in figures 7 to 7. These merging motions are the predominant dynamics of these line plumes, especially at lower and higher .
The lateral merging of plumes occurred in all the regions with different strengths of shear in a planform. However, the plumes were observed to merge faster in the low shear regions than those in the high shear regions at the same and . Further, the number of merging instances were also observed to decrease in high shear areas compared to the low shear areas at the same and . In both the regions with less shear as well as strong shear, the velocities of merging were observed to increase with increase in or decrease in . Due to the presence of large shear in some regions, or due to the absence of nearby plumes in other regions, the total length of plumes in the planform does not undergo lateral merging. There is a fraction, which is a function of and , of the total plume length in the planform that undergoes merging. Further, we also notice that plumes have to be close to each to other to undergo merging, else they remain stationary or are swept away by the large scale flow.
The merging of nearby plumes were not limited to only when they were parallel. Often, one end of nearby plumes would be touching each other with the distance between the plumes increasing as we go away from the contact point. These plumes also merge in such a condition, often becoming parallel during the merging process (see figures 7 to 7 and 4 to 4 for plumes touching at P). Often, since there are more than a pair of plumes that are nearby to each other, merging of a pair would also result in this pair of plumes moving away from nearby plumes, we however do not classify this as a separate motion since the motion is again due to the merging.
3.3 Initiation of plumes


The third class of motion that we observe often is the initiation of new plumes. New plumes are initiated in regions that have become free of plumes due to either or both of the two class of motions described in § 3.2 and § 3.1. Figure 8 shows the sequence of initiation of a plume in a region free of plumes at and . The initiation occurs as a point burst on the underlying boundary layer, shown by point P in figure 8. This point plume is soon elongated in the direction of the prevalent shear in the region at which it is initiated (see figures 8 to 8). The prevalent shear at this point could be due to the entrainment flow field of a nearby plume, or it could be due to the external shear by the large scale flow. In the former case the elongation is often approximately at right angles to the nearby plume; figure 8 is an example of such elongation. The initiation dynamics at a larger of at around the same as in figure 8 is shown in figure 9. The filled arrow shows the predominant shear field near point P in these figures as inferred from the motion of point A in the figures. The shear is mostly due to the large scale flow since the plumes are seen to be aligned in this direction, the point plume also elongates in the direction parallel to the nearby plumes. The initiation dynamics at the location marked by D in figures 4 to 4 at a much larger of and at a higher of shows the influence of both the external shear and the nearby plumes. The initial elongation of the plume is along the direction in which the nearby plumes are aligned, parallel to the nearby plumes, and hence is mostly due to the external shear. However at later stages, the orientation of the plume changes so as to join the nearby plume at an angle, possibly due to the influence of the nearby plume. By comparing the size of the initiation plume at the three different in figures 8, 9 and 4 we could see that the initiation occurs as a smaller, sharper point with increase in . In addition the elongation also appears to be slower with increase in .
3.4 Miscellaneous motions


In addition to the above three major class of motions, there are other minor motions that occur not so frequently in the planforms. One of such motions is shown in figure 10 which occurs at the intersection of shear in the opposite directions. In figure 10 there is a shear directed downwards from the top left shown by the top filled arrow and shear upwards from the bottom right, shown by the bottom filled arrow. Intersection of these two shear streams causes the line plumes to start swirling about point P in the direction shown by the dashed arrow. The point P is usually also not stationary, as could be observed from figure 10 (a) to (d) where the location of P has shifted to the right. We find such swirling motion to occur more at lower at a given , possibly due to the stronger shear at the lower viscosity at the lower .


Even though plumes usually align along the direction of shear, as discussed in § 3.1, there are situations where this does not occur. We sometimes find plumes whose both ends are connected to other plumes which are aligned along the direction of shear. Since such a plume is prevented from aligning by the plumes at its ends, it often moves laterally in the direction of shear without aligning along the direction of shear. Figure 11 shows such an instance where the plume marked by P moves laterally in the direction of shear without aligning in this direction. The filled arrow shows the direction of shear, which could be inferred by looking at the successive locations of the feature D in figures 11 to 11. A similar situation of lateral plume motion in the presence of shear is also sometimes seen when the shear is not caused by the large scale flow, but by the local impingement of flows necessitated by rising local plume columns. Figure 12 shows such an instance where there is local impingement of flow at the point D which drives a shear in the directions shown by the filled arrows, thereby moving the plume P in a lateral direction. The shear could not be due to the external large scale flow, since it is not unidirectional as it is in the case of planforms discussed in § 3.1 and since there is no alignment of any of the plumes around the region of impingement.
Eventhough we have described the various motions in § 3.1 to 3.4 for the sake of completeness, all these motions are not equally important at any instant. One could detect the predominant motions by qualitatively estimating the fraction of the area of the planform at any instant that exhibit these motions. Such an evaluation shows that the most predominant motion is merging, followed by shear and then initiation, the miscellaneous motions occuring rarely.
4 Measurement of plume dynamics
As mentioned in § 3.4, the predominant motion of plumes in terms of area affected, are merging, shear and initiation. We undertake the following five measurements to quantify these dynamics described qualitatively in § 3.1, § 3.2 and § 3.3.
-
1.
The velocities along the line plumes ().
-
2.
The spacing () between two line plumes that are nearly parallel as a function of time.
-
3.
The fraction of the total length of plumes over which there is substantial longitudinal motion ().
-
4.
The fraction of the total length of plumes in a planform that merge ().
-
5.
The time of initiation of point plumes .
All these measurements are made on top view images, similar to that shown in figures 5 to 4
4.1 Velocities along plumes
The velocities along the length of the plumes were calculated by measuring the speed at which some feature of the plume moves along the plume. For example, we estimate the velocity along the plumes in figure 3 to 3, by measuring the displacement of the dot in the plume structure, marked by P, along the plume length in successive frames of the merging sequence. Since the plumes align easily along the shear direction, we expect the velocity estimated in this way to be indicative of the strength of shear caused by the large scale flow. The feature is tracked over a time period of to which is much lower than the time scale over which the large scale flow changes. The feature is tracked over a distance of the order of less than one tenth of the tank width so that effects of spatial variations in shear, expected to be substantial only over half the tank width, could be expected to be negligible in these local measurements. Hence, we use a linear fit between the position of the plume feature with time to calculate the derivative with time to estimate a constant local velocity along the plume at a given and at any location.
4.2 Plume spacing as a function of time
The merging velocities of plumes were calculated by measuring the position of two merging line plumes from successive images of a merging sequence. A merging sequence of a pair of line plumes was first identified by viewing a video recording of the time evolution of the whole planform of plume structure. Figure 5, and other similar planforms at different , show plumes identified in this way within a dashed ellipse. The co-ordinates of two points- one each on each facing edge of both the plumes in the identified plume pair - that could be connected by a line approximately perpendicular to these line plumes, are captured from mouse clicks by a program. The same process is repeated in each successive image of the merging sequence. The program then calculates the distance between these points in each frame of the merging sequence to obtain the plume spacing as a function of time , the time being calculated from the frame rate of the recording. The maximum error involved in the measurement of were of the order of as estimated from the pixel size of the images. These measurements were then repeated for different merging sequences at different times and locations in the video of the time evolution of the planform for each .
4.3 Merging and sheared plume lengths
.
Information on the fraction of the total plume length that is merging at any is needed to understand the importance of the merging motion in the total dynamics of the plumes near the plate. We determine this fraction in the following way. A short video clip, of time duration of few seconds, is made from the complete video of the time evolution of the planforms. This video clip is played continuously at a much higher speed than the actual recording speed so that merging parts of the plumes could be easily identified. Along with this movie clip, the first planform image from this movie video clip is viewed. Using a program that marks lines on images and estimates the total length of such lines Puthenveettil, Gunasegarane, Yogesh, Schmeling, Bosbach & Arakeri (2011) the regions of plumes that are merging in the movie clip are marked with short linear segments in the planform image. Figure 13 shows an example of such a marked planform, where the blue lines are the parts of the plumes that show substantial lateral motion. The program then adds up the total length of the marked lines to give an estimate of the length of plumes that are merging at any . A similar procedure is also used to estimate the fraction of the total length of plumes in a planform at a specific and that have substantial longitudinal motion along the plumes.
4.4 Time of initiation of plumes
As discussed in § 3.3, line plumes are often initiated as points which then elongate in the prevalent direction of shear at the initiation point. We measure the time for the initiation of these plumes as points, with the intention to understand the process by which these plumes are generated. Movies of the evolution of the planforms are repeatedly played while focussing attention in a specific region of the plan form so as to spot a location at which a plume is initiated as a point, similar to that shown in figures 8, 9 and 4. Once a location of initiation is identified, the movie is stopped at that frame and the movie is played in reverse while examining the frames so as to find another frame in which there is no plume at the location of the initiation. The time between these two frames is taken as the time of initiation of a plume at that location. This procedure is repeated by identifying similar initiation of plumes at different locations on the planforms for a given and . The mean time of initiation of plumes at a given and is determined from such multiple measurements.
5 Dynamics of line plumes
We now quantify the three main dynamics that we described qualitatively in § 3.1, § 3.2 and § 3.3. We focus more on quantifying the dynamics of merging of plumes since far less is known on this type motion compared to the other two.
5.1 Longitudinal motion of plumes
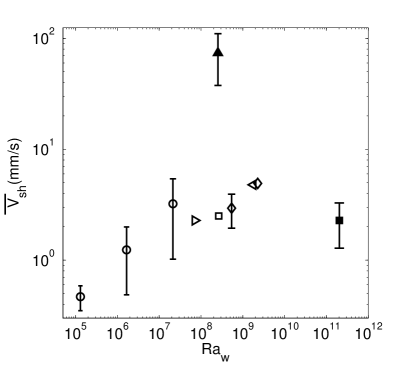
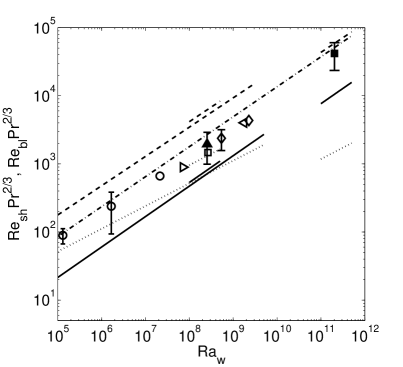
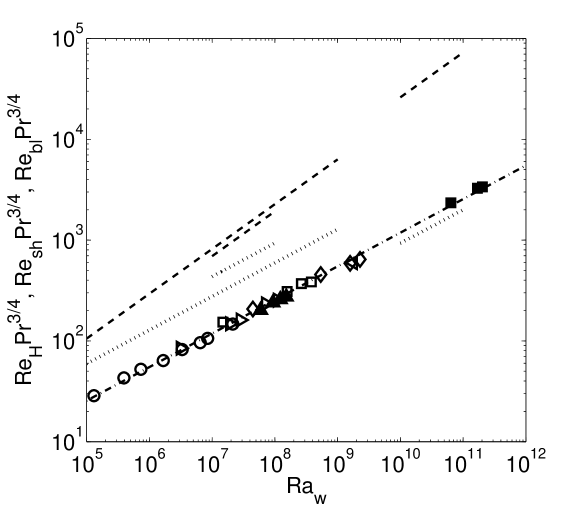
Figure 14 shows the variation of the mean velocity of longitudinal motion along the plumes , measured as discussed in § 4.1, at various and . was calculated from measurements at about five locations at various times from movies of plume motion at a given and . The vertical bars in the figure show the range of variation of the longitudinal velocity at each and . The mean longitudinal velocities increase with increase in and decrease in . At the lower in water, the velocities are small (mm/s) but become appreciable with increase in and is quite substantial at about cm/s in air at an of . There also seems to be a trend of increasing range of longitudinal velocities with increasing at the same . Since these behaviours are also exhibited by the large scale flow in turbulent convection we expect the longitudinal motion of plumes to be caused by the shear of the large scale flow; we now verify this by comparing with the large scale flow velocities in turbulent convection.
Figure 14 shows the expressions for the large scale flow strength, in terms of the corresponding Reynolds number, proposed by Puthenveettil & Arakeri (2005), Xia et al. (2002) and Grossman & Lohse (2009), along with the variation of , the Reynolds number based on the mean longitudinal velocity on the plumes. The magnitude and scaling of is almost the same as that of the large scale flow proposed by Puthenveettil & Arakeri (2005), i.e.,
| (3) |
In addition, since there is no other obvious force, other than that caused by the shear of the large sale flow, that would be needed to balance the viscous resistance for the longitudinal motion along the plumes, it would be plausible to conclude that the longitudinal motion along the plumes is caused by the shear of the large scale flow on these plumes.
This shear on the plumes also act on the boundary layers in between the plumes. Puthenveettil et al. (2011), without considering the presence of such a shear, have shown that the observed length of these lines plumes in any area of the plate could be explained by the phenomenology of natural convection boundary layers becoming unstable at ; a similar phenomenology also explains the scaling of mean spacing between the plumes Theerthan & Arakeri (1998); Puthenveettil & Arakeri (2005). Judging from the match obtained by these theories with the experiments on the mean spacing and the total length of plumes, the effect of shear on the assumed phenomenology, viz. on the stability of these local boundary layers and on the flux scaling, is mostly small. However, as found out recently by Shi et al. (2012), the velocity profiles near the plate in experiments do not match the profiles from these theories that assume natural convection boundary layers. Note that such a comparison was not done on the spatially averaged profiles arising out of two natural convection boundary layers giving rise to a plume, which is necessary, as shown by Theerthan & Arakeri (1998). Still, as first pointed out by Puthenveettil & Arakeri (2005), and recently proposed by Shi et al. (2012), with increasing the local boundary layers between the plumes will be affected by the external shear of the large scale flow.
Such an inference could be formed by comparing the magnitudes of the horizontal velocities inside the local boundary layers feeding the plumes and the large scale flow velocities. Figure 14 shows the variation of , the Reynolds number in terms of , the horizontal characteristic velocity inside the natural convection boundary layers feeding the plume from each side at its base, as given by (A12) in Puthenveettil et al. (2011).
| (4) |
as obtained from (A12) and (A11) of Puthenveettil et al. (2011), by using (2) and (10), where, and . is an order of magnitude smaller than , the difference in magnitudes between the Reynolds numbers increasing with increasing . Eventhough the value of external shear given by (3) is at a much higher location that the height at which the natural convection boundary layers turn into a plume (see Puthenveettil et al. (2011)), at larger , the large scale flow will affect the flow inside the local natural convection boundary layers to turn them into mixed convection boundary layers.
Such an effect of the external shear on the boundary layers could be detected, eventhough qualitatively, from our visualisations. The dashed arrows in figure 12 shows the motion in the boundary layers in between the plumes in a region where there is no substantial shear. The dashed arrows are drawn parallel to the dye streaks seen in the figure; the streaks are formed when the dye layer formed on the plate gets drawn in the predominant motion direction. The motion is approximately perpendicular to the plumes, as would be expected if the boundary layers were natural convection boundary layers feeding the plume at its base. However in figure 9, which due to the higher has more external shear, the motion in the boundary layers in between the plumes is no longer perpendicular to the plumes. The dashed arrows in the figure show that the motion in the boundary layers is inclined in the direction of the external shear, shown by the thick filled white arrow; one could expect these boundary layers to be of mixed convection. At any instant in the planforms at any and , there are regions with substantial shear along the plumes as well as without it. Hence, the boundary layers feeding the plumes would show a varying nature between pure natural convection type and mixed convection type at various locations, based on the relative magnitude of the external shear and the characteristic velocity of natural convection boundary layers at each location; the former being given by (3), while the latter being given by (4).
It is hence important to get an idea of the extent of the bottom plate area affected by the external shear at different and . Figure 15 shows the variation of , the fraction of the length of plumes that have noticeable shear along the length of the plumes, for various and three ; were measured as discussed in § 4.3. The region affected by shear increases with increase in and with decrease in , both these changes also increase the strength of the large scale flow as per (3). The inset in the figure shows that
| (5) |
Interestingly, in § 5.3.1, we find an inverse dependence on and of that in (5) for the fraction of plume lengths that is merging.
5.2 Initiation of plumes
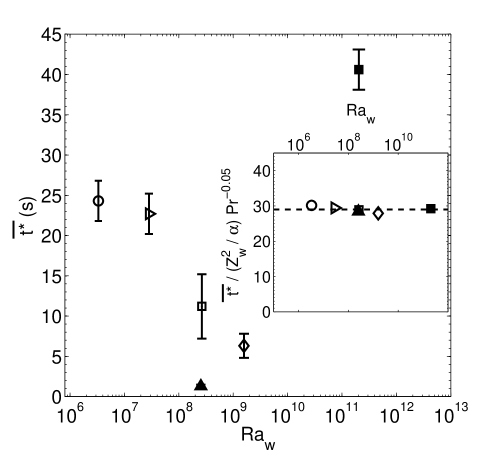
It was observed in § 3.3 that plumes usually initiate as points in regions that are free of line plumes, the time for such initiation was measured as discussed in 4.4. Figure 16 shows the variation of the mean time of initiation of point plumes at various and . Plumes initiate faster at larger and at lower . As per Howard (1964), initiation of plumes occur by periodic eruption of the boundary layer that grows by a diffusive process as . The boundary layer erupts at a time at which the Rayleigh number based on the boundary layer thickness becomes approximately . Using the value of in the expression for and using (2) to rewrite in terms of , we obtain
| (6) |
with an unspecified dependence, since the stability condition has an unknown dependence Puthenveettil, Gunasegarane, Yogesh, Schmeling, Bosbach & Arakeri (2011). The time of initiation of plumes is proportional to , the diffusive time scale near the plate. The inset in figure 16 shows that the measured mean times of initiation of the point plumes scale as
| (7) |
quite close to (6).
5.3 Merging of plumes
5.3.1 Fraction of merging length
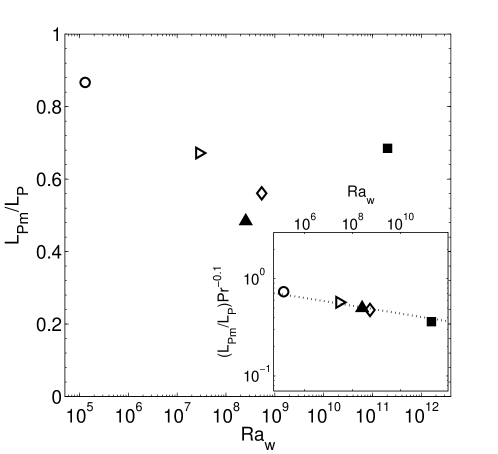
As discussed in § 3.2, the complete length of a plume line is not in merging motion at any instant. Parts of the plume line which are not in merging motion often occur in regions of larger shear, since shear reduces the merging velocity. In such regions there will be substantial motion along the length of the plume line. In addition, there are also regions in which plumes are not merging, even when there is no substantial shear in that region, since there is no line plume nearby to any plume for merging to occur. The occurrence of such different types of regions on a planform at any instant necessitates the need to study the role of the merging motion in the complete dynamics of plumes near the plate.
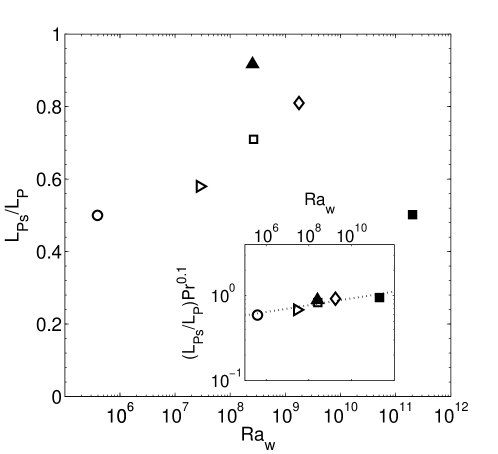
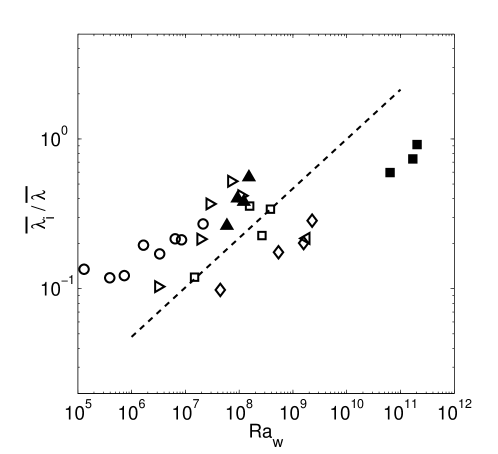
The ratio , where is the total length of plumes that are merging in a planform at an instant, measured as discussed in § 4.3, is an indicator of the importance of the merging dynamics in the overall dynamics near the plate. Figure 17 shows the variation of with measured in the three fluids. Merging is the predominant dynamics at the lowest in water, with almost 90% of the length of the plumes undergoing a merging motion at this . However with increase in , the fraction of length of plumes that display merging motion in water decreases to about 55% at . Similarly, it is clear that the merging length fraction decreases with decrease in by comparing the data of air at with that of water. The inset of figure 17 shows that
| (8) |
We expect this behaviour of to be due to the increase in shear on the plumes, associated with the increase in and decrease in . As discussed earlier, the effect of this increased shear is to decrease the merging velocities. Note that (8) and (5) have an exact inverse dependence on and . Such a relationship implies that
| (9) |
a dimensionless invariant number for all the fluids in thermal convection.
5.3.2 Variation of merging velocities during the merging process
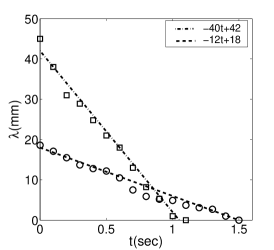
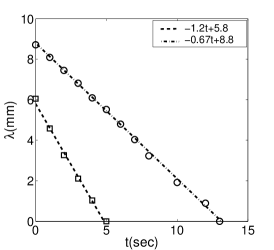
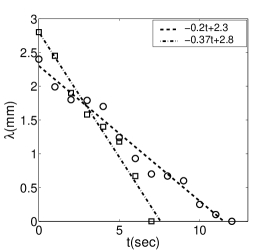
Figure 18 shows the variation of with time for air, obtained by measurements as described in § 4.2 at the two different locations shown in figures 5 and 3 at . The results of similar measurements corresponding to the locations in figures 6 and 3 for and corresponding to figures 7 and 4 for are shown in figures 18 and 18 respectively. It could be noticed that the variation of in all these plots is approximately linear with time. Such linear behaviour of with were obtained for all the measurements at different for all the three at all the locations of a planform. The maximum variation of the data from linearity was of the order of from all the curve fits. Due to such a linear variation of with time at all and , we estimate the merging velocities of plumes by calculating the gradient of a linear curve fit through the measured vs .
A linear variation of with would imply that the plumes merge with a constant velocity during their merging period, eventhough the value of this constant velocity is itself different at different locations at the same , as shown by figure 18. In addition, these merging velocities are strong functions of and , as is obvious from figures 18 to 18.
It is possible that such a linear variation of with , resulting in a constant merging velocity where , is because we detect two line plumes as merging only when they come close together, so that a nonlinear variation appears linear due to the short range measurement. To verify whether this is the case for our measurements, we plot the variation of for all the measurements of in figure 19. Here, is the first measurement of the plume spacing measured in each plume merging sequence, averaged over all such measurements at the same . is the critical plume spacing given by Theerthan & Arakeri (1998) and Puthenveettil & Arakeri (2005) as,
| (10) |
where and . The figure shows that all the measurements of merging plumes were conducted on plumes that were separated by an initial spacing smaller than . scale approximately as mainly because all the are approximately equal to 5 mm, except for where it is about 2.5 cm, while decrease as as per (10). As we discussed in § 3.2, only plumes closer than the critical spacing seems to merge, others fade away or are swept along their length by the shear. It appears that in our measurements appreciable merging velocity is detected only when plumes come close to a distance of the order of . However, the constant merging velocity during a merging cycle is unlikely to be due to the short distance over which the merging is measured since, as we show later in § 6.2, there is a strong physical reason for it to be so.
5.3.3 Statistics of merging velocities
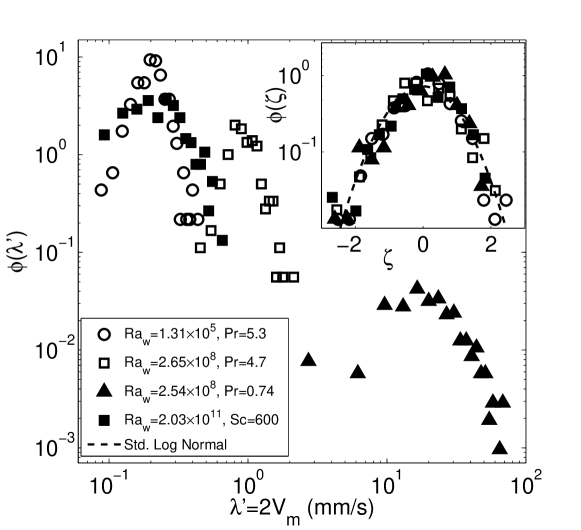
Figure 18 shows that plumes in low shear regions merged faster than those in the shear dominated regions. Since the shear due to the large scale flow is also a function of space Puthenveettil & Arakeri (2005); Qiu & Xia (1998), the merging velocities () could be expected to be a function of the location of the merging plumes. In addition, the presence of nearby line plumes could also affect the merging velocity of a pair of plumes. Hence at any instant, in a planform are distributed over a range of values. On the other hand, at any location, for a given and , in addition to the fact that plumes are initiated at different times, the that occur in different merging sequences could also be a function of time since the shear at a location is also not constant due to the azimuthal rotations and reversals of the large scale flow (Ahlers et al. (2009)). Hence, at any and , the merging velocities are functions of space and time.
We estimate this distribution of at any and by measuring the merging velocities from various merging sequences at different locations and times for that and . At each , about 30 plume merging sequences on the planforms were identified at different times from regions with and without shear. From these sequences, a total of about 280 plume merging velocities were measured. To increase the number of samples of , the velocities during any merging sequence were calculated by estimating from successive values of in time, and not from a curve fit as in § 4.2.
Figure 20 shows the probability density function (pdf) of obtained from these measurements at four different for the three . Comparing the and curves in the figure ( and ), which are approximately at the same , it is clear that a decrease in results in a higher mean merging velocity (). Plumes merged faster at a lower at the same . Since viscous effects will be lower in a lower fluid, the resistance to merging motion will be lower, the mean merging velocities could hence be expected to be larger. However, lower also results in larger shear velocities due to the stronger large scale flow Ahlers, Grossman & Lohse (2009); as we saw earlier, this shear slows down the merging. Such a slowing of merging due to the increase in the strength of the large scale flow do not seems to be the dominating effect compared to the possible increase in merging velocities due to the reduction in viscous resistance to merging. The range of observed at a smaller was larger than that at a higher , as could be noticed from the spread of the pdfs and in figure 20. The higher shear at lower could be the reason for such a behaviour of the pdfs. The shear at smaller would have larger variations across the planform since it has to be negligible near the side walls while its value at the centre will increase obeying the standard relations for the large scale flow strengthAhlers, Grossman & Lohse (2009); similar would be the corresponding variation of since shear reduces .
Comparing the pdfs at and , which are approximately at the same ( and in figure 16) it could be noticed that the mean merging velocity increased with increase in . Plumes merge faster with increase in at the same , presumably since more amount of heat has to be transported into the bulk at a larger . The range of merging velocities also increase with increase in , since due to the same reason for the larger range of with lower , the range of variation of shear on the planform increases with . The pdf for and show the combined result of the opposing effects of increase in and . For this data, the effect of an increase in seems to be dominant than an increase in since the mean and the range of are lower than those obtained at lower .
The noticeable common trend from all the curves in figure 20 is that an increase in mean merging velocity decreases the probability of finding this in any planform; the curves are shifted downward with increasing values of for any fluid. This trend is seen whether the increase in occurs due to a decrease of or due to an increase of . We expect the reason for this behaviour to be as follows: The total length of plumes in the planform increases as and as shown by Puthenveettil et al. (2011). Since increases with an increase in or a decrease of , an increase in will also be accompanied by a larger in the planform. When increases, we expect the total number of merging occurrences, as well as the number of mergings with a specific also to increase. But since this increased number of mergings occur over a larger range of , as we saw earlier, the probability of finding any decreases with an increase in .
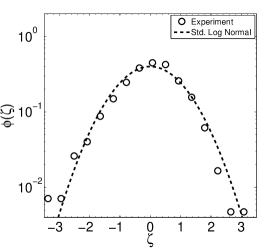
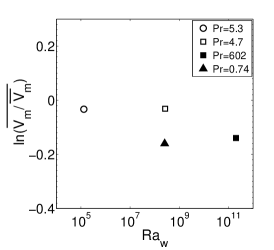
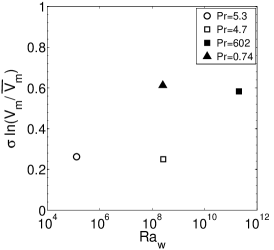
The inset in figure 20 shows the data in the main figure plotted as the pdf of the logarithm of the dimensionless merging velocities () in its standardised form , where, — indicates the mean and indicates the standard deviation. All the curves in figure 20 collapse on to the standard log-normal curve, shown as the dashed line. Even though the mean and the variance of increased with increasing and decreasing , the probability distribution function has a common log-normal form for all the and . We hence combine the merging velocity data, in the form of , for the data shown in figure 20 so as to obtain 1120 data points to plot the general probability distribution function of plume merging velocities in figure 21. The variation of the standardising parameters and are shown in figures 21 and 21. The unfilled symbols have a constant value of while the filled symbols have a value about -0.14. Similarly, for the unfilled symbols while it is equal to 0.6 for the filled symbols. Studying figure 20, we observe that the pdf of the filled symbols, which are either at a much larger or a much smaller than the water experiments at , have a noticeable asymmetry with a larger probability of finding the lower than mean values of than the higher than mean values. This asymmetry lowers the and increases the for the filled symbols, seen respectively in figure 21 and 21, when compared to the unfilled symbols. Shear increases with increase in and decrease in , and shear decreases the merging velocities. Hence at larger and lower we expect a higher probability of occurrence of smaller than the mean. Similarly, since increase in shear also increases the range of we expect to be higher at higher and lower .
5.3.4 Mean merging velocities
Figure(22) shows the variation of , the mean velocity of merging of plumes, with for the three ; the corresponding values are listed in table 1. At each , the mean was determined from five values of plume merging velocities measured at different locations, including shear and no-shear regions, at different times. The vertical bars give the range of obtained from such measurements; an indication of the range of at any due to varying shear at different locations and at different times. As seen earlier, the effect of shear is to reduce the plume merging velocity Puthenveettil & Arakeri (2005). The range of velocities at and shows that is closer to the maximum value implying that more measurements were made from low shear regions. On the contrary, the measured at and is closer to the minimum value of indicating more measurements from shear dominated regions. As seen in § 5.1, with increase in , in addition to increase in shear, the regions affected by shear also increases; more and more in the planform are affected by shear with increase in , which reduces its value. The measurements of hence seems to account for the effect of shear due to the large scale flow.
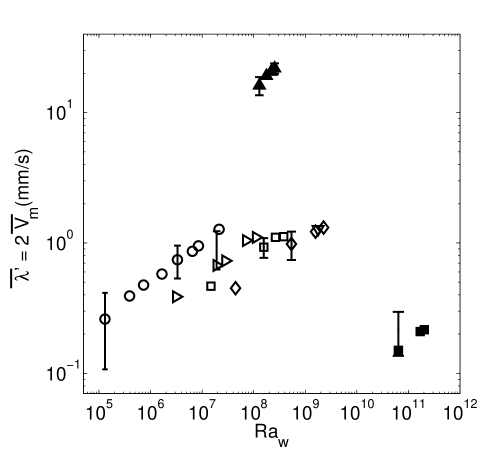
At all , for any constant , increased with increase in ; plumes merged faster with increase in driving potential . Variation of for thermal convection experiments in water at approximately the same , shown by any of the symbols and in figure 22, were obtained by changing the heat flux for any constant . It is clear that a change in layer height results in a horizontal shift of the curve of without changing the values of ; as we show later, is independent of layer height if the effect of external shear is small. The shift in vs in figure 22 comes only due to the plotting of as a function of by which the value of at the same driving potential is shifted by a fixed value between experiments with different layer heights. Comparing the water and air data at it could be noticed that the plumes merged much faster at than at . is inversely proportional to , as was also observed in figure 20. By comparing figures 22 and 14, we also notice that the mean merging velocities are an order lower than the mean longitudinal velocities. We now quantify these qualitative observations about the mean merging velocities by building a scaling analysis based on an assumed phenomenology of merging laminar sheet plumes.
6 Scaling of mean merging velocities
Consider two parallel line plumes that are merging as shown in figure 23. These line plumes originate from the instability of laminar natural convection boundary layers Pera & Gebhart (1973) that occur on both sides of each plume at its base, (Puthenveettil & Arakeri, 2005; Puthenveettil et al., 2011). Since these plumes are an outcome of the instability of the laminar natural convection boundary layers, we expect these plumes to retain their laminar nature till some height. The similarity solutions of such laminar plumes rising from a line source of heat are given by Fuji (1963) and Gebhart, Pera & Schorr (1970). The rising plumes entrain fluid from the ambient through their sides so that the mass flux at any cross section, the velocities inside the plumes and the width of the plumes increase with height Gebhart, Pera & Schorr (1970). The entrainment flow at the side of the plume at any height is determined by the velocity inside the plumes, which again is determined by the heat flux. For a given heat flux and spacing between the plumes, the flow from the bulk region may not be enough to meet this entrainment flow into the plume; the plumes could then be expected to adjust their horizontal position so that mass and momentum balance of the region between the plumes is maintained. We formalise this phenomenology below by using the unsteady mass and momentum balance of a deforming control volume ( CV ) in between the plumes.

6.1 Control volume mass and momentum balance
As shown in figure 23 we choose the width of the CV to be equal to the spacing between the plumes which is a function of time . The height of the CV is chosen as the height to which the diffusive region near the plate extends upwards. is chosen as the position at which the mean profiles of temperature, velocity and their fluctuations do not show substantial variation with height ( see Theerthan & Arakeri (2000, 1998)). Here, for the time being, is assumed to be a constant and is the length scale defined by (2). In actuality, is a function of ; we will see later that this has to be so for our theory to match the experiments in its dependence. for so that for the usual range of , cm. Over this small height, at a scaling level, one could neglect the variation of the plume thickness with height in estimating the volume of fluid in between the plumes. Further since , we neglect the contribution of the boundary layers on the plate in estimating the volume of the fluid in between the plumes. Under these assumptions, the mass balance becomes,
| (11) |
where, as shown in figure 23, is the density of the bulk fluid, the downward velocity of the bulk fluid at the top surface of the CV and the horizontal entrainment velocity at the edge of the plumes at any height . Equation (11) shows that the rate of change of mass of the bulk fluid in between the plumes due to the merging of the plumes is equal to the difference between the influx from the bulk and the out flux due to the entrainment by the plumes. Since could be obtained as a function of and from the similarity solutions of Gebhart et al. (1970), (11) could be used to obtain the scaling of if is known, or could be eliminated by another equation. The momentum balance of the fluid in between the plumes gives us such an equation.
By vertical momentum balance in the CV, we get,
| (12) |
under the same assumptions used in obtaining (11). Here, is the vertical velocity distribution in between the plumes and the pressure difference between the bottom and the top of the CV. The pressure drop across the boundary layer on the plate (, see § A.2 in Puthenveettil et al. (2011)) is neglected in comparison to the pressure drop in the rest of the height of the CV, . The above equation shows that the rate of change of vertical momentum in between the plumes will be equal to the sum of the net vertical force and the influx of vertical momentum due to the inflow of bulk fluid at the top of the CV. We now estimate the unknown in (12) using unsteady Bernoulli equation.
The flow in between the plumes could be assumed to be irrotational, except in the boundary layer region, as was shown by Schneider (1981) for the case of axisymmetric plumes. We neglect the pressure drop across the boundary layers on the plate and the entrainment velocity at the edge of the boundary layers on the plate in comparison to the velocity at the top of the CV, and assume that . Then, by applying unsteady Bernoulli equation between the top of the CV and at the edge of the boundary layer, we obtain,
| (13) |
With the above three equations (11), (12) and (13) we now relate the unknown merging velocity to the entrainment velocity , which could be estimated from the similarity solutions of Gebhart et al. (1970).
6.2 Relationships of merging velocity to velocities of entrainment and plume rise
Expanding the first term in (12) and substituting from (13) in (12), we obtain,
| (14) |
since scales as . Now, the unknown in (11) could be eliminated by substituting (14) in (11) to obtain,
| (15) |
In other words, the lateral merging velocity of the plumes is equal to the average entrainment velocity at the sides of the plumes, where the averaging is done over the height of the diffusive zone near the plate.
We could also relate the merging velocity of plumes to their rise velocity as follows. By mass balance of the plume,
| (16) |
where is the velocity distribution inside the plume across the thickness of the plume of at a height of . Equations (15) and (16) would then imply that
| (17) |
where is the average plume rise velocity at a height of . Since , equation (17) implies that the merging velocities of the plumes are an order lower than the plume rise velocities. Since the velocity of large scale circulation also scales as the velocity of rise of plumes Puthenveettil & Arakeri (2005), the merging velocities of the plumes would be an order lower than the large scale circulation velocity as was observed figures 22 and 14. We observed in § 5.3.2 that the merging velocities are a constant during any merging instance at a fixed . It is easy to understand the cause for this behaviour from (15) and (17). At any , the strength of two adjacent plumes could be expected to be constant over their merging period. This would imply that their average entrainment velocity also remains constant during the merging cycle; (15) would then imply that the merging velocities are also constant.
6.3 The entrainment flow into the plumes
We have seen in (15) that the velocity of merging of plumes is related to , the total entrainment flow into the plume through one of its sides, over the height of the diffusive region near the plate. We now need to estimate this entrainment flow as a function of and to find the scaling of merging velocities. As given by Gebhart et al. (1970), the velocity of entrainment at the edge of a two dimensional plume above a heated line source at any height is
| (18) |
where, is the value of the similarity variable of Gebhart et al. (1970) at the velocity boundary layer thickness . is the dimensionless stream function defined by , with the local Grashoff number,
| (19) |
where for and for , while for all as obtained from Gebhart et al. (1970). Here, is the temperature difference between the center line of the plume and the ambient, which decreases with as follows
| (20) |
where from Gebhart et al. (1970), is the specific heat at constant pressure and is the heat flux into each line plume. Equation (18) is for a single plume above a heated line source, in the case of convection over a hot surface, we need to relate the heat flux from the plate to the strength of the line source of individual plumes in (20).
6.3.1 Relation between and
The heat from the plate is transferred to the boundary layers on both sides of each of the plumes, which then input this heat to the base of each of the plume. The boundary layers, which become unstable at a mean distance of , cover the plate. Hence, we assume that the total heat carried away by all the plumes from any area on the plate at any instant is equal to the total heat supplied by the plate in that area. Numerical studies by Shishkina & Wagner (2008) have shown that this assumption is valid.
in (20) is also the heat transported by the plume per unit length at any height, since the total heat transported by the plume is constant at any height. Now, if is the total length of all the plumes in an area of the plate, then equating the heat carried away by the plumes in an area to the heat supplied by the plate in the same area implies,
| (21) |
Since
| (22) |
as shown by Puthenveettil et al. (2011),
| (23) |
6.3.2 Relation between , and fluid properties
To eliminate from (20) , in (23) could also be written in terms of to obtain a relation between , and fluid properties. Using the expression for Townsend’s near-wall length scale,
| (24) |
and the relation,
| (25) |
Puthenveettil, Gunasegarane, Yogesh, Schmeling, Bosbach & Arakeri (2011), where, and , along with (23), we get
| (26) |
We now substitute (26) in (20) and use the resulting expression for in (19) to obtain the expression for local . Using this expression for in (18), we integrate the resulting expression for with respect to from to . Replacing in the resulting expression with (10) we obtain,
| (27) |
where and for and for . Surprisingly, the total entrainment flow per unit length of line plumes through the sides of the plumes over the height of the diffusive region near the plate, given by (27), is independent of and is only a function of viscosity and , when the line plumes are separated by a mean spacing of .
6.4 Scaling of
Substituting (27) in (15), we obtain,
| (28) |
where is the mean merging velocity and . We use instead of in (28) since (23) is valid for a uniform array of plumes separated by . Equation (28) shows that the mean lateral merging velocity of line plumes scales as the velocity scale near the plate . Note that (28) shows that the merging velocity is only a function of the variables near the plate. This is however so because we have neglected the effect of shear in the scaling analysis. As we have seen earlier in § 5.3.2 and 3.2, shear due to the large scale flow reduces the merging velocity of plumes; if the effect of shear is not substantial, the above scaling is expected to hold. The dependence of shown in figure 22, where higher fluids had lower merging velocities seems to be captured by the dependence in (28). The horizontal shift in , observed in figure 22, between experiments with different heights of fluid layer at the same could also be understood from (28). Since is not a function of , at least to first order, change in in the in the abscissa of the plot will shift the data without changing its scaling. We now quantitatively compare the scaling law of (28) with the experimental data of figure 22 in three different dimensionless forms.
6.4.1 Reynolds number relation
The scaling law of (28) could be rewritten as a Reynolds number in terms of the mean merging velocity and the layer height, as follows,
| (29) |
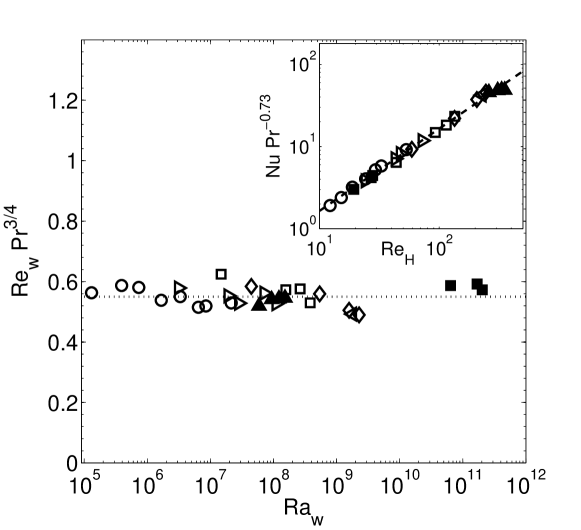
where and for and for . As shown in figure 24, the measured mean merging velocities, in terms of , scale as,
| (30) |
at all . The dependence in the theoretical scaling of (29) matches exactly with the experiments for all ; the difference in the prefactor between theory and experiments is also small (0.65 as against 0.55). Same is the case with the exponent of (-0.75 as against -0.7) for experiments with . These agreements are remarkable considering the number of approximations that were made in the theory, the presence of spatially varying shear in experiments which is not considered in the theory and other errors in the experimental measurements. Equation (29) and (30) imply that the mean plume merging velocity , normalised by the viscous velocity scale , scales as for a given fluid. Such a scaling is similar to the scaling of the dimensionless plume length and in turbulent convection. The dependence of , the Reynolds number in terms of the horizontal velocities inside the local boundary layers at the base of the plume, given by (4), is also shown in figure 24; . Since the velocities inside the boundary layers feeding the plumes are larger than the merging velocities, the plumes are sustained during their merging period.
Figure 24 also shows the magnitude and scaling of (3) in comparison with that of . As shown in § 5.1, has the magnitude, and also scales as the large scale velocity . Figure 24 shows that at all , the magnitude of the is an order of magnitude higher than that of the mean merging velocities. The magnitudes of the mean velocities obtained by Hogg & Ahlers (2013) by spatial correlation of images of plumes were substantially lower than that of the large scale velocity. Since mean merging velocities are much smaller than the shear velocities, the mean velocities detected by Hogg & Ahlers (2013) could be the mean merging velocities, which could possibly be interpreted as following the scaling of large scale flow over a smaller range of of Hogg & Ahlers (2013).
For , eventhough the theoretical scaling has the same prefactor and dependance on as in the case, it has an exponent of equal to as against the experimental exponent of . We now explore the possible cause of this discrepancy between the theory and experiments for .
The theoretical scaling law (29) was obtained by assuming , where . However, this relation for the height of the diffusive region near the plate is valid mostly for since dependence is not included in the length scale (see Puthenveettil et al. (2011) where the boundary layer thickness is a function of and ). It is hence not surprising that the dependence of the theory is correct for , since these experiments are at , close to one. Since our experiments are at , much larger than one, the dependence in should be accounted in the theory if a better agreement with experiments is to be achieved at these . In addition, in obtaining the scaling shown by (14), we had assumed that scales as . Such a scaling is mostly correct only at since viscosity could create vertical variations of vertical velocity in between the plumes at larger . Same is the case with the constant across the top of the CV that was assumed in the analysis; at large , effect of viscosity could create horizontal variations of the bulk flow into the region between the plumes. The above effects are difficult to quantify since no solution for the far field of the entrainment flow into a line plume is available, eventhough the axisymmetric case has been solved by Schneider (1981). The dependence of the height of the diffusive region near the plate is hence not known as of now so as to get a better match of the theory with the experiments.
It is easy to see that the availability of the above missing information could result in an exact match of the theory with the experiments. We notice that if the height of the diffusive region near the plate is a function of so that,
| (31) | |||||
| (32) |
the theoretical scaling will match the experiments for all . Qualitatively, (31) and (32) seems to be correct since, as judged from the distributions of mean quantities, the height of the diffusive region near the plate increases with increase in at the same Theerthan & Arakeri (1998).
Due to the above mentioned unavailability of information to make the scaling analysis more rigorous, we assume that the experimental scaling given by (30) to be the more reliable one from among (29) and (30). Alternatively one could assume that the height of the diffusive region near the plate follows the relation , where is given by (31) and (32), so that the scaling (30) obtained from the experiments match the theory. Further research needs to be conducted to verify the assumed depends of the height of the diffusive region near the plate. We now look at the implications of (30), interms of the invariants that come out of such a scaling, as well relate the dimensionless flux to the dimensionless merging velocity.
6.4.2 Invariants
Equation (28) could be rewritten as an expression for a Reynolds number based on the variables near the plate . In other words,
| (33) |
is a dimensionless invariant for all the fluids in turbulent convection. Figure 25 shows that (33) holds reasonably well for and for in our experiments. Equation (33) means that, the mean merging velocity of the plumes normalised by the velocity scale near the plate is only a function of Pr, and hence remains an invariant for any given fluid in turbulent convection. If we define a Froude number in terms of the mean merging velocity and the length scale near the plate, then,
| (34) |
Using (34) and (33) we obtain that,
| (35) |
is another dimensionless invariant for the dynamics of plumes near the plate in turbulent convection.
6.4.3 Nusselt number relation
given by (10) is also equal to that given by (25), thereby implying that,
| (36) |
where is given by (24). We replace the heat flux that appears in in (36) in terms of the Nusselt number . Substituting the resultant expression for in (33), we obtain
| (37) |
Replacing in (37) by the expression for obtained from (30), we obtain,
| (38) |
The inset of figure 25 shows that the experimental and obey the above expression satisfactorily. is directly proportional to the Nusselt number, which should also be obvious from (30) since in turbulent convection. However, it should be noted that (38) has been obtained here by not using any assumed flux scaling relation in turbulent convection. We have only used the relation (25) for the mean plume spacing, which could be obtained by the phenomenology of laminar natural convection boundary layers becoming unstable at a critical thickness, as was shown by Puthenveettil et al. (2011).
7 Conclusions
In the present study of the dynamics of line plumes on the bottom plate in turbulent convection, we identified longitudinal motion, lateral merging and initiation as points as the predominant types of motion of these line plumes. The primary conclusions about these three types of motion of the plumes are as follows.
-
1.
The magnitude and scaling of the mean longitudinal motion along the plumes () at any instant is same as that of the large scale flow.
-
2.
The mean lateral merging velocity () at any instant scales as the velocity scale near the plate and are an order smaller than the large scale velocity.
-
3.
The mean time for initiation of plumes , the diffusive time scale near the plate.
These conclusions were obtained from experiments in thermally driven turbulent convection in air (), water ( to ) and in concentration driven convection in water () over a six decade range of Rayleigh numbers (). The velocities of the plumes were measured from visualisations in a horizontal plane close to the bottom plate, by laser scattering of smoke particles, electrochemical method and PLIF for the three experiments respectively.
Among the three major types of motion of plumes, merging seems to occur in a large fraction of the area of the plate for the range of and in our experiments. The fraction of the length of the plumes that undergo merging () reduced from about 90% at to about 55% at ; these fractions becoming larger with increase in (8). We found that scales as (8). Interestingly, the fraction of the plume length affected by shear had an exact inverse dependence on and (5), so that the product of the lengths of plumes that merge and are affected by shear is a constant fraction of the square of the total plume length (9).
The plumes merge all over the planform with a range of velocities so that the merging velocities () show a distribution at any and . Such a distribution is partly caused by the spatially and temporally varying shear field near the plate due to the large scale flow, since shear reduces the merging velocities. We found that the distribution of merging velocities have a common log-normal distribution at all and ; however the mean and standard deviations of the distributions increased with increase in and decrease in (§ 5.3.3). Plumes merged faster, with their merging velocities spread over increasing ranges, with increase in and decrease in . Significantly, each merging instance of adjacent plumes occurs with a constant velocity. As we show from a control volume balance, such constant occurs since is proportional to the average entrainment velocity () at the sides of the plumes (15). During a merging cycle at a given , the strength of two adjacent plumes remains constant, and hence which is proportional to the plume rise velocities, too is a constant.
Using similarity solutions of Gebhart et al. (1970) for estimating and relations for the mean plume spacing, to relate heat flux into the plumes to the heat flux into the plate, we obtained scaling laws for , the mean merging velocities. (28), the appropriate velocity scale near the plate, where (2) is the relevant length scale near the plate in turbulent convection. The Reynolds number in terms of and layer height scales as (30) or as the dimensionless flux (38). The above relations also implied that made dimensionless by the appropriate variables near the plate, in terms of the Reynolds number () and Froude number (, where ) near the plate remains invariant for a given fluid (33)(35).
We gratefully acknowledge the partial financial support by DST, Govt. of India under the grants SR/FST/ETII-017/2003 and SR/S3/MERC/028/2009 for this study. The experiments at were conducted at DLR, Gottingen; we acknowledge the financial support of STAR programme of DAAD and IITM for these experiments. We are grateful to D. Schmeling, J. Bosbach, O. Shishkina and C. Wagner for their hospitality at Gottingen. BAP is grateful to J.H. Arakeri for his guidance for the experiments at , that were conducted at IISc, Bangalore.
References
- Ahlers et al. (2012) Ahlers, G., Bodenschatz, E., Funfschilling, D., Grossmann, S., He, X., Lohse, D., Stevens, R. J. A. M. & Verzicco, R. 2012 Logarithmic temperature profiles in turbulent Rayleigh-Bénard convection. Phys. Rev. Lett. 109, 114501.
- Ahlers et al. (2009) Ahlers, G., Grossman, S. & Lohse, D. 2009 Heat transfer and large-scale dynamics in turbulent Rayleigh-Bénard convection. Rev. Mod. Phys 81, 503.
- Baker (1966) Baker, J. D. 1966 A technique for the precise measurement of small flow velocities. J.Fluid Mech. 26 (3), 573–575.
- Bosbach et al. (2012) Bosbach, J., Weiss, S. & Ahlers, G. 2012 Plume fragmentation by bulk interactions in turbulent Rayleigh-Bénard convection. Phs. Rev. Let. 108, 054501.
- Fuji (1963) Fuji, T. 1963 Theory of the steady laminar natural convection above a horizontal line source and a point heat source. Intl J. Heat Mass Transfer 6, 597–606.
- Gebhart et al. (1970) Gebhart, B., Pera, L. & Schorr, A. W. 1970 Steady laminar natural convection plume above a horizontal line heat source. Intl J. Heat Mass Transfer 13, 161–171.
- Gunasegarane (2013) Gunasegarane, G. S. 2013 Structure and dynamics of plumes in turbulent convection. PhD thesis, Dept. of Applied Mechanics, IIT Madras.
- Haramina & Tilgner (2004) Haramina, T. & Tilgner, A. 2004 Coherent structures in boundary layers of Rayleigh-Bénard convection. Phys. Rev. E 69 (056306).
- Hogg & Ahlers (2013) Hogg, J. & Ahlers, G. 2013 Reynolds number measurements for low-Prandtl-number turbulent convection of large aspect-ratio samples. Jl. Fluid. Mech. Submitted.
- Howard (1964) Howard, L. N. 1964 Convection at high Rayleigh number. In Proc. 11th Int. congress applied mechanics, Munich (ed. H. Gortler), pp. 1109–1115.
- Husar & Sparrow (1968) Husar, R. B. & Sparrow, E. M. 1968 Patterns of free convection flow adjacent to horizontal heated surfaces. Intl J. Heat Mass Transfer 11, 1208–1211.
- Pera & Gebhart (1973) Pera, L. & Gebhart, B. 1973 On the stability of natural convection boundary layer flow over horizontal and slightly inclined surfaces. Intl J.Heat Mass Transfer 16, 1147–1163.
- Puthenveettil et al. (2005) Puthenveettil, B. A., Ananthakrishna, G. & Arakeri, J. H. 2005 Multifractal nature of plume structure in high Rayliegh number convection. J. Fluid Mech. 526, 245–256.
- Puthenveettil & Arakeri (2005) Puthenveettil, B. A. & Arakeri, J. H. 2005 Plume structure in high Rayleigh number convection. J. Fluid Mech. 542, 217–249.
- Puthenveettil & Arakeri (2008) Puthenveettil, B. A. & Arakeri, J. H. 2008 Convection due to an unstable density difference across a permeable membrane. J. Fluid Mech. 609, 139–170.
- Puthenveettil et al. (2011) Puthenveettil, B. A., Gunasegarane, G. S., Yogesh, K. A., Schmeling, D., Bosbach, J. & Arakeri, J. H. 2011 Length of near-wall plumes in turbulent convection. J.Fluid Mech. 685, 335–364.
- Qiu & Xia (1998) Qiu, X.-L. & Xia, K.-Q. 1998 Spatial structure of the viscous boundary layer in turbulent convection. Phys. Rev. E 58, 5816–5820.
- Ramareddy & Puthenveettil (2011) Ramareddy, G. V. & Puthenveettil, B. A. 2011 The regime of convection across horizontal permeable membrane. J.Fluid Mech. 679, 476–504.
- Schneider (1981) Schneider, W. 1981 Flow induced by jets and plumes. J. Fluid Mech. 108, 55–65.
- Shi et al. (2012) Shi, N., Emran, M. S. & Schumacher, J. 2012 Boundary layer structure in turbulent Rayleigh–Bénard convection. J. Fluid Mech. 706, 5–33.
- Shishkina & Thess (2009) Shishkina, O. & Thess, A. 2009 Mean temperature profiles in turbulent Rayleigh–Bénard convection of water. J. Fluid. Mech. 633, 449–460.
- Shishkina & Wagner (2008) Shishkina, O. & Wagner, C. 2008 Analysis of sheet-like thermal plumes in turbulent Rayleigh-Bénard convection. J. Fluid Mech. 599, 383–404.
- Spangenberg & Rowland (1961) Spangenberg, W. G. & Rowland, W. G. 1961 Convective circulation in water induced by evaporative cooling. Phys. Fluids 4 (6), 743–750.
- Theerthan & Arakeri (1998) Theerthan, S. A. & Arakeri, J. H. 1998 A model for near wall dynamics in turbulent Rayleigh-Bénard convection. J. Fluid Mech. 373, 221–254.
- Theerthan & Arakeri (2000) Theerthan, S. A. & Arakeri, J. H. 2000 Planform structure and heat transfer in turbulent free convection over horizontal surfaces. Phys. Fluids 12, 884–894.
- Xia et al. (2002) Xia, K. Q., Lam, S. & Zhou, S. Q. 2002 Heat flux measurement in high Prandtl number turbulent Rayleigh-Bénard convection. Phys. Rev. Lett. 88(6) (064501).
- Zhou & Xia (2010) Zhou, Q. & Xia, K. Q. 2010 Physical and geometrical properties of thermal plumes in turbulent Rayleigh-Bénard convection. New J. Phys. 12 (075006).
- Zocchi et al. (1990) Zocchi, G., Moses, E. & Libchaber, A. 1990 Coherent structures in turbulent convection, an experimental study. Physica A 166, 387–407.