The Globular Cluster NGC 6402 (M14). I. A New BV Color-Magnitude Diagram111Based on observations obtained with the 0.9m telescope at the Cerro Tololo Interamerican Observatory, Chile, operated by the SMARTS consortium.
Abstract
We present photometry of the Galactic globular cluster NGC 6402 (catalog ) (M14), based on 65 frames and 67 frames, reaching two magnitudes below the turn-off level. This represents, to the best of our knowledge, the deepest color-magnitude diagram (CMD) of NGC 6402 (catalog ) available in the literature. Statistical decontamination of field stars as well as differential reddening corrections are performed in order to derive a precise ridgeline and derive physical parameters of the cluster therefrom.
We discuss previous attempts to derive a reddening value for the cluster, and argue in favor of a value , which is significantly higher than indicated by either the Burstein & Heiles or Schlegel et al. (corrected according to Bonifacio et al.) interstellar dust maps. Differential reddening across the face of the cluster, which we find to be present at the level of mag, is taken into account in our analysis. We measure several metallicity indicators based on the position of the red giant branch (RGB) in the cluster CMD. These give a metallicity of in the Zinn & West scale and in the new Carretta et al. (UVES) scale. We also provide measurements of other important photometric parameters for this cluster, including the position of the RGB luminosity function “bump” and the horizontal branch (HB) morphology. We compare the NGC 6402 (catalog ) ridgeline with the one for NGC 5904 (M5) (catalog ) derived by Sandquist et al., and find evidence that NGC 6402 (catalog ) and M5 (catalog ) have approximately the same age, to within the uncertainties – although the possibility that M14 may be slighlty older cannot be ruled out.
Subject headings:
stars: Hertzsprung-Russell diagram — stars: variables: other — Galaxy: globular clusters: individual (NGC 6402) — galaxies: dwarf — galaxies: star clusters1. Introduction
NGC 6402 (M14, = 17:37:36.1, = -03:14:45, J2000) is a moderately high-metallicity globular cluster (GC), with . It is located 9.3 kpc away from the Sun and 4.0 kpc from the Galactic center. M14 has core and half-light radii of and , respectively. Being located fairly closely to the Galactic plane with , , it is also fairly highly reddened, with . Its fairly high reddening properly explains why, in spite of M14’s being the 10th brightest Galactic GC, with , it has been quite neglected in the literature.222Unless otherwise stated, all of the quoted information was taken from the 2010 edition of the Harris (1996, 2010) catalog.
Indeed, very few color-magnitude diagrams (CMDs) of the cluster have been obtained in the past. To our knowledge, there are only five published CMDs. The first two, by Mironov (1973) and Kogon & Wehlau (1974), were only capable of reaching (barely) the horizontal branch (HB) level, being severely dominated by photometric errors. In spite of these limitations, Kogon & Wehlau drew attention to the lack of HB stars to the red of the instability strip, despite what is expected for such a high-metallicity cluster. Such a lack of red HB stars is also apparent in the CMDs of Shara et al. (1986) and Cote et al. (1997). Instead, a long extension of the blue HB of the cluster also became evident from these studies, particularly the latter. The (snapshot) HST photometry of Piotto et al. (2002) revealed more clearly the unusual HB morphology of M14, with stars extending through the RR Lyrae gap to an extended blue tail reaching the main sequence (MS) turnoff level. M14 is thus a prime example of a second-parameter cluster (see, e.g., Catelan, 2009, for a recent review and extensive references), in the sense that it has too blue an HB morphology for its metallicity. Yet, the cluster is not included in any of the recent, extensive studies of GC ages (e.g., Rosenberg et al., 1999; Salaris & Weiss, 2002; De Angeli et al., 2005; Marín-Franch et al., 2009; Dotter et al., 2010; VandenBerg et al., 2013).
Additional interest in M14 is provided by the fact that it is an object which has a suspected extragalactic origin (e.g., Gao et al., 2007). Several properties of M14 support this possibility. GCs with long blue HB tails, such as M14, have been found to differ in mass and kinematics with respect to GCs without such blue HB tails, possibly pointing to an extragalactic origin for the former (Lee et al., 2007). In addition, M14 shares with Cen (NGC 5139) the peculiar characteristic of possessing a CH star (Cote et al., 1997): such stars are more commonly found in dwarf spheroidal galaxies, and indeed Cen has been suggested to be the (present or former) nucleus of one such dwarf (see, e.g., Carretta et al., 2010). In addition, based on the properties of its RR Lyrae stars, M14 is also found to be an Oosterhoff-intermediate GC (Contreras et al. 2013, in preparation, hereinafter Paper II), which is unusual for Galactic GCs, but not so for nearby extragalactic GCs (e.g., Catelan, 2009). A more detailed discussion of the possible extragalactic origin of the cluster will be presented in Paper II.
This is the latest in our series of papers dealing with the CMDs and variable star content in Galactic GCs (e.g., Contreras et al., 2010; Zorotovic et al., 2009, 2010). Here we present a deep CMD for the cluster M14, reaching about 2 mag deeper than the MS turn-off. In Contreras et al. (2013) we will describe our comprehensive analysis of the variable star content in the cluster.
2. Observations and Data Reduction
Time-series , , and photometry was obtained with the 0.9m telescope at CTIO during 16 nights between June 22-July 12 2007, comprising a total of 67, 65, and 62 images in , , and , respectively. Typical exposure times of 600s in , and 150s in were used, and the typical seeing was 1.8″. A 20482046 CCD detector with a pixel scale of 0.369″/pixel, equivalent to a field size of , was used for image acquisition. The detector has a readout noise and gain of 2.7 and 0.6/ADU, respectively. The -band data were used only to supplement the variability study that is described in Paper II.
PSF photometry of the images was performed using DAOPHOT II/ALLFRAME (Stetson, 1994). For calibration purposes, five different Landolt (1992) standard fields were observed, comprising a total of 39 standard field images in each filter, giving a total of 220 standard star observations. The color range spanned from to in B V, and the airmass varied from 1.07 to 2.27, with a seeing range of . Standard IRAF333IRAF is distributed by the National Optical Astronomy Observatory, which is operated by the Association of Universities for Research in Astronomy (AURA) under cooperative agreement with the National Science Foundation. routines were used to produce the final calibrations for , , and filters. The derived calibration equations are as follows:
| (1) | |||||
| (2) | |||||
| (3) | |||||
(where lower-case letters indicate instrumental magnitudes and is the airmass), with an rms scatter of 0.036, 0.031, and 0.028 mag for the , , and solutions, respectively.
3. Color-Magnitude Diagram
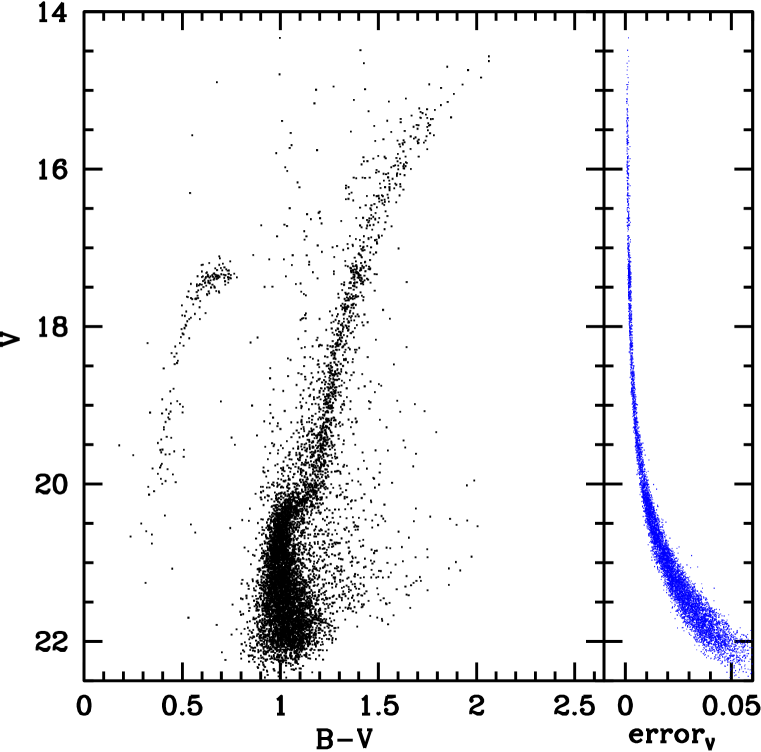
In Figure 1 we show the resulting CMD from the DAOPHOT II/ALLFRAME photometry, after removing stars lying within the innermost regions of the cluster (), which are badly affected by crowding. In addition, known variable stars (see Paper II) were also removed from the CMD.
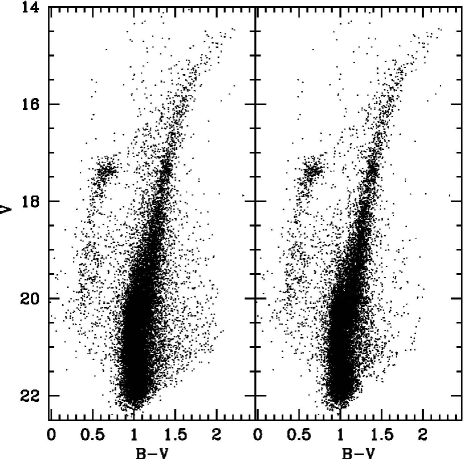

In order to estimate the physical parameters of the cluster from its CMD, it is necessary to define with high precision the cluster ridgeline. However, it is evident from Figure 1 (upper panels) that there is a significant amount of contamination by field stars. In order to account for this effect, we perform statistical decontamination of the observed CMD following the method described in Gallart et al. (2003), with a maximum distance parameter of . This method requires the use of a control field; ideally we would use stars lying outside the tidal radius (; Harris, 2010) of the cluster. Unfortunately, given the small field of view of the telescope compared to the area of M14, this was not possible in practice. For this reason, the control field is defined by using the Besançon Galactic models (Robin et al., 2003), using as input the relevant parameters for M14, i.e. distance, , , projected area in the sky, and reddening – with the latter defined as (see §3.1). We note that in the method of Gallart et al. (2003) both the ratio between cluster and control field areas and completeness need to be taken into account. As to the first effect, we note that the area of the Besançon control field was chosen to be the same as the area covered by the cluster in the CCD. The second effect becomes important at mag, i.e the magnitude at which the number of star per magnitude bin started to drop, thus not affecting the general shape of the cluster’s CMD – and was thus ignored.
In Figure 1 we present the result of the statistical decontamination. Here it is possible to observe that some branches, particularly the RGB and the HB, reveal some spread which is larger than would be expected from photometric errors alone. This is especially evident towards the upper part of the CMD. This could be caused by the presence of differential reddening, of the order of several millimagnitudes, across the face of the cluster – which would not be unusual, given the high level of extinction in the direction of M14.
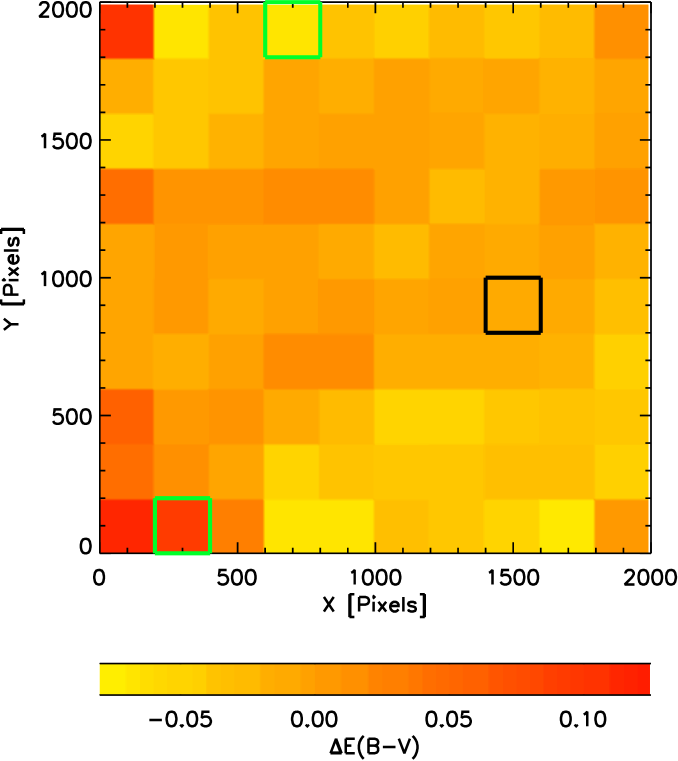
To correct for the effect of differential reddening, we followed Piotto et al. (1999), dividing the image in one hundred pix2 subsections and constructing a CMD for each. We arbitrarily selected one of the sections as the reference and extracted its fiducial points by drawing a line by hand. Then, a spline function was fitted to the fiducial points thus obtained, in order to obtain a continuous reference line. Figure 2 illustrates the detected shifts with respect to this reference line, of stars belonging to two of these small subsections. The reddening vector is also shown in this plot, for clarity.
For each subsection, we determine the distance, along the reddening vector [defined by ], between each star with and and the reference fiducial CMD ridgeline. Then, for each star is represented by the abscissa of the distance vector, with the total relative reddening in the corresponding subsection defined as the median value of the abscissa in all of the distances. The resulting differential reddening map is presented in Figure 3, implying a total range in reddening at the level of mag. Every star is then corrected for this differential reddening effect based on its position in the image.
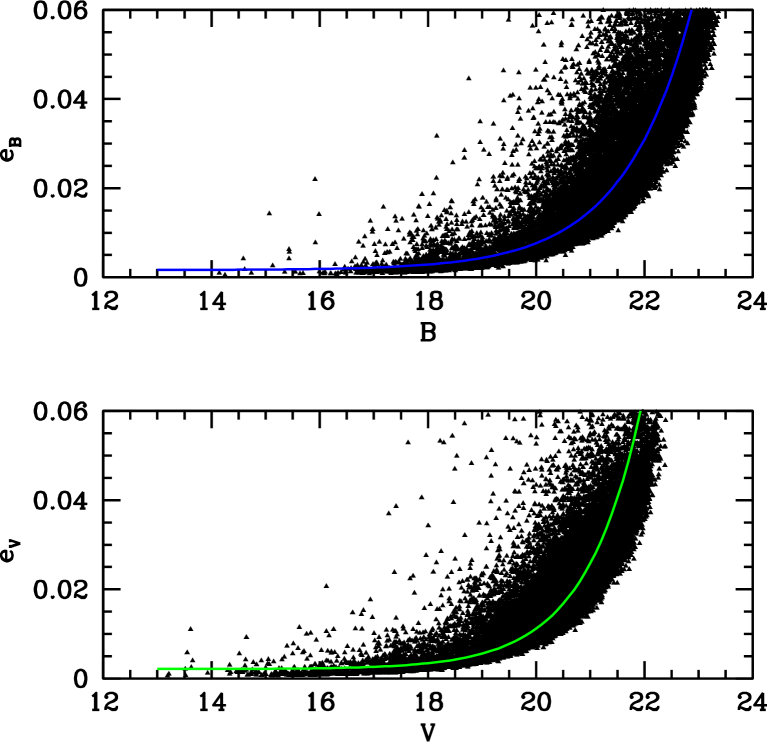
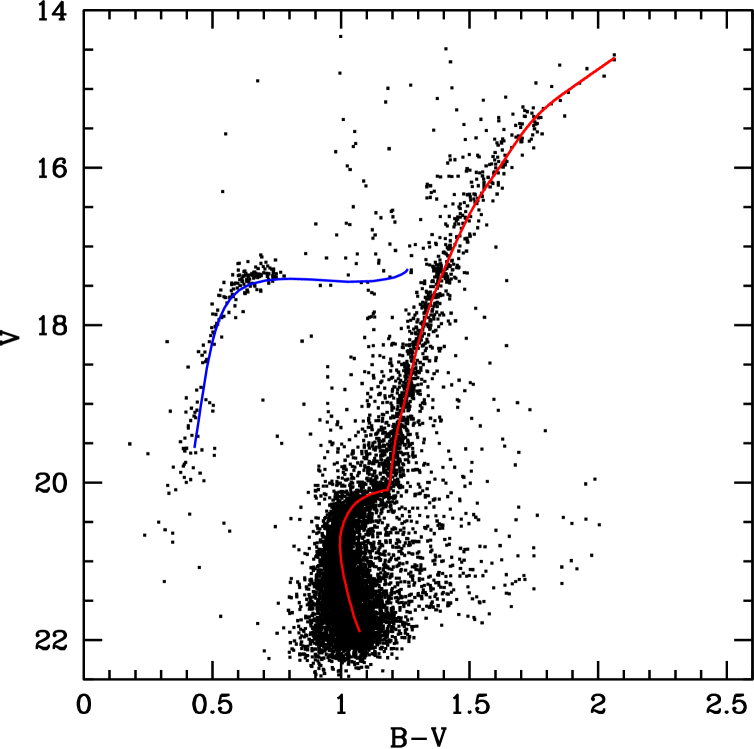
To further clean our CMD, stars with too large errors compared to what would be expected at their magnitude levels, in both and , were excluded. An exponential function was fitted to the median values of the error at each magnitude level (Fig. 4), and then all stars with errors falling above the fitted line were excluded. This leads to our final CMD for the cluster, which is shown in Figure 5. The corresponding photometry is given in Table 1.
| Star | |||||||
|---|---|---|---|---|---|---|---|
| ID-0001 | 17:37:14.32 | -03:11:40.41 | 22.743 | 0.041 | 21.853 | 0.047 | -0.041 |
| ID-0002 | 17:37:14.56 | -03:14:10.73 | 22.133 | 0.030 | 20.928 | 0.021 | -0.032 |
| ID-0003 | 17:37:14.57 | -03:18:27.63 | 22.026 | 0.029 | 21.091 | 0.025 | -0.001 |
| ID-0004 | 17:37:14.60 | -03:12:12.79 | 20.767 | 0.009 | 19.552 | 0.007 | -0.050 |
| ID-0005 | 17:37:14.60 | -03:15:12.44 | 21.517 | 0.019 | 20.547 | 0.014 | -0.022 |
| ID-0006 | 17:37:14.63 | -03:18:14.16 | 22.607 | 0.043 | 21.399 | 0.033 | -0.001 |
| ID-0007 | 17:37:14.71 | -03:12:32.83 | 21.679 | 0.020 | 20.690 | 0.015 | -0.050 |
| ID-0008 | 17:37:14.79 | -03:14:53.64 | 22.481 | 0.035 | 21.484 | 0.031 | -0.022 |
| ID-0009 | 17:37:14.82 | -03:13:38.02 | 22.748 | 0.043 | 21.703 | 0.038 | -0.032 |
| ID-0010 | 17:37:14.84 | -03:15:47.59 | 22.601 | 0.038 | 21.620 | 0.041 | -0.022 |
| ID-0011 | 17:37:15.30 | -03:12:54.26 | 23.065 | 0.058 | 21.954 | 0.046 | -0.050 |
| ID-0012 | 17:37:15.73 | -03:09:32.98 | 22.582 | 0.038 | 21.705 | 0.036 | -0.048 |
3.1. Mean Reddening
The result for metallicity strongly depends on the adopted reddening for the cluster. In this section, we discuss the information regarding the reddening estimate, , for M14, as provided in the literature. Before continuing, however, we note that Burstein & Heiles (1978) list, in their Table 1, for M14. However, this is taken from a previous publication by Lee (1977), where the author studied the properties of M4 (NGC 6121), not M14. Thus, we will not consider this value further in our analysis.
3.1.1 Dust Maps
Information from three all-sky Galactic extinction maps are found in the literature. Amôres & Lépine (2005) give for their axisymmetric gas distribution model, and for their spiral model, which takes into account the spiral structure of the Galaxy. Burstein & Heiles (1982) maps give an estimate of for M14, whereas the dust maps from Schlegel et al. (1998, SFD98) give . However, there are some indications that the latter may overestimate for high reddening values (e.g., Bonifacio et al., 2000; Amôres & Lépine, 2005). In particular, Bonifacio et al. recommend applying a correction to the SFD98 values, for , following the expression (their Eq. 1). This leads to a corrected reddening value of , which is much closer to the Burstein & Heiles and Amôres & Lépine values. We note, in this sense, following Willick (1999), that dust maps may indeed suffer from systematic errors. SFD98 maps are based on IRAS/DIRBE measurements of diffuse infrared (IR) emission. Therefore, the presence of cold dust, which is invisible to IRAS, could affect their extinction estimate. The older Burstein & Heiles estimates, on the other hand, are based on the 21-cm column density and faint galaxy counts, and thus any variable dust-to-gas ratio or galaxy count fluctuations would also affect their value. Accordingly, Harris (1996, 2010) does not take into account the results of extinction maps in the estimation of for any of the clusters listed in his catalog.
3.1.2 Photometric Studies
Kogon & Wehlau (1974), comparing the blue edge of the RR Lyrae instability strip to that of other GCs, and by using the method of Sturch (1966) of comparing the colors of RR Lyrae stars at minimum light, obtained . However, inspection of the CMD published in their work reveals that the HB is close to the faint end of their photometry, which is badly affected by photometric errors, thus also affecting their estimation of . In fact, the assigned error for their reddening estimate is 0.17 mag. Kogon & Wehlau also list the metallicity indicator to be 1.9 mag; using Equation 3 in Ferraro et al. (1999) results in a metallicity of in the Zinn & West (1984) scale, which is too high compared to the currently accepted value for M14 (Harris, 1996, 2010, see §1).
Mironov (1973) lists two possible values, namely (from the blue end of the RR Lyrae region) and (from the morphology of his CMD for the cluster). These values agree, within the errors, with those listed by Kogon & Wehlau (1974). However, as in the case of Kogon & Wehlau, Mironov’s results are also strongly affected by the limit in their photometry, and so we decided not to use the values from either of these early studies in our final estimation.
3.1.3 Integrated Color-Spectral Type Relation
Harris (1996, 2010) lists , which is a simple mean of the values listed in Webbink (1985), namely (from Racine, 1973); Reed et al. (1988), ; and Zinn (1985), (based on the cluster’s integrated colors).
The relatively high reddening estimate coming from Reed et al. (1988) seems to be incorrect. Reed et al.’s value comes from the relation between the intrinsic color of GCs and their respective spectral types, taken from Hesser & Shawl (1985). However, M14 does not follow the tight relation found for most of the clusters in the Reed et al. study, with the authors suggesting that Mironov’s (1973) estimate should be used, rather than the one found in their own work.
Indeed, based on the Hesser & Shawl (1985) study, we see that a spectral type F4 is found for M14.444The Harris (1996, 2010) catalog also lists this spectral type for M14, based on Hesser & Shawl (1985). However, according to these authors, such a spectral type appears to be too early, the same being noted also by Reed et al. (1988). Other methods (e.g., Kinman, 1959) classify M14 as having a spectral type F7/8. Taking such a revised spectral type into account in the Reed et al. calibration, one finds for M14.
Given the uncertainties in the all-sky Galactic extinction maps and of the previous photometric studies of M14, we follow Harris (1996, 2010) and estimate the reddening of M14 by taking a straight average over the values found in Webbink (1985), Zinn (1985), and Reed et al. (1988) (after suitably revising the cluster’s spectral type, as just noted). Finally, we obtain . We again note that this is significantly higher than the values derived on the basis of reddening maps (see §3.1.1).
3.2. Metallicity and Reddening
In Figure 5 we show the CMD of M14, after performing the corrections for field contamination and differential reddening explained above. The morphology of the CMD is consistent with what was found in previous works (Piotto et al., 2002; Cote et al., 1997), confirming that the cluster does indeed contain an extended blue HB. However, our work is the first to clearly reach beyond the MS turn-off level, and to confirm the presence of blue HB stars at least as faint as the turn-off point in . Conversely, we do not identify a prominent red HB component, contrary to what is commonly seen at such moderately high metallicities – thus confirming that the cluster is indeed a second-parameter object.
Based on our CMD, we estimate the metallicity of M14 by determining the photometric indices from Ferraro et al. (1999). In order to use their equations, we first need to precisely determine the cluster’s ridgeline, and most importantly the HB level, since any changes in this level will affect our final results. To determine the ridgeline, we follow the method described in (e.g.) Zorotovic et al. (2009) and Stetson et al. (2005): we first determine our fiducial points for the cluster by visual inspection, and then fit a cubic spline to the fiducial points of the RGB thus derived. The spline fit to the fiducial points of the RGB, along with the mean ridgeline of the MS, can be observed in Figure 6. The fiducial points derived for the cluster are also given in Table 2.
| 14.611 | 2.062 |
| 14.800 | 1.978 |
| 14.999 | 1.889 |
| 15.210 | 1.805 |
| 15.499 | 1.720 |
| 15.740 | 1.668 |
| 15.999 | 1.615 |
| 16.240 | 1.565 |
| 16.492 | 1.516 |
| 16.734 | 1.478 |
| 16.993 | 1.441 |
| 17.244 | 1.408 |
| 17.494 | 1.376 |
| 17.735 | 1.348 |
| 17.995 | 1.321 |
| 18.229 | 1.300 |
| 18.495 | 1.281 |
| 18.754 | 1.263 |
| 18.995 | 1.246 |
| 19.214 | 1.228 |
| 19.571 | 1.207 |
| 19.727 | 1.200 |
| 19.978 | 1.191 |
| 20.000 | 1.190 |
| 20.050 | 1.185 |
| 20.100 | 1.180 |
| 20.100 | 1.167 |
| 20.150 | 1.114 |
| 20.200 | 1.083 |
| 20.250 | 1.060 |
| 20.300 | 1.046 |
| 20.350 | 1.035 |
| 20.400 | 1.025 |
| 20.450 | 1.018 |
| 20.500 | 1.011 |
| 20.550 | 1.007 |
| 20.600 | 1.002 |
| 20.650 | 0.999 |
| 20.700 | 0.997 |
| 20.750 | 0.996 |
| 20.800 | 0.995 |
| 20.850 | 0.996 |
| 20.900 | 0.998 |
| 20.950 | 0.999 |
| 21.000 | 1.000 |
| 21.100 | 1.005 |
| 21.200 | 1.011 |
| 21.300 | 1.019 |
| 21.400 | 1.025 |
| 21.500 | 1.033 |
| 21.600 | 1.042 |
| 21.700 | 1.049 |
| 21.800 | 1.061 |
| 21.900 | 1.073 |
Ferraro et al. (1999) use as the HB level the empirical zero-age HB (ZAHB), which is defined by them as the magnitude of the lower envelope of the observed HB distribution in the region with . This amounts to the effectively “horizontal” part of the HB in the CMD, where unfortunately M14 does not contain many stars. Moreover, this region of the CMD may also suffer from uncertainties in our procedure to perform statistical decontamination. In view of these limitations, we decided to use a theoretical ZAHB from VandenBerg et al. (2006) for a chemical composition (see below), and an enhancement of the -elements given by , as typically found among Galactic GC stars (e.g. Carney, 1996; Sneden, 2004). We use (§3.1), and vertically shift the theoretical ZAHB to match the lower envelope of our observed blue HB distribution (Fig. 7). The HB level is then determined as the mean magnitude of the ZAHB in the region . This gives .
Using our mean ridgeline, we derive the RGB parameters , , , , , and . For the first four among these indices we need to correct our observed colors by extinction, which was done by assuming once again . The RGB parameters and the respective metallicities derived on the basis of each index are listed in Table 3. A straight average over the derived values gives in the Carretta & Gratton (1997) scale. This corresponds, following Eq. 7 in Carretta & Gratton, to a value in the Zinn & West (1984) scale. This is close to the value listed in the 2003 edition of the Harris (1996) catalog, namely , but slightly lower than the value provided in the 2010 edition of this catalog (Harris, 2010), namely . The latter value is, however, in the new UVES spectroscopic scale of Carretta et al. (2009). Using the transformation relations given in Carretta et al., our metallicity value translates into , in excellent agreement with Harris (2010). Indeed, we obtain a mean value , based on the different photometric indicators (Table 3).
The indices and are independent of the assumed reddening of the cluster, and thus can be used as a check of the adopted reddening value and derived metallicity. From Table 3 we can see that the values of [Fe/H] obtained with these two slopes do not differ from those obtained with reddening-dependent indices. Indeed, based on and we derive and , respectively. It is thus possible to conclude that the assumed value of , which implies , must be close to the correct reddening for M14, to within mag in .
| Parameter | |||
|---|---|---|---|
| Mean |
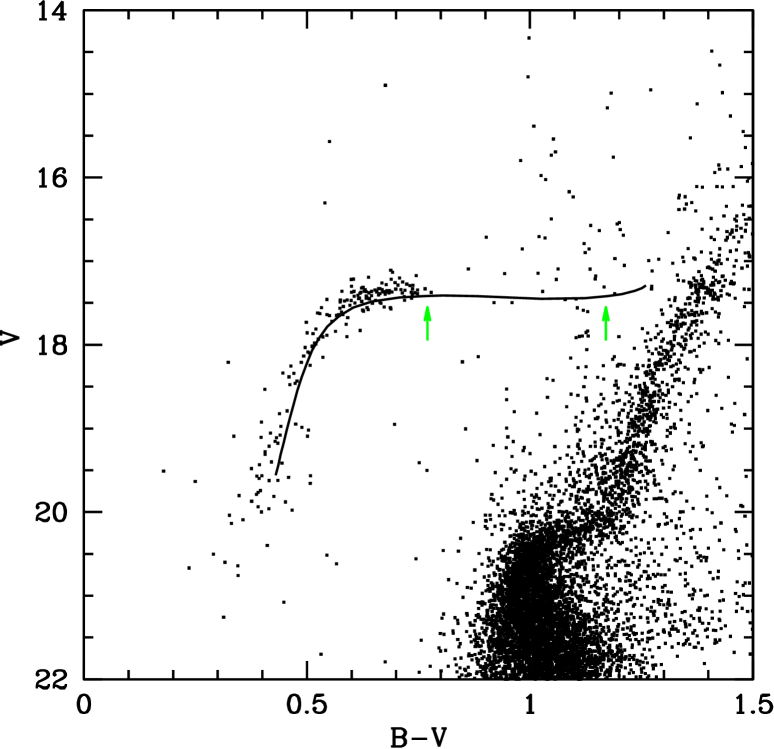
3.3. Horizontal Branch Morphology
As mentioned above, NGC 6402 presents an unusually blue HB for its metallicity. We attempt, in the following, to describe its HB morphology through widely used parameters, such as the Lee-Zinn parameter (Zinn, 1986; Lee, 1990; Lee et al., 1990) and the Buonnano parameter (Buonanno, 1993; Buonanno et al., 1997). These are defined as follows:
| (5) | |||||
| (6) |
where represents the number of blue-HB stars bluer than and represent the number of blue, red, and variable stars in the HB (RR Lyrae), respectively. Two other parameters are also presented in this study, both defined by Preston et al. (1991): , or the mean unreddened color of blue HB stars with , and , defined as the number of stars in the given range in color, normalised by the number of blue HB stars with .
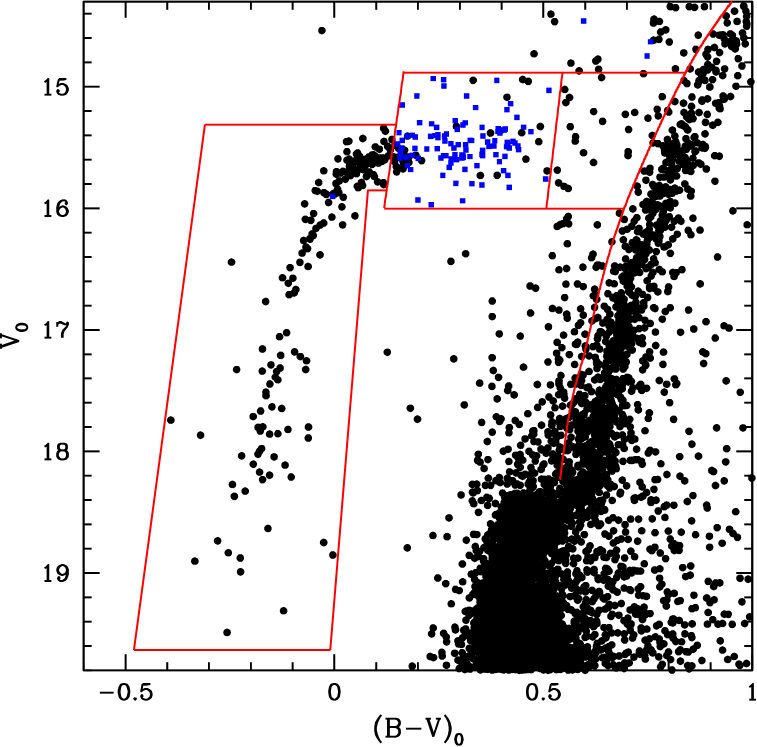
Blue, red and variable stars in the HB were selected following the boundary regions shown in Figure 8. The criteria adopted can be summarized as follows.
-
•
number of red HB stars: The red HB region is limited, at its red end, by the RGB ridgeline minus 0.08 mag, corresponding to the (somewhat arbitrary) blue limit that was set to select stars in the study of the RGB bump in §3.4. The faint limit is set as the lower envelope of the observed RR Lyrae distribution, whereas the bright limit was adopted at , as needed in order to separate HB stars from asymptotic giant branch stars (Buonanno et al., 1994). Finally the blue limit is set by the red limit of the RR Lyrae distribution.
-
•
number of RR Lyrae stars: This quantity is taken from Paper II, corresponding to all RR Lyrae found within the same magnitude limits as defined for red HB stars.
-
•
number of stars contained in the fainter/bluer selection box shown in Figure 8: The limits of this selection box are set by hand, in order to include likely faint blue HB stars affected by large photometric errors.
We note that “constant” stars lying within the selection box are defined as red or blue HB stars, depending on its distance to either one of these groups.
The number of stars selected for each region as explained above, and the resulting parameters of the morphology of the HB are presented in Table 4.
The computed value of is much lower than the one found in the literature for this cluster (, see Catelan, 2009, and references therein). The uncertainty is mainly due to the problems involved in accurately evaluating , given that it is strongly affected by the uncertainties in the CMD decontamination process. Note, in this sense, that the original value for this cluster was based on the assumption that (Lee et al., 1994).
| Parameter | Value |
|---|---|
3.4. Red Giant Branch
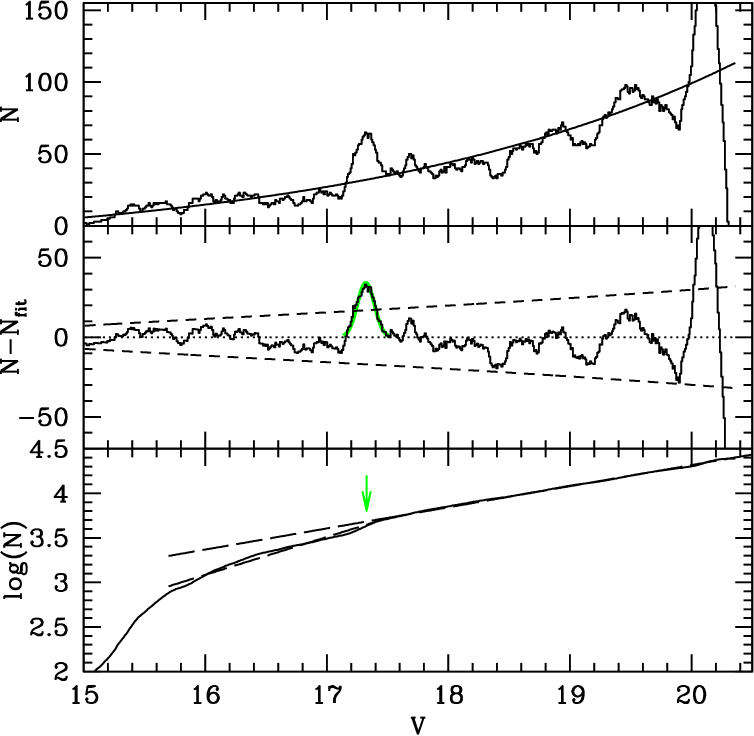
One of the most important phases in the evolution of an RGB star is the so-called RGB “bump.” This corresponds to a momentary reversal in the evolutionary path of the star, which takes place when its H-burning shell encounters the chemical composition discontinuity left behind by the maximum inward penetration of the giant’s convective envelope (see Catelan, 2007, for a review and extensive references). In order to determine the position of the RGB bump in M14, we follow the same procedure as applied by Zorotovic et al. (2009) in the case of NGC 5286. The smoothed RGB luminosity function (LF; Fig. 9, upper panel) already reveals the presence of a candidate bump at . The significance of the detection is confirmed by subtracting the expected number of stars given by a power-law fit to the LF from the number of stars in each bin, and comparing this result to the expected Poisson fluctuation level. As can be seen in the middle panel of Figure 9, the suspected bump clearly stands out as the most prominent feature (the higher peak at is due to MS stars). A Gaussian fit to the data around this feature yields , with . We accordingly estimate the final position of the bump as , which results from a compromise between the formal error of the position and the width of the Gaussian (see also Zorotovic et al., 2009). The location of the bump is also confirmed by the integrated RGB LF, as shown in the bottom panel of Figure 9.
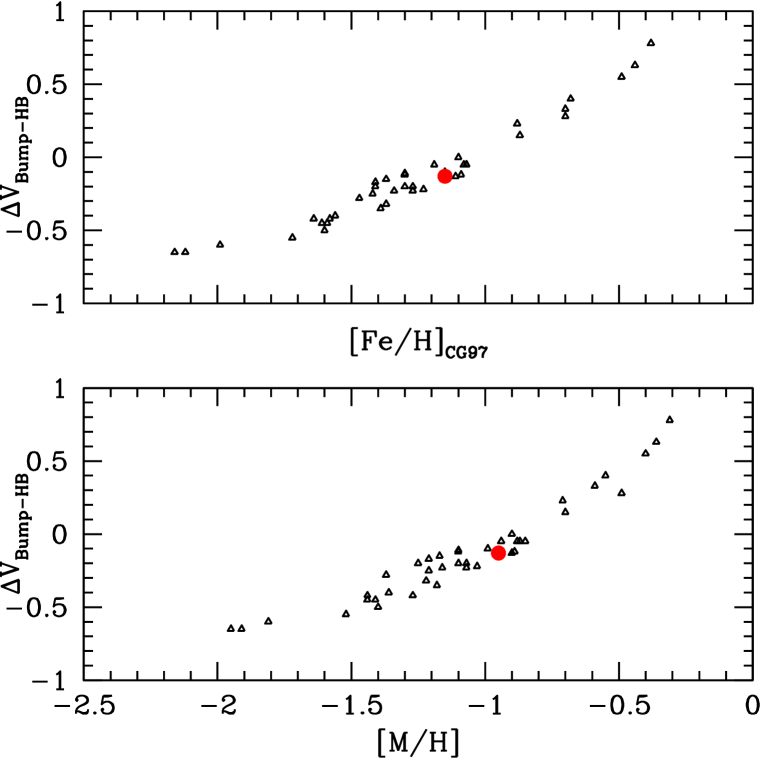
The derived position of the RGB bump and ZAHB imply a mag. As well known, this quantity is also strongly sensitive to the metallicity, and thus in Figure 10 we present as a function of [Fe/H] (upper panel) and [M/H] (lower panel), using the data from Ferraro et al. (1999). Clearly, the position of the RGB bump in M14 is consistent with our derived metallicity for the cluster, again lending support to our adopted reddening value.
4. Age
We make an attempt in determining the age of M14 by comparing to the GC M5 (Sandquist et al., 1996), using two methods.
Firstly we use the so-called method, based on the magnitude difference between the HB and TO levels. For this we follow Chaboyer et al. (1996), using their equation (2) and assuming . The latter is assumed as it corresponds to the closest match to the absolute magnitudes of RR Lyrae obtained from the recent calibration by Catelan & Cortés (2008). The HB level of M14 is determined, as described in Chaboyer et al. (1996), by using (where ), which yields . The TO level is determined by fitting a parabola to a small region of the MS near the TO point, thus obtaining and . Then, the corresponding value for M14 is , while for M5, (from Sandquist et al., 1996). This implies that M14 is Gyr older than M5.

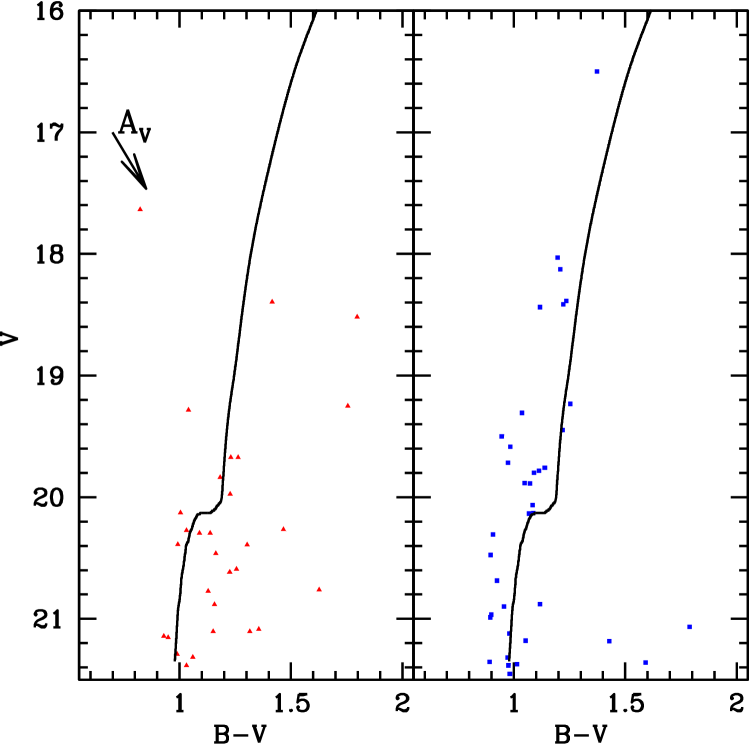
Figure 11 shows the fiducial points of M14 as determined by us and those of M5 taken from Sandquist et al. (1996). In addition, VandenBerg et al. (2006) isochrones for , , and ages ranging from 8 to 18 Gyr are also shown. For comparison with the models, we chose the closest metallicity to the Zinn & West (1984) value determined for M14.
Following Stetson et al. (1999), the model isochrones and ridgelines are translated horizontally to match each other’s turnoff colors, and then shifted vertically to register the point of the upper MS that is 0.05 mag redder than the turnoff. The age is derived using Equation (1) in Vandenberg & Stetson (1991), which requires to measure the color difference between the RGBs. Stetson et al. (1999) measure this difference at the point that lies exactly at , whereas Vandenberg & Stetson (1991) use the value determined at ; however, the latter authors recommend to perform a star-by-star statistical analysis over 1-2 magnitudes along the lower RGB, in order to more reliably measure the mean color difference between the RGBs. It is clear from Figure 11 that for our comparison, a value derived from this method will strongly depend on the point where the color difference is evaluated, thus we make no attempt on deriving an age difference. However, the data appear to suggest that M14 is slightly older than M5, and that the age difference could be as high as 2 Gyr. This is consistent with our previous estimate, based on the vertical method. A slightly older M14, compared to M5, would go in the right sense to help explain the former’s bluer HB morphology. However, our data are not sufficient to reach definite conclusions in this regard, and so we are unable to exclude the possibility that M14 and M5 have virtually the same age, to within the errors.
5. Summary
We have obtained CCD photometry for the GC M14 (catalog ). A CMD of unprecedented depth is constructed for the cluster, based on which we derive several key properties.
The CMD is found to be affected by contamination by field stars, as well as the presence of differential reddening across the face of the cluster. The latter is estimated to be present at the level of mag. After statistically subtracting the field stars, a reddening map is built, and the photometry of M14 is finally corrected for the presence of differential reddening.
RGB photometric parameters are derived as a means to obtain the cluster’s metallicity, implying dex in the Zinn & West (1984) metallicity scale, and a mean value dex on the more recent UVES scale, in excellent agreement with the value listed in the Harris (2010) catalog. We detect the RGB bump at mag, and its position is also fully consistent with the derived metallicity.
The derived photometric parameters allow us to confirm that the absolute reddening of the cluster must be close to , to within about 0.02 mag. The latter is significantly higher than implied by the dust maps of Burstein & Heiles or Schlegel et al..
HB morphology parameters are also computed, with the main difference between our results and those of previous works arising from the uncertainty in the number of stars belonging to the red part of the HB, caused by the decontamination process.
The so-called method is used to determine relative ages between M14 and M5, suggesting that M14 is only about Gyr older than M5 – a result qualitatively also supported by a comparison with model isochrones and the “horizontal” age method. Therefore, within the uncertainties, M14 and M5 have roughly the same age, although the possibility that M14 may be slightly older (by up to Gyr) cannot be ruled out.
References
- Amôres & Lépine (2005) Amôres, E. B., & Lépine, J. R. D. 2005, AJ, 130, 659
- Bonifacio et al. (2000) Bonifacio, P., Monai, S., & Beers, T. C. 2000, AJ, 120, 2065
- Buonanno (1993) Buonanno, R. 1993, in Astronomical Society of the Pacific Conference Series, Vol. 48, The Globular Cluster-Galaxy Connection, ed. G. H. Smith & J. P. Brodie, 131
- Buonanno et al. (1997) Buonanno, R., Corsi, C., Bellazzini, M., Ferraro, F. R., & Pecci, F. F. 1997, AJ, 113, 706
- Buonanno et al. (1994) Buonanno, R., Corsi, C. E., Buzzoni, A., Cacciari, C., Ferraro, F. R., & Fusi Pecci, F. 1994, A&A, 290, 69
- Burstein & Heiles (1978) Burstein, D., & Heiles, C. 1978, ApJ, 225, 40
- Burstein & Heiles (1982) —. 1982, AJ, 87, 1165
- Carney (1996) Carney, B. W. 1996, PASP, 108, 900
- Carretta et al. (2009) Carretta, E., Bragaglia, A., Gratton, R., D’Orazi, V., & Lucatello, S. 2009, A&A, 508, 695
- Carretta & Gratton (1997) Carretta, E., & Gratton, R. G. 1997, A&AS, 121, 95
- Carretta et al. (2010) Carretta, E., et al. 2010, ApJ, 714, L7
- Catelan (2007) Catelan, M. 2007, in American Institute of Physics Conference Series, Vol. 930, Graduate School in Astronomy: XI Special Courses at the National Observatory of Rio de Janeiro (XI CCE), ed. F. Roig & D. Lopes, 39–90
- Catelan (2009) Catelan, M. 2009, Ap&SS, 320, 261
- Catelan & Cortés (2008) Catelan, M., & Cortés, C. 2008, ApJ, 676, L135
- Chaboyer et al. (1996) Chaboyer, B., Demarque, P., & Sarajedini, A. 1996, ApJ, 459, 558
- Contreras et al. (2010) Contreras, R., Catelan, M., Smith, H. A., Pritzl, B. J., Borissova, J., & Kuehn, C. A. 2010, AJ, 140, 1766
- Cote et al. (1997) Cote, P., Hanes, D. A., McLaughlin, D. E., Bridges, T. J., Hesser, J. E., & Harris, G. L. H. 1997, ApJ, 476, L15
- De Angeli et al. (2005) De Angeli, F., Piotto, G., Cassisi, S., Busso, G., Recio-Blanco, A., Salaris, M., Aparicio, A., & Rosenberg, A. 2005, AJ, 130, 116
- Dotter et al. (2010) Dotter, A., et al. 2010, ApJ, 708, 698
- Ferraro et al. (1999) Ferraro, F. R., Messineo, M., Fusi Pecci, F., de Palo, M. A., Straniero, O., Chieffi, A., & Limongi, M. 1999, AJ, 118, 1738
- Gallart et al. (2003) Gallart, C., et al. 2003, AJ, 125, 742
- Gao et al. (2007) Gao, S., Jiang, B., & Zhao, Y. 2007, Chinese Journal of Astronomy and Astrophysics, 7, 111
- Harris (1996) Harris, W. E. 1996, AJ, 112, 1487
- Harris (2010) —. 2010, ArXiv e-prints
- Hesser & Shawl (1985) Hesser, J. E., & Shawl, S. J. 1985, PASP, 97, 465
- Kinman (1959) Kinman, T. D. 1959, MNRAS, 119, 538
- Kogon & Wehlau (1974) Kogon, C. S., & Wehlau, A. 1974, AJ, 79, 387
- Landolt (1992) Landolt, A. U. 1992, AJ, 104, 340
- Lee (1977) Lee, S. 1977, A&AS, 27, 367
- Lee et al. (2007) Lee, Y., Gim, H. B., & Casetti-Dinescu, D. I. 2007, ApJ, 661, L49
- Lee (1990) Lee, Y.-W. 1990, ApJ, 363, 159
- Lee et al. (1990) Lee, Y.-W., Demarque, P., & Zinn, R. 1990, ApJ, 350, 155
- Lee et al. (1994) —. 1994, Apj, 423, 248
- Marín-Franch et al. (2009) Marín-Franch, A., et al. 2009, ApJ, 694, 1498
- Mironov (1973) Mironov, A. V. 1973, Astronomicheskij Tsirkulyar, 792, 5
- Piotto et al. (1999) Piotto, G., Zoccali, M., King, I. R., Djorgovski, S. G., Sosin, C., Rich, R. M., & Meylan, G. 1999, AJ, 118, 1727
- Piotto et al. (2002) Piotto, G., et al. 2002, A&A, 391, 945
- Preston et al. (1991) Preston, G. W., Shectman, S. A., & Beers, T. C. 1991, ApJ, 375, 121
- Racine (1973) Racine, R. 1973, AJ, 78, 180
- Reed et al. (1988) Reed, B. C., Hesser, J. E., & Shawl, S. J. 1988, PASP, 100, 545
- Robin et al. (2003) Robin, A. C., Reylé, C., Derrière, S., & Picaud, S. 2003, A&A, 409, 523
- Rosenberg et al. (1999) Rosenberg, A., Saviane, I., Piotto, G., & Aparicio, A. 1999, AJ, 118, 2306
- Salaris & Weiss (2002) Salaris, M., & Weiss, A. 2002, A&A, 388, 492
- Sandquist et al. (1996) Sandquist, E. L., Bolte, M., Stetson, P. B., & Hesser, J. E. 1996, Apj, 470, 910
- Schlegel et al. (1998) Schlegel, D. J., Finkbeiner, D. P., & Davis, M. 1998, ApJ, 500, 525
- Shara et al. (1986) Shara, M. M., Potter, M., Moffat, A. F. J., Hogg, H. S., & Wehlau, A. 1986, ApJ, 311, 796
- Sneden (2004) Sneden, C. 2004, Mem. Soc. Astron. Italiana, 75, 267
- Stetson (1994) Stetson, P. B. 1994, PASP, 106, 250
- Stetson et al. (2005) Stetson, P. B., Catelan, M., & Smith, H. A. 2005, PASP, 117, 1325
- Stetson et al. (1999) Stetson, P. B., et al. 1999, AJ, 117, 247
- Sturch (1966) Sturch, C. 1966, ApJ, 143, 774
- VandenBerg et al. (2013) VandenBerg, D., Brogaard, K., Leaman, R., & Casagrande, L. 2013, in preparation
- VandenBerg et al. (2006) VandenBerg, D. A., Bergbusch, P. A., & Dowler, P. D. 2006, ApJS, 162, 375
- Vandenberg & Stetson (1991) Vandenberg, D. A., & Stetson, P. B. 1991, AJ, 102, 1043
- Webbink (1985) Webbink, R. F. 1985, in IAU Symposium, Vol. 113, Dynamics of Star Clusters, ed. J. Goodman & P. Hut, 541–577
- Willick (1999) Willick, J. A. 1999, ApJ, 522, 647
- Zinn (1985) Zinn, R. 1985, ApJ, 293, 424
- Zinn (1986) Zinn, R. 1986, in Stellar Populations, ed. C. A. Norman, A. Renzini, & M. Tosi, 73–97
- Zinn & West (1984) Zinn, R., & West, M. J. 1984, ApJS, 55, 45
- Zorotovic et al. (2009) Zorotovic, M., Catelan, M., Zoccali, M., Pritzl, B. J., Smith, H. A., Stephens, A. W., Contreras, R., & Escobar, M. E. 2009, AJ, 137, 257
- Zorotovic et al. (2010) Zorotovic, M., et al. 2010, AJ, 139, 357; Erratum: AJ, 140, 912